Night Vision System (NVS) and Driver Monitoring System (DMS) Market For Passenger Cars - by Geography - Trends and Forecasts 2014 - 2019


[285 Pages Report] The major factors driving the demand of automotive night vision system and driver monitoring system are increased safety awareness, rise in sales of premium cars, growth of global automotive industry as well as institutions such as New Car Assessment Program (NCAP) which awarding safety ratings to cars based on safety performance.
In the coming years, the increasing demand for luxury cars in the regions like Europe and Asia Pacific, mainly in China, India and Japan, is expected to drive the market.Sustainable growth in the night vision system and driver monitoring system market will largely depend upon market penetration of premium cars. The penetration of premium car is higher in developed countries, whereas, it is growing in developing countries.
The report classifies and defines the automotive night vision system and driver monitoring system market in terms of volume and value. This report provides comprehensive analysis and insights on the night vision system and driver monitoring system(both - qualitative and quantitative). The report highlights potential growth opportunities in the coming years as well as it covers review of the - market drivers, restraints, growth indicators, challenges, legislation trends, market dynamics, competitive landscape, and other key aspects w.r.t. automotive active safety systems market. The key players in the market for automotive night vision system and driver monitoring system have also been identified and profiled.
Scope of the Report
The report covers the market of automotive night vision system and driver monitoring system in terms of volume and value. Market size in terms of volume is provided from 2011 to 2019 in thousand units, whereas the value of the market is provided in $millions. The automotive night vision system and driver monitoring system market is broadly classified by geography (Asia-Pacific, Europe, North America and RoW), focusing on key countries in each region.
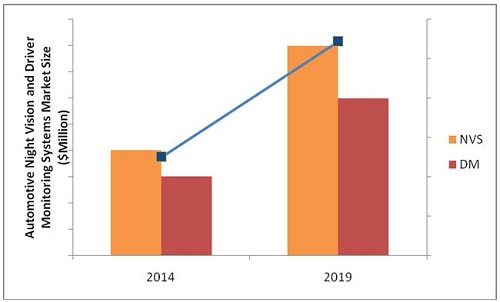
Source: MarketsandMarkets Analysis
The Night vision system and Driver monitoring system market in terms of value is projected to grow at a healthy CAGR of 18.3% and 16.3% respectively from 2014 to 2019.
Automotive safety systems have become advanced, sophisticated, and efficient over a period of time. Today, automotive industry is more inclined towards the use of advanced technologies to reduce number of accidents and mitigate the impact of accidents on occupants. Automotive safety systems have played an important role in achieving these targets, where these systems have made vehicles safer for the occupants. The recent rise in the attitude of the governments and consumers towards safety attributes of vehicles is one of the major drivers for the automotive safety system market.
Automotive active safety system has evolved from anti-lock braking system, electronic stability control to driver monitoring and other efficient automotive active safety systems. These transitions took place due to several reasons; the increasing concern of consumers towards safety and their increasing willingness to pay for occupant safety, constantly updated rating system of organizations like NCAP and highly competitive market made companies to do extensive R&D work.
Automotive night vision system and driver monitoring system are established market in North America and Europe, whereas, in Asia-Pacific and the ROW regions, the automotive night vision system and driver monitoring system are growing at a significant growth rate, because of the increase in their purchasing power, high standard of living, and GDP growth. Germany, the U.K., and the U.S. are expected to be the largest market for automotive night vision system and driver monitoring system. Developing countries like China, Russia, Brazil, and Mexico are expected to have high growth rate in the demand for automotive night vision system and driver monitoring system from 2014 to 2019.
The global automotive night vision system and driver monitoring system market is dominated by a few top players such as Robert Bosch (Germany), Autoliv Inc. (Sweden), Omron Corporation (Japan), and TRW automotive (U.S.).
Automotive Night Vision System Market Size, by Region, 2013 VS 2019 ($Million)
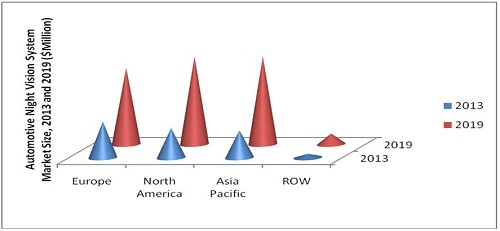
Source: MarketsandMarkets Analysis
Automotive Driver Monitoring System Market Size, by Region, 2013 VS 2019 ($Million)
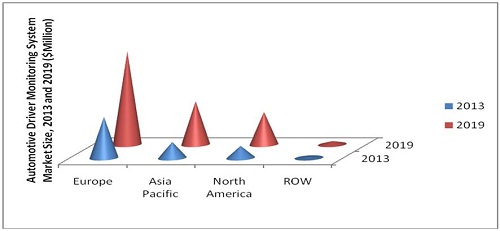
Source: MarketsandMarkets Analysis
 Exclusive indicates content/data unique to MarketsandMarkets and not available with any competitors.
Table of Contents
1 Introduction (Slide No.- 30)
1.1 Introduction & Background
1.2 Study Objectives & Value Proposition
1.3 Key Takeaways
1.4 Study Scope
1.4.1 Scope of the Report: By Region
1.4.2 Product Type
1.4.3 Product Definitions
1.5 Stake Holders
2 Research Methodology (Slide No.- 40)
2.1 Global Night Vision & Driver Monitoring Systems Market: Research Methodology
2.2 Market Crackdown & Data Triangulation
2.3 Market Size Estimation
2.3.1 Key Data Points Taken From Secondary Sources
2.3.2 Key Data Points Taken From Primary Sources
2.3.2.1 Key Industry Insight
2.3.2.2 Break Down of Primary Interviews: By Company Type, Designation, & Region
2.4 Assumptions
3 Executive Summary (Slide No.- 50)
3.1 Global Market Outlook for Night Vision & Driver Monitoring Systems
3.2 Global Market Outlook for NVS By Region
3.3 Market Outlook: Compound Annual Growth Rate of NVS for 2014-2019 (By Value)
3.4 Global Market Outlook for Driver Monitoring System By Region
3.5 Market Outlook: Compound Annual Growth Rate of Driver Monitoring System for 2014-2019 (By Value)
4 Market Overview (Slide No.- 59)
4.1 Market Drivers
4.2 Market Restraints
4.3 Market Challenges
4.4 Growth Indicators: Legislation Applicable for Driver Monitoring & Night Vision Systems
4.5 Growth Indicators: Growing Automobile Collision Rate
4.6 Value Chain Analysis
4.7 Legislation Analysis
4.7.1 Collision Trend Analysis: North America
4.7.2 Collision Trend Analysis: Europe
4.7.3 Collision Trend Analysis: APAC
4.7.4 Collision Trend Analysis: ROW
4.8 Market Metrics: Economic Growth in Terms of GDP� Europe
4.9 Market Metrics: Economic Growth in Terms of GDP�NA
4.10 Market Metrics: Economic Growth in Terms of GDP�APAC
4.11 Market Metrics: Economic Growth in Terms of GDP�ROW
5 Technological Evolution (Slide No.- 77)
5.1 Technology Roadmap: NVS
6 Night Vision System Market (2011-2019) (Slide No.- 80)
6.1 Global : Night Vision System Market Share, 2013, By Region
6.2 Global : Night Vision System Market Size, 2011-2019 ($Million)
6.3 NA: Night Vision System Market Size, 2011-2019 (Thousand Units)
6.4 NA: Night Vision System Market Size, 2011-2019 ($Million)
6.4.1 U.S. : Night Vision System Market Size, 2011-2019 ($Million & Thousand Units)
6.4.2 Canada: Night Vision System Market Size, 2011-2019 ($Million & Thousand Units)
6.4.3 Mexico: Night Vision System Market Size, 2011-2019 ($Million & Thousand Units)
6.5 Europe: Night Vision System Market Size, 2011-2019 (Thousand Units)
6.6 Europe: Night Vision System Market Size, 2011-2019 ($Million)
6.6.1 Germany: Night Vision System Market Size, 2011-2019 ($Million & Thousand Units)
6.6.2 France: Night Vision System Market Size, 2011-2019 ($Million & Thousand Units)
6.6.3 U.K.: Night Vision System Market Size, 2011-2019 ($Million & Thousand Units)
6.6.4 Spain: Night Vision System Market Size, 2011-2019 ($Million & Thousand Units)
6.6.5 Italy: Night Vision System Market Size, 2011-2019 ($Million & Thousand Units)
6.7 APAC: Night Vision System Market Size, 2011-2019 (Thousand Units)
6.8 APAC: Night Vision System Market Size, 2011-2019 ($Million)
6.8.1 Australia: Night Vision System Market Size, 2011-2019 ($Million & Thousand Units)
6.8.2 Japan: Night Vision System Market Size, 2011-2019 ($Million & Thousand Units)
6.8.3 South Korea: Night Vision System Market Size, 2011-2019 ($Mllion & Thousand Units)
6.8.4 India: Night Vision System Market Size, 2011-2019 ($Million & Thousand Units)
6.8.5 Thailand: Night Vision System Market Size, 2011-2019 ($Million & Thousand Units)
6.8.6 China: Night Vision System Market Size, 2011-2019 ($Million & Thousand Units)
6.9 ROW: Night Vision System Market Size, 2011-2019 (Thousand Units)
6.10 ROW: Night Vision System Market Size, 2011-2019 ($Million)
6.10.1 Brazil: Night Vision System Market Size, 2011-2019 ($Million & Thousand Units)
6.10.2 Russia: Night Vision System Market Size, 2011-2019 ($Million & Thousand Units)
6.10.3 South Africa: Night Vision System Market Size, 2011-2019 ($Million & Thousand Units)
7 Driver Monitoring System Market (2011-2019) (Slide No.- 109)
7.1 Global: Driver Monitoringsystem Market Share, 2013, By Region
7.2 Global: Driver Monitoringsystem Market Size, 2011-2019 ($Million)
7.3 North America : Driver Monitoringsystem Market Size, 2011-2019 (Thousand Units)
7.4 North America : Driver Monitoringsystem Market Size, 2011-2019 ($Million)
7.4.1 U.S.: Driver Monitoring System Market Size, 2011-2019 ($Million & Thousand Units)
7.4.2 Canada: Driver Monitoring System Market Size, 2011-2019 ($Million & Thousand Units)
7.4.3 Mexico: Driver Monitoring System Market Size, 2011-2019 ($Million & Thousand Units)
7.5 Europe: Driver Monitoringsystem Market Size, 2011-2019 (Thousand Units)
7.6 Europe: Driver Monitoring System Market Size, 2011-2019 ($Million)
7.6.1 Germany: Driver Monitoring System Market Size, 2011-2019 ($Million & Thousand Units)
7.6.2 France: Driver Monitoring System Market Size, 2011-2019 ($Million & Thousand Units)
7.6.3 U.K.: Driver Monitoring System Market Size, 2011-2019 ($Million & Thousand Units)
7.6.4 Spain: Driver Monitoring System Market Size, 2011-2019 ($Million & Thousand Units)
7.6.5 Italy: Driver Monitoring System Market Size, 2011-2019 ($Million & Thousand Units)
7.7 APAC: Driver Monitoring System Market Size, 2011-2019 (Thousand Units)
7.8 APAC: Driver Monitoring System Market Size, 2011-2019 ($Million)
7.8.1 Australia: Driver Monitoring System Market Size, 2011-2019 ($Million & Thousand Units)
7.8.2 Japan: Driver Monitoringsystem Market Size, 2011-2019 ($Million & Thousand Units)
7.8.3 South Korea : Driver Monitoring System Market Size, 2011-2019 ($Mllion & Thousand Units)
7.8.4 India: Driver Monitoringsystem Market Size, 2011-2019 ($Million & Thousand Units)
7.8.5 Thailand: Driver Monitoring System Market Size, 2011-2019 ($Million & Thousand Units)
7.8.6 China: Driver Monitoring System Market Size, 2011-2019 ($Million & Thousand Units)
7.9 ROW: Driver Monitoring System Market Size, 2011-2019 (Thousand Units)
7.10 ROW: Driver Monitoring System Market Size, 2011-2019 ($Million)
7.10.1 Brazil: Driver Monitoring System Market Size, 2011-2019 ($Million & Thousand Units)
7.10.2 Russia: Driver Monitoring System Market Size, 2011-2019 ($Million & Thousand Units)
7.10.3 South Africa: Driver Monitoring System Market Size, 2011-2019 ($Million & Thousand Units)
8 Opportunity & Installation Trend Analysis (Slide No.- 138)
8.1 Introduction
8.2 Night Vision & Driver Monitoring Systems: Installation Trend Analysis for NA
8.3 Night Vision & Driver Monitoring Systems: Installation Trend Analysis for Europe
8.4 Night Vision & Driver Monitoring Systems: Installation Trend Analysis for APAC
8.5 Night Vision & Driver Monitoring Systems: Installation Trend Analysis for the ROW
8.5.1 Opportunity Analysis for the U.S.
8.5.2 Opportunity Analysis for Canada
8.5.3 Opportunity Analysis for Mexico
8.5.4 Opportunity Analysis for Germany
8.5.5 Opportunity Analysis for France
8.5.6 Opportunity Analysis for U.K.
8.5.7 Opportunity Analysis for Spain
8.5.8 Opportunity Analysis for Italy
8.5.9 Opportunity Analysis for APAC
8.5.10 Opportunity Analysis for the ROW
8.6 Product Life Cycle Analysis, Night Vision and Driver Monitoring Systems, By Region
8.7 Pestel Analysis: Global
8.7.1 NA: Pestel Analysis
8.7.2 Europe: Pestel Analysis
8.7.3 APAC: Pestel Analysis
8.7.4 ROW: Pestel Analysis
9 Competitive Landscape (Slide No.- 160)
9.1 Introduction
9.1.1 Key Findings
9.2 Key Growth Strategies
10 Company Profiles (Slide No.- 165)
10.1 Introduction
10.1.1 Competitive Benchmarking for the Key Players (2009-2013)
10.2 Autoliv, Inc.
10.3 Robert Bosch GMBH
10.4 Continental AG
10.5 Delphi Automotive PLC
10.6 Denso Corporation
10.7 Omron Corporation
10.8 Valeo S.A.
10.9 Aisin Seiki Co., Ltd.
10.10 Magna International Inc.
10.11 Visteon Corporation
11 Appendix (Slide No.- 282)
List of Tables (72 Tables)
Table 1 Global Market Size of Night Vision System in Terms of Value, 2011-2019
Table 2 North America: Market Size of Night Vision System in Terms of Volume, 2011-2019
Table 3 North America: Market Size in Terms of Value, 2011-2019
Table 4 U.S. : Market Size of Night Vision System in Terms of Value and Volume, 2011-2019
Table 5 Canada: Market Size of Night Vision System in Terms of Value and Volume, 2011-2019
Table 6 Mexico: Market Size of Night Vision System in Terms of Value and Volume, 2011-2019
Table 7 Europe: Market Size of Night Vision System in Terms of Volume, 2011-2019
Table 8 Europe: Market Size in Terms of Value, 2011-2019
Table 9 Germany: Market Size of Night Vision System in Terms of Value and Volume, 2011-2019
Table 10 France: Market Size of Night Vision System in Terms of Value and Volume, 2011-2019
Table 11 U.K. : Market Size of Night Vision System in Terms of Value and Volume, 2011-2019
Table 12 Spain: Market Size of Night Vision System in Terms of Value and Volume, 2011-2019
Table 13 Italy: Market Size of Night Vision System in Terms of Value and Volume, 2011-2019
Table 14 APAC: Market Size of Night Vision System in Terms of Volume, 2011-2019
Table 15 APAC: Market Size in Terms of Value, 2011-2019
Table 16 Australia: Market Size of Night Vision System in Terms of Value and Volume, 2011-2019
Table 17 Japan: Market Size of Night Vision System in Terms of Value and Volume, 2011-2019
Table 18 South Korea: Market Size of Night Vision System in Terms of Value and Volume, 2011-2019
Table 19 India: Market Size of Night Vision System in Terms of Value and Volume, 2011-2019
Table 20 Thailand: Market Size of Night Vision System in Terms of Value and Volume, 2011-2019
Table 21 China: Market Size of Night Vision System in Terms of Value and Volume, 2011-2019
Table 22 Rest of the World: Market Size of Night Vision System in Terms of Volume, 2011-2019
Table 23 Rest of the World: Market Size in Terms of Value, 2011-2019
Table 24 Brazil: Market Size of Night Vision System in Terms of Value and Volume, 2011-2019
Table 25 Russia: Market Size of Night Vision System in Terms of Value and Volume, 2011-2019
Table 26 South Africa: Market Size of Night Vision System in Terms of Value and Volume, 2011-2019
Table 27 Global Market Size of Driver Monitoring System in Terms of Value, 2011-2019
Table 28 North America: Market Size of Driver Monitoring System in Terms of Volume, 2011-2019
Table 29 North America: Market Size of Driver Monitoring System in Terms of Value, 2011-2019
Table 30 U.S. : Market Size of Driver Monitoring System in Terms of Value and Volume, 2011-2019
Table 31 Canada : Market Size of Driver Monitoring System in Terms of Value and Volume, 2011-2019
Table 32 Mexico : Market Size of Driver Monitoring System in Terms of Value and Volume, 2011-2019
Table 33 Europe : Market Size of Driver Monitoring System in Terms of Volume, 2011-2019
Table 34 Europe : Market Size of Driver Monitoring System in Terms of Value, 2011-2019
Table 35 Germany : Market Size of Driver Monitoring System in Terms of Value and Volume, 2011-2019
Table 36 France : Market Size of Driver Monitoring System in Terms of Value and Volume, 2011-2019
Table 37 U.K. : Market Size of Driver Monitoring System in Terms of Value and Volume, 2011-2019
Table 38 Spain : Market Size of Driver Monitoring System in Terms of Value and Volume, 2011-2019
Table 39 Italy: Market Size of Driver Monitoring System in Terms of Value and Volume, 2011-2019
Table 40 APAC : Market Size of Driver Monitoring System in Terms of Volume, 2011-2019
Table 41 APAC : Market Size of Driver Monitoring System in Terms of Value, 2011-2019
Table 42 Australia : Market Size of Driver Monitoring System in Terms of Value and Volume, 2011-2019
Table 43 Japan: Market Size of Driver Monitoring System in Terms of Value and Volume, 2011-2019
Table 44 South Korea: Market Size of Driver Monitoring System in Terms of Value and Volume, 2011-2019
Table 45 India: Market Size of Driver Monitoring System in Terms of Value and Volume, 2011-2019
Table 46 Thailand: Market Size of Driver Monitoring System in Terms of Value and Volume, 2011-2019
Table 47 China: Market Size of Driver Monitoring System in Terms of Value and Volume, 2011-2019
Table 48 Rest of the World: Market Size of Driver Monitoring System in Terms of Volume, 2011-2019
Table 49 Rest of the World: Market Size of Driver Monitoring System in Terms of Value, 2011-2019
Table 50 Brazil: Market Size of Driver Monitoring System in Terms of Value and Volume, 2011-2019
Table 51 Russia: Market Size of Driver Monitoring System in Terms of Value and Volume, 2011-2019
Table 52 South Africa: Market Size of Driver Monitoring System in Terms of Value and Volume, 2011-2019
Table 53 Pestel Analysis for Night Vision System and Driver Monitoring System Market
Table 54 Autoliv, inc.: Total Revenue, By Segment, 2012�2013 ($Million)
Table 55 Autoliv, Inc.: Total Revenue, By Geography, 2012�2013 ($Million)
Table 56 Robert Bosch GMBH: Total Revenue, By Segment, 2011�2012 ($Million)
Table 57 Robert Bosch GMBH: Total Revenue, By Geography, 2011�2012 ($Million)
Table 58 Continental AG: Total Revenue, By Segment, 2012�2013 ($Million)
Table 59 Continental AG: Chassis and Safety Division Total Revenue, By Geography, 2012�2013 ($Million)
Table 60 Delphi Automotive PLC: Total Revenue, By Segment, 2012�2013 ($Million)
Table 61 Delphi Automotive PLC: Total Revenue, By Geography, 2012�2013 ($Million)
Table 62 Denso Corporation: Total Revenue, By Segment, 2012�2013 ($Billion)
Table 63 Denso Corporation: Total Revenue, By Geography, 2012�2013 ($Billion)
Table 64 Omron Corporation: Total Revenue, By Segment, 2011�2012 ($Billion)
Table 65 Omron Corporation: Total Revenue, By Geography, 2011�2012 ($Billion)
Table 66 Valeo S.A.: Total Revenue, By Segment, 2011�2012 ($Million)
Table 67 Valeo S.A. : Total Revenue, By Geography, 2011-2012 ($Million)
Table 68 Aisin Seiki Co., Ltd.: Total Revenue, By Region, 2013�2014 ($Million)
Table 69 Magna International Inc.: Total Revenue, By Segment, 2012�2013 ($Million)
Table 70 Magna International Inc.: Total Revenue, By Region, 2012�2013 ($Million)
Table 71 Visteon Corporation: Total Revenue, By Segment, 2012�2013 ($Million)
Table 72 Visteon Corporation: Total Revenue, By Region, 2012�2013 ($Million)
List of Figures (45 Figures)
Figure 1 Primary Interviews
Figure 2 Global Market Size of Night Vision and Driver Monitoring Systems in Terms of Value
Figure 3 Prominent Countries in the NVS and Driver Monitoring System Markets for Passenger Cars, 2013
Figure 4 Global Market Size of NVS in Terms of Value
Figure 5 Global Market Size of Driver Monitoring System in Terms of Value
Figure 6 Legislation Applicable for Night Vision and Driver Monitoring Systems
Figure 7 Value Chain Analysis for NVS and Driver Monitoring System
Figure 8 Economic Growth in Terms of GDP in Europe
Figure 9 Economic Growth in Terms of GDP in North America
Figure 10 Economic Growth in Terms of GDP in APAC
Figure 11 Economic Growth in Terms of GDP in ROW
Figure 12 Technology Road Map for Night Vision System
Figure 13 Global Market Share of NVS in Terms of Value, 2013
Figure 14 Global Market Share of NVS in Terms of Value, 2013
Figure 15 Global Market Share of Driver Monitoring System in Terms of Value, 2013
Figure 16 Global Market Share of Driver Monitoring in Terms of Value, 2013
Figure 17 U.S. : Opportunity Analysis for NVS and Driver Monitoring System Markets
Figure 18 Canada. : Opportunity Analysis for NVS and Driver Monitoring System Markets
Figure 19 Mexico : Opportunity Analysis for NVS and Driver Monitoring System Markets
Figure 20 Germany : Opportunity Analysis for NVS and Driver Monitoring System Markets
Figure 21 France : Opportunity Analysis for NVS and Driver Monitoring System Markets
Figure 22 U.K. : Opportunity Analysis for NVS and Driver Monitoring System Markets
Figure 23 Spain : Opportunity Analysis for NVS and Driver Monitoring System Markets
Figure 24 Italy : Opportunity Analysis for NVS and Driver Monitoring System Markets
Figure 25 APAC: Opportunity Analysis for NVS and Driver Monitoring System Markets
Figure 26 ROW : Opportunity Analysis for NVS and Driver Monitoring System Markets
Figure 27 Product Life Cycle Analysis for NVS and Driver Monitoring Systems
Figure 28 North America: Pestel Analysis for Night Vision System and Driver Monitoring System Market
Figure 29 Europe: Pestel Analysis for NVS and Driver Monitoring System Market
Figure 30 APAC: Pestel Analysis for NVS and Driver Monitoring System Market
Figure 31 ROW: Pestel Analysis for NVS and Driver Monitoring System Market
Figure 32 Key Growth Strategies Evaluation Frame Work Applied to Night Vision System and Driver Monitoring System Markets
Figure 33 Key Growth Strategies Share, 2011�2014
Figure 34 Percentage Share of Prominent Players in the Overall Developments, 2011�2014
Figure 35 Geographic Revenue Mix for Key Players
Figure 36 SWOT Analysis for Autoliv, inc.
Figure 37 SWOT Analysis for Robert Bosch GMBH
Figure 38 SWOT Analysis for Continental AG
Figure 39 SWOT Analysis for Delphi Automotive PLC
Figure 40 SWOT Analysis for Denso Corporation
Figure 41 SWOT Analysis for Omron Corporation
Figure 42 SWOT Analysis for Valeo S.A
Figure 43 SWOT Analysis for Aisin Seiki Co., Ltd.
Figure 44 SWOT Analysis for Magna international Inc.
Figure 45 SWOT Analysis for Visteon Corporation


Growth opportunities and latent adjacency in Night Vision System (NVS) and Driver Monitoring System (DMS) Market