Network Access Control Market by Product Type (Software and Hardware), Services (Consulting, Installation, and Maintenance and Support), User Type, Deployment Type, Vertical, and Region - Global Forecast to 2020


[124 Pages Report] The Network Access Control (NAC) market is expected to grow from USD 681.3 Million in 2015 to USD 2,645.5 Million by 2020, at a high Compound Annual Growth Rate (CAGR) of 31.17%. The year 2013 has been considered as the historical year and 2014 as the base year for performing the market estimation and forecasting. The growing security concerns due to unwanted devices or unauthorized users that introduce network breaches have paved the way for the adoption of Network Access Control NAC solutions. NAC has become an important part of security value chain as it alleviates the risk and manages the threat thresholds for businesses and their network environment. In the present scenario, NAC is undergoing technological advancements and is also experiencing significant adoption and is expected to experience an exponential growth in the coming years. The network access control market is broadly segmented by product type, service, deployment type, user type, vertical, and region. The global Network Access Control market is segmented across five main geographical regions, such as North America, Europe, Asia-Pacific (APAC), Middle East and Africa (MEA), and Latin America.
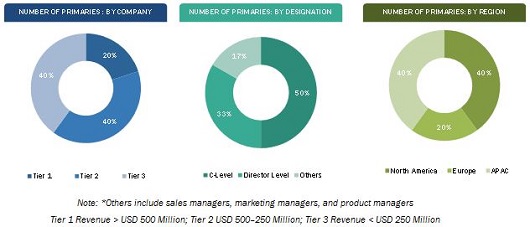
The research methodology used to estimate the network access control market size includes the following details: the key players in the market were identified through secondary research and their market shares in respective regions were determined through primary and secondary research. This entire procedure includes the study of the annual and financial reports of the top market players and extensive interviews for key insights from industry leaders, such as CEOs, VPs, directors, and marketing executives. All percentage shares, splits, and breakdowns were determined by using secondary sources and verified through primary sources. Top-down and bottom-up approaches were used to estimate and validate the size of the global network access control market and to estimate the size of various other dependent submarkets in the overall Network Access Control market. All possible parameters that affect the markets covered in this research study have been accounted for, viewed in extensive detail, verified through primary research, and analyzed to get the final quantitative and qualitative data. This data is consolidated and added with detailed inputs and analysis from MarketsandMarkets and presented in this report.
To know about the assumptions considered for the study, download the pdf brochure
The NAC ecosystem comprises supply side, intermediates, and demand side. The supply side vendors include hardware suppliers and equipment manufacturers, software suppliers, cloud providers, and professional services. The top vendors include Cisco Systems, ForeScout Technologies, Extreme Networks, HPE, Bradford Networks, and Avaya, among others. The intermediate includes system integrators and value-added service providers and distributors. The system integrators are responsible for the integration of NAC resources and cloud resources. The demand side includes the end users of NAC solutions, such as BFSI, government & defense, healthcare, educational institutions, retail, industrial manufacturing, IT & telecom, energy & power, and others.
Target audience
- NAC software vendors
- NAC hardware vendors
- NAC service providers
- Research organizations
- Investors and Venture Capitalists (VC)
- Network and systems integrators
- Independent software vendors
- Value-Added Resellers (VARs) and distributors
- NAC users
Scope of the Report
The Network Access Control market report is broadly segmented into the following product types, services, deployment types, user types, verticals, and regions.
Global NAC Market, by Product Type
- Hardware
- Software
Global NAC Market, by Service
- Consulting
- Installation
- Support and Maintenance
Global NAC Market, by Deployment Type
- On-Premises
- Cloud
Global NAC Market, by User Type
- Small and Medium Enterprises (SMEs)
- Large Enterprises
Global NAC Market, by Vertical
- Banking, Financial Services, and Insurance (BFSI)
- Government and Defense
- Healthcare
- Educational Institutions
- Retail
- Industrial Manufacturing
- IT and Telecom
- Energy and Power
- Others
Global NAC Market, by Region
- North America
- Europe
- APAC
- MEA
- Latin America
Available Customizations:
With the given market data, MarketsandMarkets offers customizations as per the company�s specific needs. The following customization options are available for the report:
Product Analysis
- Product Matrix which gives a detailed comparison of the product portfolio of each company
Geographic Analysis
- Further breakdown of the regions according to the feasibility
Company Information
- Detailed analysis and profiling of additional market players (Up to 5)
The Network Access Control (NAC) market is estimated to grow from USD 681.3 Million in 2015 to USD 2,645.5 Million by 2020, at a high Compound Annual Growth Rate (CAGR) of 31.17% during the forecast period. Network security is gaining a significant importance among the corporates due to the increasing number of untrusted devices accessing their networks. Hence, increasing adoption of NAC in various industries is seen, which is driving the growth of the market.
The report provides detailed insights into the global Network Access Control market, which is segmented by product type, service, deployment type, user type, vertical, and region. The NAC hardware solution by product type holds the highest market share, whereas the software solution is expected to show great opportunities within the next five years. The traditional NAC technology used to grant or deny access to enterprise networks depended on the security profile of an endpoint. Advancement in NAC technology expanded the access control with access policy enforcement as per the business requirements. Due to this and various beneficial outcomes, there has been increasing investment on the NAC technology across the world.
The Network Access Control market by user type includes large enterprises and Small and Medium Enterprises (SMEs). Adoption of the NAC technology is no longer limited to large enterprises, but SMEs are also seen increasingly adopting this technology, which is estimated to present great opportunities in the next five years.
The Network Access Control market is booming, and within the next five years, it will present huge potentials with high adoption rate contributing to the high growth of this market. The report provides detailed insights into the global NAC market. The market has been segmented into many industry verticals, namely BFSI, government & defense, healthcare, educational institutions, retail, industrial manufacturing, IT & telecom, energy & power, and others.
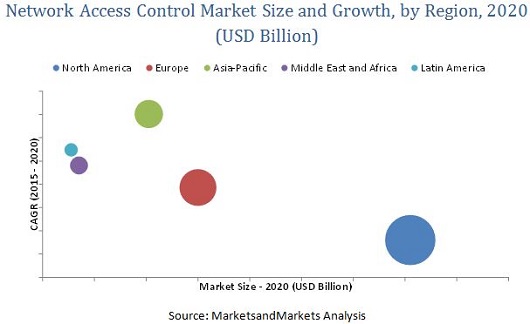
The report covers all the major aspects of the Network Access Control market and provides an in-depth analysis across the regions of North America, Europe, Asia-Pacific (APAC), Middle East and Africa (MEA), and Latin America. North America is expected to hold the largest market share. The APAC region is projected to have great opportunities in this market and to grow at the highest CAGR by 2020, due to the presence of various developing countries such as China, India, Philippines, and others that will be contributing to the growth of the market in the region.
There are huge investments involved with Network Access Control market, so enterprises may be reluctant to adopt this technology. Though the investments involved are huge, the enterprises are slowly getting aware of the benefits of NAC, such as help with robust business operations. Therefore, it is not just expected to strengthen its footprints in large enterprises but also in SMEs and such businesses. Various vendors are coming up with innovative NAC solutions and products due to the emerging cloud-based services, next generation of NAC solutions, emerging security based on complete endpoint visibility, and increasing Bring Your Own Device (BYOD) trend. The major vendors providing NAC solutions and services are Cisco Systems, ForeScout Technologies, Extreme Networks, HPE, Bradford Networks, and Avaya, among others. Moreover, there are many new market players providing innovative NAC solutions, such as SnoopWall. These players adopted various strategies such as new product launches, partnerships, collaborations, acquisitions, and expansions to become competitive in the market.
To speak to our analyst for a discussion on the above findings, click Speak to Analyst
 Exclusive indicates content/data unique to MarketsandMarkets and not available with any competitors.
Table of Contents
1 Introduction (Page No. - 14)
1.1 Objectives of the Study
1.2 Market Definition
1.3 Market Scope
1.3.1 Market Covered
1.3.2 Years Considered in the Report
1.4 Currency
1.5 Limitations
1.6 Stakeholders
2 Research Methodology (Page No. - 17)
2.1 Research Data
2.1.1 Secondary Data
2.1.1.1 Key Data From Secondary Sources
2.1.2 Primary Data
2.1.2.1 Key Data From Primary Sources
2.1.2.2 Key Industry Insights
2.1.2.3 Breakdown of Primaries
2.2 Market Size Estimation
2.2.1 Bottom-Up Approach
2.2.2 Top-Down Approach
2.3 Market Breakdown and Data Triangulation
2.4 Research Assumptions
3 Executive Summary (Page No. - 25)
4 Premium Insights (Page No. - 28)
4.1 Attractive Market Opportunities
4.2 Market By Product Type
4.3 Network Access Control: Total Market Share of Nac and Top Three Regions
4.4 Market Size, By Region
4.5 Lifecycle Analysis, By Region
5 Market Overview (Page No. - 31)
5.1 Introduction
5.2 Market Segmentation
5.2.1 By Product Type
5.2.2 By Service
5.2.3 By User Type
5.2.4 By Deployment Type
5.2.5 By Vertical
5.2.6 By Region
5.3 Evolution
5.4 Market Dynamics
5.4.1 Drivers
5.4.1.1 Increasing Prevalence of Bring Your Own Device (BYOD)
5.4.1.2 Compatibility With Existing Network Security Technologies
5.4.1.3 Need for Automation and Security for Business Processes
5.4.2 Restraints
5.4.2.1 High Initial Investment Costs
5.4.3 Opportunities
5.4.3.1 Increasing Privacy and Security Concerns
5.4.3.2 Significant Shift of Organizations From Primary to Next-Generation Nac Technologies
5.4.4 Challenges
5.4.4.1 Lack of Awareness Regarding the Benefits of Nac Solutions
6 Network Access Control Market: Industry Trends (Page No. - 38)
6.1 Introduction
6.2 Value Chain Analysis
6.3 Strategic Overview
6.3.1 Innovation and Product Enhancements
6.3.2 Collaborations, Partnerships, and Acquisitions
6.4 Standards and Regulations
6.4.1 Ieee Standard Association
6.4.2 Trusted Network Connect (TNC)
6.4.3 Payment Card Industry Security Standards Council
6.4.4 Health Insurance Portability and Accountability Act
6.4.5 Internet Engineering Task Force (IETF)
7 Network Access Control Market Analysis, By Product Type (Page No. - 42)
7.1 Introduction
7.2 Hardware
7.3 Software
8 Network Access Control Market Analysis, By Service (Page No. - 46)
8.1 Introduction
8.2 Consulting
8.3 Installation
8.4 Support and Maintenance Services
9 Market Analysis, By Deployment Type (Page No. - 50)
9.1 Introduction
9.2 On-Premises
9.3 Cloud
10 Market Analysis, By User Type (Page No. - 53)
10.1 Introduction
10.2 SMES
10.3 Large Enterprises
11 Network Access Control Market Analysis, By Vertical (Page No. - 56)
11.1 Introduction
11.2 BFSI
11.3 Government and Defense
11.4 Healthcare
11.5 Educational Institutions
11.6 Retail
11.7 Industrial Manufacturing
11.8 IT and Telecom
11.9 Energy and Power
11.10 Others
12 Geographic Analysis (Page No. - 64)
12.1 Introduction
12.2 North America
12.2.1 North America By Country
12.3 Europe
12.4 Asia-Pacific
12.5 Middle East and Africa
12.6 Latin America
13 Competitive Landscape (Page No. - 83)
13.1 Overview
13.2 Competitive Situation and Trends
13.3 New Product Launches
13.4 Partnerships and Collaborations
13.5 Acquisitions
14 Company Profiles (Page No. - 89)
(Business Overview, Products & Services, Key Insights, Recent Developments, SWOT Analysis, MnM View)*
14.1 Introduction
14.2 Cisco Systems, Inc.
14.3 Hewlett Packard Enterprise Development LP
14.4 Extreme Networks, Inc.
14.5 Avaya, Inc.
14.6 Forescout Technologies, Inc.
14.7 Bradford Networks
14.8 Pulse Secure, LLC.
14.9 Portnox
14.10 Impulse Point
14.11 Auconet, Inc.
14.12 Key Innovator
*Details on Business Overview, Products & Services, Key Insights, Recent Developments, SWOT Analysis, MnM View Might Not Be Captured in Case of Unlisted Companies.
15 Appendix (Page No. - 116)
15.1 Insight of Industry Experts
15.2 Discussion Guide
15.3 Introducing RT: Real-Time Market Intelligence
15.4 Available Customizations
15.5 Related Reports
List of Tables (65 Tables)
Table 1 Global Data Center Asset Management Market: Assumptions
Table 2 Market Size and Growth Rate, 2013�2020 (USD Million, Y O Y %)
Table 3 Market Size, By Product Type, 2013�2020 (USD Million)
Table 4 Hardware: Market Size, By Region, 2013�2020 (USD Million)
Table 5 Software: Market Size, By Region, 2013�2020 (USD Million)
Table 6 Network Access Control Market Size, By Service, 2013�2020 (USD Million)
Table 7 Consulting Service: Market Size, By Region, 2013�2020 (USD Million)
Table 8 Installation Service: Market Size, By Region, 2013�2020 (USD Million)
Table 9 Support and Maintenance Service: Market Size, By Region, 2013�2020 (USD Million)
Table 10 Network Access Control Market Size, By Deployment Type, 2013�2020 (USD Million)
Table 11 On-Premises: Market Size, By Region, 2013�2020 (USD Million)
Table 12 Cloud: Market Size, By Region, 2013�2020 (USD Million)
Table 13 Market Size, By User Type, 2013�2020 (USD Million)
Table 14 SMES: Market Size, By Region, 2013�2020 (USD Million)
Table 15 Large Enterprises: Market Size, By Region, 2013�2020 (USD Million)
Table 16 Market Size, By Vertical, 2013�2020 (USD Million)
Table 17 BFSI: Market By Region, 2013-2020 (USD Million)
Table 18 Government and Defense: Market Size By Region, 2013-2020 (USD Million)
Table 19 Healthcare: Market Size, By Region, 2013-2020 (USD Million)
Table 20 Educational Institutions: Market Size, By Region, 2013-2020 ((USD Million))
Table 21 Retail: Network Access Control Market Size, By Region, 2013�2020 (USD Million)
Table 22 Industrial Manufacturing: Market Size, By Region, 2013�2020 (USD Million)
Table 23 IT and Telecom: Market Size, By Region, 2013�2020 (USD Million)
Table 24 Energy and Power: Market Size, By Region, 2013�2020 (Million )
Table 25 Others: Market Size, By Region, 2013�2020 (Million )
Table 26 Network Access Control Market Size, By Region, 2013�2020 (USD Million)
Table 27 North America: Market Size, 2013�2020 (USD Million)
Table 28 North America: Market Size, By Product Type, 2013�2020 (USD Million)
Table 29 North America: Market Size, By Service, 2013�2020 (USD Million)
Table 30 North America: Market Size, By Deployment Type, 2013�2020 (USD Million)
Table 31 North America: Market Size, By User Type, 2013�2020 (USD Million)
Table 32 North America: Market Size, By Vertical, 2013�2020 (USD Million)
Table 33 United States and Rest of North America: Market Size By Region, 2013�2020 (USD Million)
Table 34 United States: Market Size, 2013�2020 (USD Million)
Table 35 United States: Market Size, By Product Type, 2013�2020 (USD Million)
Table 36 United States: Market Size, By Service,2013�2020 (USD Million)
Table 37 United States: Market Size, By Deployment Type, 2013�2020 (USD Million)
Table 38 United States: Market Size, By User Type, 2013�2020 (USD Million)
Table 39 Europe: Network Access Control Market Size, 2013�2020 (USD Million)
Table 40 Europe: Market Size, By Product Type, 2013�2020 (USD Million)
Table 41 Europe: Market Size, By Service, 2013�2020 (USD Million)
Table 42 Europe: Market Size, By Deployment Type, 2013�2020 (USD Million)
Table 43 Europe: Market Size, By User, 2013�2020 (USD Million)
Table 44 Europe: Market Size, By Vertical, 2013�2020 (USD Million)
Table 45 Asia-Pacific: Market Size, 2013�2020 (USD Million)
Table 46 Asia-Pacific: Market Size, By Product Type, 2013�2020 (USD Million)
Table 47 Asia-Pacific: Market Size, By Service, 2013�2020 (USD Million)
Table 48 Asia-Pacific: Market Size, By Deployment Type, 2013�2020 (USD Million)
Table 49 Asia-Pacific: Market Size, By User, 2013�2020 (USD Million)
Table 50 Asia-Pacific: Market Size, By Vertical, 2013�2020 (USD Million)
Table 51 Middle East and Africa: Market Size, 2013�2020 (USD Million)
Table 52 Middle East and Africa: Market Size, By Product Type, 2013�2020 (USD Million)
Table 53 Middle East and Africa: Market Size, By Service, 2013�2020 (USD Million)
Table 54 Middle East and Africa: Market Size, By Deployment Type, 2013�2020 (USD Million)
Table 55 Middle East and Africa: Market Size, By User , 2013�2020 (USD Million)
Table 56 Middle East and Africa: Market Size, By Vertical, 2013�2020 (USD Million)
Table 57 Latin America: Market Size, 2013�2020 (USD Million)
Table 58 Latin America: Market Size, By Product Type, 2013�2020 (USD Million)
Table 59 Latin America: Market Size, By Service, 2013�2020 (USD Million)
Table 60 Latin America: Market Size, By Deployment Type, 2013�2020 (USD Million)
Table 61 Latin America: Market Size, By User, 2013�2020 (USD Million)
Table 62 Latin America: Network Access Control Market Size, By Vertical, 2013�2020 (USD Million)
Table 63 New Product Launches, 2013�2016
Table 64 Partnerships and Collaborations, 2013�2015
Table 65 Acquisitions, 2013�2015
List of Figures (35 Figures)
Figure 1 Network Access Control: Research Design
Figure 2 Breakdown of Primary Interviews: By Company, Designation, and Region
Figure 3 Market Size Estimation Methodology: Bottom-Up Approach
Figure 4 Market Size Estimation Methodology: Top-Down Approach
Figure 5 Network Access Control: Data Triangulation
Figure 6 Network Access Control: Products Segment is Expected to Hold the Largest Market Size Throughout the Forecast Period
Figure 7 Top Segments in Terms of Market Share in the Market
Figure 8 North America is Expected to Hold the Largest Market Share in 2015
Figure 9 Growth Trend of the Network Access Control Market
Figure 10 Sofware Segment is Projected to Grow at the Highest CAGR in the Market During the Forecast Period
Figure 11 Hardware Component and North America Region is Expected to Have the Largest Market Share in 2015
Figure 12 Asia-Pacific is Expected to Register the Highest Growth in the Market
Figure 13 Geographic Lifecycle Analysis (2015): Asia-Pacific is Expected to Have High Growth in the Coming Years
Figure 14 Evolution of Network Access Control
Figure 15 Network Access Control: Drivers, Restraints, Opportunities, and Challenges
Figure 16 Network Access Control Market: Value Chain Analysis
Figure 17 Strategic Benchmarking: Innovations and Product Enhancements
Figure 18 Strategic Benchmarking: Collaborations, Partnerships, and Acquisitions
Figure 19 Geographic Snapshot (2015�2020): Asia-Pacific is Expected to Grow at the Highest CAGR
Figure 20 North America Market: Snapshot
Figure 21 North America Market By Country: Snapshot
Figure 22 Asia-Pacific Market: Snapshot
Figure 23 Companies Adopted New Product Launch as the Key Growth Strategy From 2013 to 2015
Figure 24 Partnership and Collaboration is the Key Strategy Used By the Major Market Players From 2013 to 2015
Figure 25 Battle for Market Share: Partnership and Collaboration is the Key Strategy
Figure 26 Geographic Revenue Mix of Top Market Players
Figure 27 Cisco Systems, Inc.: Company Snapshot
Figure 28 Cisco Systems, Inc.: SWOT Analysis
Figure 29 Hewlett Packard Enterprise Development LP: Company Snapshot
Figure 30 Hewlett Packard Enterprise Development LP: SWOT Analysis
Figure 31 Extreme Networks, Inc.: Company Snapshot
Figure 32 Extreme Networks, Inc.: SWOT Analysis
Figure 33 Avaya, Inc.: Company Snapshot
Figure 34 Avaya, Inc.: SWOT Analysis
Figure 35 Forescout Technologies, Inc.: SWOT Analysis


Growth opportunities and latent adjacency in Network Access Control Market