Monoethylene Glycol (MEG) Market by Application (Fiber, PET, Antifreeze & Coolant, Film), Technology, and Geography (Asia Pacific, North America, Europe, Middle East & Africa, and South America) - Global Forecast to 2022


[123 Pages Report] MEG is a colorless, odorless, involatile, hygroscopic, and sweet liquid. The oxidation of ethylene produces EO, which is further hydrolyzed to produce MEG. MEG is the most widely used type of ethylene glycol (EG). It is widely used in the production of PET, polyester, and antifreeze & coolant application that mainly cater to end-use industries including, packaging, textiles, and automotive.
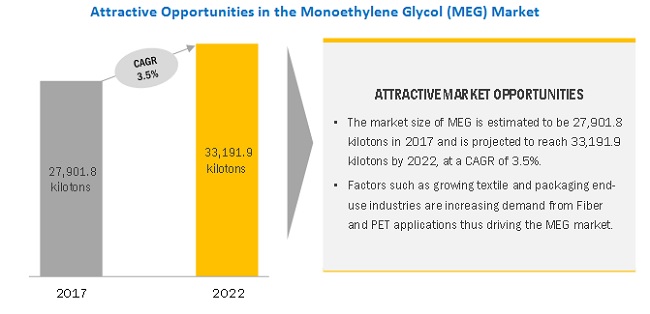
The MEG market is witnessing a moderate growth owing to the support from textiles and plastics industries, which is propelling the demand for PET and polyester. The growing plastic industry has propelled the demand for PET applications, in turn, propelling the demand for MEG. Innovations and developments in bio-based PET have further provided opportunities for the development of bio-based MEG. North America, Europe, and APAC are expected to witness high demand for MEG in the production of PETs, in the near future. Major automotive markets, such as the US, Japan, and Germany, are expected to witness high growth in antifreeze & coolant application of MEG.
The market size of MEG is estimated to be 27,901 kilotons in 2017 and is projected to reach 33,191 kilotons by 2022, at a CAGR of 3.5%
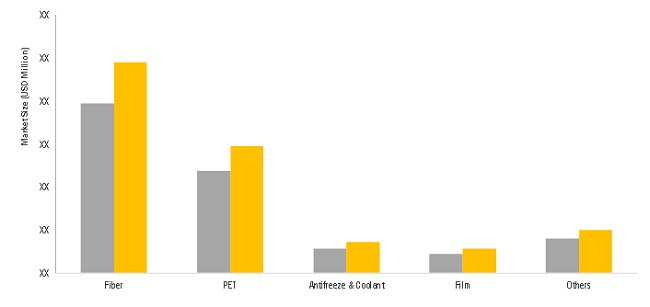
Fiber application to dominate MEG market between 2017 and 2022
Fiber is the largest application of MEG owing to the use of MEG in the production of PET and polyester fibers. Polyester fiber accounts for approximately half of total fibers consumption, globally. It is widely used in the textile and apparel market, garment manufacturing, home furnishings, carpets and rugs, fiberfill, and non-woven fabrics. The emerging markets such as APAC and South America are expected to be the major drivers of the MEG market owing to the high growth applications in this region. The growing automotive and building & construction industries are contributing to the growth of the polyester staple fiber market. China is a major consumer and producer of polyester and accounts for more than 65% of the global polyester consumption. India is also a major polyester market player. Huge potential in the polyester application in the textile industry is leading to growth in the MEG market.
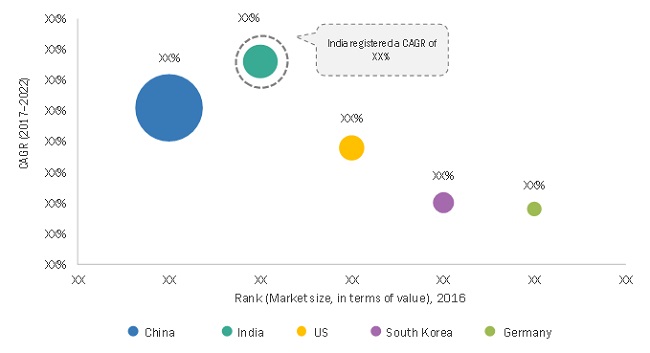
China to be the largest market of MEG between 2017 and 2022 in terms of value
China is the largest MEG market owing to the high demand for MEG in polyester and PET applications in textile and packaging end-use industries. Moreover, the demand in the textile end-use industry (geo-textiles, non-woven medical textiles, home textiles, and technical textiles) is a major driver of the MEG market. China is expected to make huge investments in MEG production to meet its high demand in the near future. It mainly produces its MEG by coal-based technology, which is cheaper than the conventional naphtha-based production technology. This is also expected to affect the export of MEG to China from the Middle East & Africa and the US. In addition to the fiber application, China is also expected to witness capacity additions for PET resin.
APAC is expected to have higher demand in the MEG market over other regions
APAC is expected to have higher demand in the MEG market over other regions due to the influencing factors such as energy, labor costs, freight, and raw material costs. A major manufacturer of textiles, clothing, and apparel, APAC is expected to propel the growth of the MEG market during the forecast period.
Market Dynamics
Driver: Growing demand for MEG in antifreeze & coolant application
Improved socioeconomic conditions, emerging economies, improved infrastructure, increasing vehicle fleet, among other factors have propelled the demand for automobiles, which is, in turn, driving the MEG market. The demand for antifreeze & coolants is also growing in the HVAC systems and heat exchangers to facilitate the heat transfer process in the adverse cold weather conditions. Antifreeze & coolants can also be used in industrial and electronic applications. The main industrial uses of antifreeze & coolants include winterization of potable water systems, sanitation systems, non-running engines, and air conditioners. Thus, the growing application prospects in the automotive and electronic industries are further expected to drive the demand for MEG.
Restraint: Toxicity of MEG
MEG is toxic on inhalation, contact, and ingestion. On inhalation of MEG, the high concentration of aerosol may cause respiratory irritation. In case of its contact with the eyes, one may suffer from mild eye irritation accompanied by tears, pain, or even blurred vision. Contact with skin may also cause mild skin irritation. On the ingestion of MEG, one may suffer from inebriation, nausea and vomiting, metabolic acidosis, and CNS depression. It can further cause cardiopulmonary effects such as tachycardia, hypertension, severe metabolic acidosis, hypoxia, congestive heart failure, and adult respiratory distress syndrome, as well as renal failure. It can also result in an irritation effect on the digestive system, which can further cause pain and bleeding. Prolonged and frequent exposure to MEG damages the kidneys. It can affect the central nervous system, cause other symptoms such as depression, headache, dizziness, nausea, euphoria, loss of equilibrium, drowsiness, visual disturbances, fatigue, unconsciousness, and respiratory arrest. These health hazards restrain the growth of the MEG market.
Opportunity: Increasing coal plants in China
China has the largest demand for MEG and imports MEG despite being a major producer of MEG. It has recently invested in coal-based production plants. The coal-based process, which is one of the technologies used in the MEG production, is expected to provide growth opportunities in the country.
Owing to the increase in production in China, the ethane-based exports of MEG from the Middle East are likely to get affected. Moreover, the increase in the large-scale production plants in China is expected to affect the price of MEG. The operating rates for these plants are expected to remain unstable and low as the MEG produced by this technology is not used in the polyester markets as compared to that produced by the other technologies. But, in the longer run, the low-cost production of MEG will affect polyester manufacturing, making the polyester market more competitive. However, if the production process is combined with biomass platforms, it will prove to be an opportunity for the MEG market. This will increase the investment opportunities in the Middle-East & Africa. Thus, coal-based production technology would reduce the prices of MEG in China.
Challenge: Fluctuating raw material prices
A major challenge in the global MEG market is the continuous fluctuation of the raw material prices. The prices of ethylene are indirectly affected by crude oil prices. Continued volatility in raw material prices is a challenge for the growth of the global MEG market, as it reduces demand and defers end-user spending. However, the producers continue to cope with high and volatile raw material costs and are expected to pass on the price rise to the end-users. The cost pressures coupled with the high raw material costs are expected to reduce product margins for the market players. This scenario has compelled market players to enhance the efficiency and productivity of their operations to sustain the growth in the market.
Scope of the Report
|
Report Metric |
Details |
|
Market size available for years |
2015�2022 |
|
Base year considered |
2016 |
|
Forecast period |
2017�2022 |
|
Forecast units |
USD million and kiloton |
|
Segments covered |
Application, Technology, and Region |
|
Geographies covered |
North America, Europe, Asia-Pacific, Middle East & Africa, and South America |
|
Companies covered |
SABIC (Saudi Arabia), Formosa (Taiwan), Dow (US), BASF (Germany), MEGlobal (UAE), Sinopec (China), Shell (Netherlands), Reliance (India), and SIBUR (Russia) |
The MEG market has been segmented as follows:
MEG Market, by Application:
- Fiber
- PET
- Film
- Antifreeze & Coolant
- Others
MEG Market, by Technology:
- Naphtha-based
- Coal-and natural gas-based
- Bio-based
- Technology Providers
MEG Market, by Region:
- APAC
- Europe
- North America
- Middle East & Africa
- South America
The market has further been analyzed for the key countries in each of these regions.
Key Market Players
SABIC (Saudi Arabia), Formosa (Taiwan), Dow (US), MEGlobal (UAE), Shell (Netherlands)
Recent Developments
- In October 2017, SIBUR, the Russian Direct Investment Fund (RDIF), and Saudi Aramco entered into a partnership. They signed a memorandum of understanding for ensuring cooperation in the field of petrochemicals and marketing of petrochemical products. The partnership is expected to benefit SIBUR as Saudi Aramco is a producer of MEG.
- In May 2017, ExxonMobil and SABIC entered into an agreement to establish a venture project on the proposed jointly owned petrochemical complex in Texas, US, at USD 10 Billion. The project would include an ethane steam cracker with an annual production capacity of 1.8 million tons of ethylene, a MEG unit, and two polyethylene units. The produced ethylene will be fed to a MEG unit and polyethylene units. This is in addition to existing JV for Kemya in Jubail and Yanpet in Yanbu.
- In February 2017, Formosa and Formosa Chemicals & Fibre is jointly investing USD 9.4 billion at Louisiana, in the US, for the production of ethylene and propylene. In the initial phase of the project, a production of 800,000 tons of EG and 600,000 tons of polypropylene are planned. In the second stage, the facility would produce an additional 1.2 MMT of ethylene and 800,000 tons of EG, annually. The increased production of EG is expected to help the company cater to the growing demand for EG.
- In October 2016, EQUATE, the parent company of MEGlobal, invested in a facility of MEG in Texas, US, that is expected to produce 750,000 metric tons, annually. After the commencement in 2019, this would expand the global presence of the company. The development is likely to enable the company to establish a strong foothold in the market. This investment is worth USD 1 billion.
- In March 2016, China National Offshore Oil Corporation (CNOOC) and Shell Nanhai B.V. planned to expand CNOOC and Shell Petrochemical Company�s (CSPC) joint venture in Guangdong Province of China. Shell is expected to produce 480,000 TPA of EG after the expansion. This is expected to enable the company to meet the growing demand for MEG in China.
Critical questions the report answers:
- What are the upcoming trends in the market?
- Which segment provides the most opportunity for growth?
- Who are the leading vendors operating in this market?
- What are the opportunities for new market entrants in this market?
To speak to our analyst for a discussion on the above findings, click Speak to Analyst
 Exclusive indicates content/data unique to MarketsandMarkets and not available with any competitors.
Table of Contents
1 Introduction (Page No. - 13)
1.1 Objectives of the Study
1.2 Market Definition
1.3 Market Scope
1.3.1 Years Considered for the Study
1.4 Currency
1.5 Unit Considered
1.6 Stakeholders
2 Research Methodology (Page No. - 16)
2.1 Research Data
2.1.1 Secondary Data
2.1.1.1 Key Data From Secondary Sources
2.1.2 Primary Data
2.1.2.1 Key Data From Primary Sources
2.1.2.2 Key Industry Insights
2.1.2.3 Breakdown of Primary Interviews
2.2 Market Size Estimation
2.2.1 Bottom-Up Approach
2.2.2 Top-Down Approach
2.3 Data Triangulation
2.4 Research Assumptions
2.5 Limitations
3 Executive Summary (Page No. - 24)
4 Premium Insights (Page No. - 28)
4.1 Significant Opportunities in the MEG Market
4.2 APAC MEG Market, By Application and Country
4.3 MEG Market, By Application
4.4 MEG Market, By Region
5 Market Overview (Page No. - 30)
5.1 Introduction
5.1.1 MEG Production and Capacity, By Key Country, 2016 (Kiloton)
5.1.2 Major Importers and Exporters in MEG Market
5.2 Market Dynamics
5.2.1 Drivers
5.2.1.1 Growing Demand for MEG in Antifreeze & Coolant Application
5.2.1.2 Increasing Demand for Polyester Fiber and PET
5.2.2 Restraints
5.2.2.1 Toxicity of MEG
5.2.3 Opportunities
5.2.3.1 High Potential for the Development of Bio-Based MEG
5.2.3.2 Increasing Coal Plants in China
5.2.4 Challenges
5.2.4.1 Fluctuating Raw Material Prices
5.2.4.2 Costs Associated With the Refining of MEG
5.3 Porter�s Five Forces Analysis
5.3.1 Threat of New Entrants
5.3.2 Threat of Substitutes
5.3.3 Bargaining Power of Buyers
5.3.4 Bargaining Power of Suppliers
5.3.5 Intensity of ComPETitive Rivalry
5.4 Macro Economic Indicators
5.4.1 GDP Growth Rate Forecast of Major Economies
5.4.2 Automotive Industry
5.4.3 Textile Industry
6 MEG Market, By Technology (Page No. - 41)
6.1 Introduction
6.2 Naphtha-Based
6.3 Coal-And Natural Gas-Based
6.3.1 Oxalate /Ube Technology
6.3.2 Eastman-Jm Davy�s MEG Technology
6.3.3 Mto
6.4 Bio-Based MEG Production
6.4.1 Bio-Ethanol Production
6.4.1.1 Sucrose
6.4.1.2 Starchy Biomass
6.4.1.3 Lignocellulose
6.4.2 Bio-Ethylene Production
6.5 Technology Providers
6.5.1 Dow
6.5.2 Shell Chemical
7 MEG Market, By Application (Page No. - 46)
7.1 Introduction
7.2 Fiber
7.3 Film
7.4 PET
7.4.1 Bottle
7.4.2 Food Packaging
7.4.3 Other Packaging Applications
7.5 Antifreeze & Coolant
7.6 Others
7.6.1 Industrial Applications
7.6.1.1 Chemical Intermediate
7.6.1.2 Humectant
7.6.1.3 Natural Gas Transportation
8 MEG Market, By Region (Page No. - 51)
8.1 Introduction
8.2 APAC
8.2.1 China
8.2.2 India
8.2.3 Japan
8.2.4 South Korea
8.2.5 Rest of APAC
8.3 North America
8.3.1 US
8.3.2 Canada
8.3.3 Mexico
8.4 Europe
8.4.1 Germany
8.4.2 France
8.4.3 UK
8.4.4 Italy
8.4.5 Rest of Europe
8.5 Middle East & Africa
8.5.1 Saudi Arabia
8.5.2 South Africa
8.5.3 Rest of the Middle East & Africa
8.6 South America
8.6.1 Brazil
8.6.2 Argentina
8.6.3 Rest of South America
9 Competitive Landscape (Page No. - 85)
9.1 Overview
9.2 Market Share Analysis
9.3 Competitive Situations and Trends
9.3.1 Mergers & Acquisitions
9.3.2 Agreements & Partnerships
9.3.3 Investments & Expansions
10 Company Profiles (Page No. - 90)
(Business Overview, Products Offered, Recent Developments, SWOT Analysis, and MnM View)* (Page No. - )
10.1 SABIC
10.2 MEGlobal
10.3 Shell
10.4 Formosa Plastics
10.5 Dowdupont
10.6 Reliance Industries
10.7 Sinopec
10.8 BASF
10.9 PTT Global Chemical
10.10 SIBUR
10.11 Other Key Players
10.11.1 Lotte Chemical
10.11.2 Eastman
10.11.3 Exxonmobil
10.11.4 Huntsman
10.11.5 Ineos Oxide
10.11.6 Indian Oil
10.11.7 India Glycols
10.11.8 Indorama
10.11.9 Akzo Nobel
10.11.10 Clariant
10.11.11 LG Chem
10.11.12 Mitsui Chemicals
10.11.13 Mitsubishi Chemical Corporation
10.11.14 Kuwait Petroleum Corporation
*Details on Business Overview, Products Offered, Recent Developments, SWOT Analysis, and MnM View Might Not Be Captured in Case of Unlisted Companies. (Page No. - )
11 Appendix (Page No. - 116)
11.1 Insights From Industry Experts
11.2 Discussion Guide
11.3 Knowledge Store: Marketsandmarkets� Subscription Portal
11.4 Introducing RT: Real-Time Market Intelligence
11.5 Available Customizations
11.6 Related Reports
11.7 Author Details
List of Tables (71 Tables)
Table 1 Forecast of Real GDP Growth Rates From 2016 to 2022
Table 2 Country Wise Data for Vehicles in Use, 2015
Table 3 Production Capacities, By Technology, 2013
Table 4 Comparative Analysis of Production Technology
Table 5 MEG Market Size, By Application, 2015�2022 (Kiloton)
Table 6 Monoethylene Glycol Market Size, By Application, 2015�2022 (USD Million)
Table 7 MEG Market Size, By Region, 2015�2022 (Kiloton)
Table 8 Monoethylene Glycol Size, By Region, 2015�2022 (USD Million)
Table 9 APAC: MEG Market Size, By Country, 2015�2022 (Kiloton)
Table 10 APAC: MEG Market Size, By Country, 2015�2022 (USD Million)
Table 11 APAC: Monoethylene Glycol Market Size, By Application, 2015�2022 (Kiloton)
Table 12 APAC: Monoethylene Glycol Market Size, By Application, 2015�2022 (USD Million)
Table 13 Polyester Production in China, 2014-2018 (Kiloton)
Table 14 China: MEG Market Size, By Application, 2015�2022 (Kiloton)
Table 15 China: Monoethylene Glycol Market Size, By Application, 2015�2022 (USD Million)
Table 16 Production Capacities of MEG in India, 2011-2016
Table 17 India: MEG Market Size, By Application, 2015�2022 (Kiloton)
Table 18 India: Monoethylene Glycol Market Size, By Application, 2015�2022 (USD Million)
Table 19 Japan: MEG Market Size, By Application, 2015�2022 (Kiloton)
Table 20 Japan: Monoethylene Glycol Market Size, By Application, 2015�2022 (USD Million)
Table 21 South Korea: MEG Market Size, By Application, 2015�2022 (Kiloton)
Table 22 South Korea: Monoethylene Glycol Market Size, By Application, 2015�2022 (USD Million)
Table 23 Rest of APAC: MEG Market Size, By Application, 2015�2022 (Kiloton)
Table 24 Rest of APAC: Monoethylene Glycol Market Size, By Application, 2015�2022 (USD Million)
Table 25 North America: MEG Market Size, By Country, 2015�2022 (Kiloton)
Table 26 North America: Monoethylene Glycol Market Size, By Country, 2015�2022 (USD Million)
Table 27 North America: MEG Market Size, By Application, 2015�2022 (Kiloton)
Table 28 North America: Monoethylene Glycol Market Size, By Application, 2015�2022 (USD Million)
Table 29 US: MEG Market Size, By Application, 2015�2022 (Kiloton)
Table 30 US: Monoethylene Glycol Market Size, By Application, 2015�2022 (USD Million)
Table 31 Canada: MEG Market Size, By Application, 2015�2022 (Kiloton)
Table 32 Canada: Monoethylene Glycol Market Size, By Application, 2015�2022 (USD Million)
Table 33 Mexico: MEG Market Size, By Application, 2015�2022 (Kiloton)
Table 34 Mexico: Monoethylene Glycol Market Size, By Application, 2015�2022 (USD Million)
Table 35 Europe: MEG Market Size, By Country, 2015�2022 (Kiloton)
Table 36 Europe: Monoethylene Glycol Market Size, By Country, 2015�2022 (USD Million)
Table 37 Europe: MEG Market Size, By Application, 2015�2022 (Kiloton)
Table 38 Europe: Monoethylene Glycol Market Size, By Application, 2015�2022 (USD Million)
Table 39 Germany: MEG Market Size, By Application, 2015�2022 (Kiloton)
Table 40 Germany: Monoethylene Glycol Market Size, By Application, 2015�2022 (USD Million)
Table 41 France: MEG Market Size, By Application, 2015�2022 (Kiloton)
Table 42 France: Monoethylene Glycol Market Size, By Application, 2015�2022 (USD Million)
Table 43 UK: MEG Market Size, By Application, 2015�2022 (Kiloton)
Table 44 UK: Monoethylene Glycol Market Size, By Application, 2015�2022 (USD Million)
Table 45 Italy: MEG Market Size, By Application, 2015�2022 (Kiloton)
Table 46 Italy: Monoethylene Glycol Market Size, By Application, 2015�2022 (USD Million)
Table 47 Rest of Europe: MEG Market Size, By Application, 2015�2022 (Kiloton)
Table 48 Rest of Europe: Monoethylene Glycol Market Size, By Application, 2015�2022 (USD Million)
Table 49 Middle East & Africa: MEG Market Size, By Country, 2015�2022 (Kiloton)
Table 50 Middle East & Africa: Monoethylene Glycol Market Size, By Country, 2015�2022 (USD Million)
Table 51 Middle East & Africa: MEG Market Size, By Application, 2015�2022 (Kiloton)
Table 52 Middle East & Africa: Monoethylene Glycol Market Size, By Application, 2015�2022 (USD Million)
Table 53 Saudi Arabia: MEG Market Size, By Application, 2015�2022 (Kiloton)
Table 54 Saudi Arabia: Monoethylene Glycol Market Size, By Application, 2015�2022 (USD Million)
Table 55 South Africa: MEG Market Size, By Application, 2015�2022 (Kiloton)
Table 56 South Africa.: Monoethylene Glycol Market Size, By Application, 2015�2022 (USD Million)
Table 57 Rest of the Middle East & Africa: MEG Market Size, By Application, 2015�2022 (Kiloton)
Table 58 Rest of the Middle East & Africa: Monoethylene Glycol Market Size, By Application, 2015�2022 (USD Million)
Table 59 South America: MEG Market Size, By Country, 2015�2022 (Kiloton)
Table 60 South America: Monoethylene Glycol Market Size, By Country, 2015�2022 (USD Million)
Table 61 South America: Monoethylene Glycol Market Size, By Application, 2015�2022 (Kiloton)
Table 62 South America: Monoethylene Glycol Market Size, By Application, 2015�2022 (USD Million)
Table 63 Brazil: MEG Market Size, By Application, 2015�2022 (Kiloton)
Table 64 Brazil: Monoethylene Glycol Market Size, By Application, 2015�2022 (USD Million)
Table 65 Argentina: MEG Market Size, By Application, 2015�2022 (Kiloton)
Table 66 Argentina: MEG Market Size, By Application, 2015�2022 (USD Million)
Table 67 Rest of South America: MEG Market Size, By Application, 2015�2022 (Kiloton)
Table 68 Rest of South America: MEG Market Size, By Application, 2015�2022 (USD Million)
Table 69 Mergers & Acquisitions, 2012�2017
Table 70 Agreements & Partnerships, 2012�2017
Table 71 Investments & Expansions, 2012�2017
List of Figures (40 Figures)
Figure 1 MEG Market Segmentation
Figure 2 MEG Market: Research Design
Figure 3 Market Size Estimation: Bottom-Up Approach
Figure 4 Market Size Estimation: Top-Down Approach
Figure 5 MEG Market: Data Triangulation
Figure 6 MEG Market Size, By Volume (Kiloton) & Value (USD Billion), 2015�2022
Figure 7 Fiber Application to Dominate MEG Market Between 2017 and 2022
Figure 8 China to Be the Largest Market of MEG Between 2017 and 2022In Terms of Value
Figure 9 APAC Dominated MEG Market in 2016
Figure 10 Increasing Demand From Fiber and PET Applications to DriveMEG Market
Figure 11 Fiber to Be the Largest Application of MEG
Figure 12 Antifreeze & Coolant to Be the Fastest-Growing Application
Figure 13 APAC Dominated the MEG Market in 2016
Figure 14 MEG Name Plate Capacities and Production, 2015�2017
Figure 15 Major Importers of MEG, 2016
Figure 16 Major Exporters of MEG, 2016
Figure 17 Driver, Restraints, Opportunities, and Challenges in the MEG Market
Figure 18 Porter�s Five Forces Analysis of MEG Market
Figure 19 World Textile Trade Data (2005�2014)
Figure 20 Various Technologies Used for MEG Production
Figure 21 Naphtha-Based Production Technology
Figure 22 Production of MEG Using Oxalate Technology
Figure 23 Production of MEG Using Eastman-Jm Davy�s Technology
Figure 24 Production of MEG Using Mto Technology
Figure 25 Fiber to Lead MEG Market During Forecast Period
Figure 26 MEG Production, By Region, 2015�2017
Figure 27 India to Register Fastest Growth in MEG Market
Figure 28 APAC Market Snapshot: Growing Textile Industry to Drive MEG Market
Figure 29 PET Application to Drive MEG Market in North America
Figure 30 Europe: MEG Market Snapshot
Figure 31 Companies Adopted Investments & Expansions As the Key Growth Strategy
Figure 32 Market Share Analysis of Key Players, 2016
Figure 33 SABIC: Company Snapshot
Figure 34 Shell: Company Snapshot
Figure 35 Formosa Plastics: Company Snapshot
Figure 36 Reliance Industries: Company Snapshot
Figure 37 Sinopec: Company Snapshot
Figure 38 BASF: Company Snapshot
Figure 39 PTT Global Chemical: Company Snapshot
Figure 40 SIBUR: Company Snapshot


Growth opportunities and latent adjacency in Monoethylene Glycol (MEG) Market