Modular Substation Market by Application (Power Utilities, Commercial, Industrial), Voltage (11-33kV, 33-400kV, & above 400kV), Type (Trailer Mounted & Fixed), Insulation (Air-insulated & Gas-insulated), & Region - Global Trends and Forecast to 2020


[158 Pages Report] Global modular substation market targets the compact and modular substations available in the market. These substations replace the conventional substation with modernized equipment and better power distribution in the networks. Major advantages of these solutions are lesser land requirement, automated solutions with minimal human interference, can be employed at areas with extreme environmental conditions, and lesser power theft.
Global modular substation market is estimated to be at USD 10.78 Billion in 2015 and is projected to reach USD 16.48 Billion by 2020, at a CAGR of 8.85% from 2015 to 2020.
The report has been segmented on the basis of application, type, insulation type, voltage level and region as follows:
- On the basis of application: The report considers power utilities (covering generation, transmission and distribution sectors), industrial and commercial sector.
- On the basis of type: the report considers the two types of modular substations, fixed modular substations and skid/trailer mounted modular substations.
- On the basis of insulation type: the report considers two types of insulation, gas-insulated modular substation and air-insulated modular substation.
- On the basis of voltage level: Modular substations are available for various voltage levels. The voltage levels considered in the report include 11 kV-33 kV, 33 kV-400 kV, and above 400 kV.
- On the basis of region: the report analyzes the market at regional level, which include North America, Europe, Asia-Pacific, South America, the Middle East and Africa. Key countries are also analyzed in the report.
The report caters to modular substation manufacturers, dealers, and suppliers, material providers, consulting companies in the energy and power sector, infrastructure developers, medium and high tension consumers (industries), government and research organizations, government and private utilities , private customers, network operators, smart grid players, venture capital firms, and investment banks.
Continuous urbanization and industrialization is leading to new capacity additions in the developing regions such as the Middle East and Asia-Pacific, and replacement/upgrade of aging power infrastructure in the developed regions such as North America and Europe. The U.S. is expected to be the largest market for modular substation because of the country�s plans to improve and refurbish its existing power infrastructure. On the other hand China is the fastest growing market for modular substations. This growth is attributed to the huge demand for power solutions in the country due to huge investments in capacity addition. Moreover, India is also expected to witness increase in demand for smart solutions in power sector because of its plans for rural electrification and high rate of urbanization.
Leading players such as ABB Ltd. (Switzerland), Eaton Corporation PLC (Ireland), Siemens AG (Germany), General Electric (U.S.), and Crompton Greaves Limited (India) among others have been profiled in this report. The report provides competitive landscape with market share of the key players as well as recent development strategies.
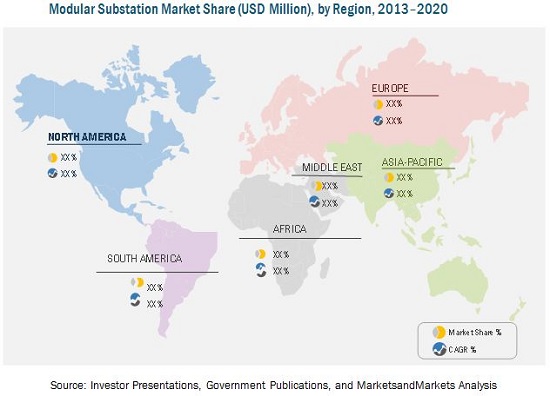
Asia-Pacific is estimated to have the largest share in the modular substation market in 2015. It is also expected to be the fast growing market at a CAGR of 9.74% from 2015 to 2020 with China and India as major contributors to the growth.
Available Customizations
With the given market data, MarketsandMarkets offers customizations according to the company�s specific needs. The following customization options are available for the report:
Regional Analysis
- Detailed country analysis of specific countries
- Further breakdown of the Asia-Pacific market
Company Information
- Detailed analysis and profiling of additional market players (Up to 5)
Modular substation is an ideal solution for smart cities as well as traditional networks which require technical upgrades. It proves to be cost effective and increases the reliability on the T&D networks with reduced downtimes and power outages.
Modular or compact substation generally finds its application in power utilities, commercial, and industries. Significant presence of such equipment can be observed in smart grid and solar & wind applications. Apart from these markets, there are temporary installations of substations in restoration, construction or load sharing application. Skid or trailer mounted modular substation is a suited solution for such applications with effortless transportation and installation.
Global Modular Substation Market is projected to witness high growth on account of aging infrastructure requiring replacement & refurbishment and increasing T&D network expansions. Global modular substation market is estimated to be at USD 10.78 Billion in 2015 and is projected to reach USD 16.48 Billion by 2020, at a CAGR of 8.85% from 2015 to 2020. , with 33kV-400kV modular substations being the most widely used modular substations for reliable power supply. Power utilities have been a major area of application of the modular substations.
Asia-Pacific held the major share in 2014; it is followed by North America and Europe. China and Saudi Arabia have higher growth potential for Modular substation. This growth can be attributed to the increased investment in power sector in Saudi Arabia and progressive economic growth of China. China is becoming the industrial hub because of low labour cost and increasing urbanization. The country is experiencing fast economic growth which would more than double the per capita electricity consumption by 2030. The market is expected to dominate the global demand for the modular substation during the forecast period.
In terms of growth strategies, market players have been establishing contracts and agreements to strengthen their market foothold. This was followed by expansions, new product launches, and mergers & acquisitions. A mix of organic and inorganic growth strategies has been observed in equal proportions along with the key developments that impacted the industry in the past years.
Leading players in the modular substation market, based on their recent developments and other strategic industrial activities, include ABB Ltd. (Switzerland), Eaton Corporation (Ireland), Siemens AG (Germany), General Electric Company (U.S.), and Crompton Greaves Ltd. (India).
 Exclusive indicates content/data unique to MarketsandMarkets and not available with any competitors.
Table of Contents
1 Introduction (Page No. - 16)
1.1 Objectives of the Study
1.2 Market Definition
1.3 Market Scope
1.3.1 Markets Covered
1.3.2 Years Considered for the Study
1.4 Currency
1.5 Stakeholders
2 Research Methodology (Page No. - 19)
2.1 Research Data
2.1.1 Secondary Data
2.1.1.1 Key Data Fron Secondary Sources
2.1.2 Primary Data
2.1.2.1 Key Data From Primary Sources
2.1.2.2 Key Industry Insights
2.1.2.3 Breakdown of Primary Interviews
2.2 Market Breakdown & Data Triangulation
2.3 Research Assumptions & Limitations
2.3.1 Assumptions
2.3.2 Limitations
3 Executive Summary (Page No. - 27)
4 Premium Insights (Page No. - 32)
4.1 Asia-Pacific is Expected to Hold the Largest Market Share During the Forecast Period
4.2 Modular Substation Market, By Application
4.3 Modular Substation, By Type
4.4 Modular Substation, By Voltage Level
4.5 Modular Substation, By Insulation Type
4.6 Asia-Pacific Modular Substation Market: Application vs Voltage Level
4.7 Lifecycle Analysis, By Region
5 Market Overview (Page No. - 40)
5.1 Introduction
5.2 Market Segmentation
5.2.1 By Voltage Level
5.2.2 By Application
5.2.3 By Insulation Type
5.2.4 By Type
5.2.5 By Region
5.3 Market Dynamics
5.3.1 Drivers
5.3.1.1 Urbanization and Industrialization
5.3.1.2 Aging Infrastructure Requires Replacement and Refurbishment
5.3.2 Restraints
5.3.2.1 Adoption of New Technology Will Increase the Energy Cost for Consumers
5.3.2.2 Lack of Standardization
5.3.3 Opportunities
5.3.3.1 Integration of Distributed Generation With the Central Grid
5.3.3.2 Increasing Investments Towards Development of Smart Cities
5.3.4 Challenges
5.3.4.1 Grid Stability
5.4 Value Chain Analysis
5.5 Industry Trends
5.6 Porter�s Five Forces Analysis
5.6.1 Threat of New Entrants
5.6.1.1 Limited Investment Required
5.6.2 Threat of Substitutes
5.6.2.1 No Substitute Available
5.6.3 Bargaining Power of Suppliers
5.6.3.1 Raw Material Market is Mature
5.6.3.2 Large Number of Suppliers
5.6.4 Bargaining Power of Buyers
5.6.4.1 Low Product Differentiation
5.6.5 Intensity of Competitive Rivalry
5.6.5.1 Less Number of Players Dominate the Market
5.7 Pestel Analysis
5.7.1 Political Factors
5.7.1.1 Government Policies
5.7.2 Economic Factors
5.7.2.1 Availability of Skilled Labor for Product Manufacturing
5.7.2.2 Import-Export Business
5.7.2.3 Potential Market Growth
5.7.2.4 Inflation Rate
5.7.3 Social Factors
5.7.3.1 Market Awareness
5.7.3.2 Rural-Urban Population Distribution
5.7.4 Technological Factors
5.7.4.1 New Products Availability
5.7.4.2 Local Regulatory Compliance
5.7.4.3 Future Upgrades
5.7.5 Legal
5.7.5.1 Tax Structure
5.7.5.2 Governing Bodies
5.7.6 Environmental Factors
5.7.6.1 Environmental Regulations
6 Modular Substation Market, By Application (Page No. - 58)
6.1 Introduction
6.2 Power Utilities
6.3 Commercial
6.4 Industrial
7 Modular Substation, By Type (Page No. - 64)
7.1 Introduction
7.2 Skid/Trailer Mounted Modular Substations
7.3 Fixed Modular Substations
8 Market, By Voltage Level (Page No. - 70)
8.1 Introduction
8.2 11 Kv-33 Kv Modular Substations
8.3 33 Kv-400 Kv Modular Substations
8.4 Above 400 Kv Modular Substations
9 Market, By Insulation Type (Page No. - 77)
9.1 Introduction
9.2 Air-Insulated Modular Substations
9.3 Gas-Insulated Modular Substations
10 Market, By Region (Page No. - 83)
10.1 Introduction
10.2 North America
10.2.1 U.S.
10.2.2 Canada
10.2.3 Mexico
10.3 Europe
10.3.1 U.K.
10.3.2 Germany
10.3.3 France
10.3.4 Rest of Europe
10.4 Asia-Pacific
10.4.1 China
10.4.2 India
10.4.3 Australia
10.4.4 Japan
10.4.5 Rest of Asia-Pacific
10.5 South America
10.5.1 Brazil
10.5.2 Argentina
10.5.3 Rest of South America
10.6 Middle East
10.6.1 Saudi Arabia
10.6.2 UAE
10.6.3 Kuwait
10.6.4 Rest of the Middle East
10.7 Africa
10.7.1 South Africa
10.7.2 Rest of Africa
11 Competitive Landscape (Page No. - 119)
11.1 Overview
11.2 Market Share Analysis, By Developments, 2014
11.3 Competitive Situation & Trends
11.4 Contracts & Agreements
11.5 Expansions
11.6 New Product Developments
11.7 Mergers & Acquisitions
12 Company Profiles (Page No. - 126)
(Company at A Glance, Recent Financials, Products & Services, Strategies & Insights, & Recent Developments)*
12.1 Introduction
12.2 ABB Ltd.
12.3 Eaton Corporation PLC
12.4 Siemens AG
12.5 General Electric Company
12.6 Crompton Greaves Limited
12.7 Bharat Heavy Electricals Limited
12.8 SPX Transformer Solutions, Inc.
12.9 Creative Distribution Automation Co. Ltd.
12.10 Skema S.P.A.
12.11 Modpower Solutions
12.12 Ampcontrol Pty Ltd.
12.13 American Modular Power Solutions, Inc.
12.14 Enerset Power Solutions
*Details on Company at A Glance, Recent Financials, Products & Services, Strategies & Insights, & Recent Developments Might Not Be Captured in Case of Unlisted Companies.
13 Appendix (Page No. - 153)
13.1 Insights of Industry Experts
13.2 Discussion Guide
13.3 Introducing RT: Real Time Market Intelligence
13.4 Available Customizations
13.5 Related Reports
List of Tables (84 Tables)
Table 1 Modular Substations: Business and Technical Objectives
Table 2 Industrialization & Urbanization are the Driving Force of the Market
Table 3 Increase in Energy Cost is the Major Restraining Force of the Market
Table 4 Integration of Distributed Generation is the Key Opportunity for Modular Substations
Table 5 Grid Stability is the Major Challenge for the Market
Table 6 Modular Substation Market Size, By Application, 2013-2020 (USD Million)
Table 7 Power Utilities: Market Size, By Region, 2013�2020 (USD Million)
Table 8 Commercial: Market Size, By Region, 2013-2020 (USD Million)
Table 9 Industrial: Market Size, By Region, 2013-2020 (USD Million)
Table 10 Modular Substation Market Size, By Voltage Level, 2013-2020 (USD Million)
Table 11 Skid/Trailer Mounted: Market Size, By Region, 2013-2020 (USD Million)
Table 12 Fixed: Market Size, By Region, 2013-2020 (USD Million)
Table 13 Modular Substation Market Size, By Voltage Level, 2013-2020 (USD Million)
Table 14 11 Kv-33 Kv: Market Size, By Region, 2013-2020 (USD Million)
Table 15 33 Kv-400 Kv: Market Size, By Region, 2013-2020 (USD Million)
Table 16 Above 400 Kv: Market Size, By Region, 2012-2020 (USD Million)
Table 17 Market Size, By Insulation Type, 2013-2020 (USD Million)
Table 18 Air-Insulated: Market Size, By Region, 2013-2020 (USD Million)
Table 19 Gas-Insulated: Market Size, By Region, 2013-2020 (USD Million)
Table 20 Modular Substation Market Size, By Region, 2013�2020 (USD Million)
Table 21 North America: Modular Substation Market Size, By Country, 2013�2020 (USD Million)
Table 22 North America: Market Size, By Application, 2013�2020 (USD Million)
Table 23 North America: Market Size, By Voltage Level, 2013�2020 (USD Million)
Table 24 U.S.: Market Size, By Application, 2013�2020 (USD Million)
Table 25 U.S.: Market Size, By Voltage Level, 2013�2020 (USD Million)
Table 26 Canada: Market Size, By Application, 2013�2020 (USD Million)
Table 27 Canada: Market Size, By Voltage Level, 2013�2020 (USD Million)
Table 28 Mexico: Market Size, By Application, 2013�2020 (USD Million)
Table 29 Mexico: Market Size, By Voltage Level, 2013�2020 (USD Million)
Table 30 Europe: Modular Substation Market Size, By Country, 2013�2020 (USD Million)
Table 31 Europe: Market Size, By Application, 2013�2020 (USD Million)
Table 32 Europe: Market Size, By Voltage Level, 2013�2020 (USD Million)
Table 33 U.K.: Market Size, By Application, 2013�2020 (USD Million)
Table 34 U.K.: Market Size, By Voltage Level, 2013�2020 (USD Million)
Table 35 Germany: Market Size, By Application, 2013�2020 (USD Million)
Table 36 Germany: Market Size, By Voltage Level, 2013�2020 (USD Million)
Table 37 France: Market Size, By Application, 2013�2020 (USD Million)
Table 38 France: Market Size, By Voltage Level, 2013�2020 (USD Million)
Table 39 Rest of Europe: Market Size, By Application, 2013�2020 (USD Million)
Table 40 Rest of Europe: Market Size, By Voltage Level, 2013�2020 (USD Million)
Table 41 Asia-Pacific: Modular Substation Market Size, By Country, 2013�2020 (USD Million)
Table 42 Asia-Pacific: Market Size, By Application, 2013�2020 (USD Million)
Table 43 Asia-Pacific: Market Size, By Voltage Level, 2013�2020 (USD Million)
Table 44 China: Market Size, By Application, 2013�2020 (USD Million)
Table 45 China: Market Size, By Voltage Level, 2013�2020 (USD Million)
Table 46 India: Market Size, By Application, 2013�2020 (USD Million)
Table 47 India: Market Size, By Voltage Level, 2013�2020 (USD Million)
Table 48 Australia: Modular Substation Market Size, By Application, 2013�2020 (USD Million)
Table 49 Australia: Market Size, By Voltage Level, 2013�2020 (USD Million)
Table 50 Japan: Market Size, By Application, 2013�2020 (USD Million)
Table 51 Japan: Market Size, By Voltage Level, 2013�2020 (USD Million)
Table 52 Rest of Asia-Pacific:Market Size, By Application, 2013�2020 (USD Million)
Table 53 Rest of Asia-Pacific:Market Size, By Voltage Level, 2013�2020 (USD Million)
Table 54 South America: Modular Substation Market Size, By Country, 2013�2020 (USD Million)
Table 55 South America: Market Size, By Application, 2013�2020 (USD Million)
Table 56 South America: Market Size, By Voltage Level, 2013�2020 (USD Million)
Table 57 Brazil: Market Size, By Application, 2013�2020 (USD Million)
Table 58 Brazil: Market Size, By Voltage Level, 2013�2020 (USD Million)
Table 59 Argentina: Market Size, By Application, 2013�2020 (USD Million)
Table 60 Argentina: Market Size, By Voltage Level, 2013�2020 (USD Million)
Table 61 Rest of South America: Market Size, By Application, 2013�2020 (USD Million)
Table 62 Rest of South America: Market Size, By Voltage Level, 2013�2020 (USD Million)
Table 63 Middle East: Modular Substation Market Size, By Country, 2013�2020 (USD Million)
Table 64 Middle East: Market Size, By Application, 2013�2020 (USD Million)
Table 65 Middle East: Market Size, By Voltage Level, 2013�2020 (USD Million)
Table 66 Saudi Arabia: Market Size, By Application, 2013�2020 (USD Million)
Table 67 Saudi Arabia: Market Size, By Voltage Level, 2013�2020 (USD Million)
Table 68 UAE: Market Size, By Application, 2013�2020 (USD Million)
Table 69 UAE: Market Size, By Voltage Level, 2013�2020 (USD Million)
Table 70 Kuwait: Market Size, By Application, 2013�2020 (USD Million)
Table 71 Kuwait: Market Size, By Voltage Level, 2013�2020 (USD Million)
Table 72 Rest of Middle East: Market Size, By Application, 2013�2020 (USD Million)
Table 73 Rest of Middle East: Market Size, By Voltage Level, 2013�2020 (USD Million)
Table 74 Africa: Modular Substation Market Size, By Country, 2013�2020 (USD Million)
Table 75 Africa : Market Size, By Application, 2013�2020 (USD Million)
Table 76 Africa : Market Size, By Voltage Level, 2013�2020 (USD Million)
Table 77 South Africa: Market Size, By Application, 2013�2020 (USD Million)
Table 78 South Africa: Market Size, By Voltage Level, 2013�2020 (USD Million)
Table 79 Rest of Africa: Market Size, By Application, 2013�2020 (USD Million)
Table 80 Rest of Africa: Market Size, By Voltage Level, 2013�2020 (USD Million)
Table 81 Contracts & Agreements, 2015
Table 82 Expansion, 2013-2015
Table 83 New Product Developments, 2012�2015
Table 84 Mergers & Acquisitions, 2012-2014
List of Figures (64 Figures)
Figure 1 Modular Substation Market Segmentation
Figure 2 Modular Substation: Research Design
Figure 3 Breakdown of Primary Interviews: By Company Type, Designation, & Region
Figure 4 Market Size Estimation Methodology: Top-Down Approach
Figure 5 Market Size Estimation Methodology: Bottom-Up Approach
Figure 6 Data Triangulation Methodology
Figure 7 Power Utilities is Expected to Dominate the Modular Substation Industry During the Forecast Period
Figure 8 Gas-Insulated Modular Substations is Expected to Witness the Maximum Demand During the Forecast Period
Figure 9 Asia-Pacific is Expected to Dominate the Modular Substation Industry During the Forecast Period
Figure 10 Market Size, By Type, 2015 & 2020
Figure 11 Asia-Pacific Accounted for the Largest Market Share in Modular Substation Industry in 2014
Figure 12 Attractive Market Opportunities in the Modular Substation Market, 2015-2020
Figure 13 Asia-Pacific & the Middle East are Expected to Grow at A High CAGR From 2015 to 2020
Figure 14 Demand From Power Utilities is Expected to Dominate the Modular Substation Industry During the Forecast Period
Figure 15 Fixed Modular Substations are Expected to Grow at the Fastest Rate During the Forecast Period
Figure 16 Regions in Developing Countries to Grow Faster Than the Developed Ones During the Forecast Period
Figure 17 Gas-Insulated Modular Substations are Expected to Grow at the Highest CAGR During the Forecast Period
Figure 18 33 Kv-400 Kv Modular Substations Held the Largest Market Share in 2014
Figure 19 Asia-Pacific Market is Expected to Grow at the Fastest Rate During the Forecast Period
Figure 20 Modular Substation Market Segmentation: By Voltage Level
Figure 21 Modular Substation Segmentation: By Application
Figure 22 Modular Substation Segmentation: By Insulation Type
Figure 23 Modular Substation Segmentation: By Type
Figure 24 Modular Substation Segmentation: By Region
Figure 25 Modernization of Existing Power Infrastructure and Industrialization to Propel Market Growth
Figure 26 Investment in Renewable Energy Sources, 2004-2014 (USD Billion)
Figure 27 Leading Investors in Renewable Energy Sources, 2014 (USD Billion)
Figure 28 Value Chain Analysis: Major Value is Added During Manufacturing and Assembling
Figure 29 Porter�s Five Forces Analysis: Intensity of Rivalry is Moderate in the Modular Substation
Figure 30 Power Utilities Projected to Be the Largest Market for Modular Substation Market By 2020
Figure 31 Increase in Power Generation and Expansion of Distribution Networks is Expected to Drive the Asia-Pacific Modular Substation Industry During the Forecast Period
Figure 32 Increasing Rate of Urbanization in Asia-Pacific is Fueling the Growth in Commercial Segment (2015-2020)
Figure 33 North America is Projected to Be the Largest Consumer of Industrial Application During the Forecast Period
Figure 34 Fixed Modular Substations are Expected to Dominate the Market With Highest CAGR & Maximum Size During the Forecast Period
Figure 35 Asia-Pacific to Lead the Skid/Trailer Mounted Modular Substation Industry During the Forecast Period
Figure 36 Asia-Pacific is Estimated to Be the Leading Market in Fixed Modular Substations, 2015
Figure 37 33 Kv-400 Kv Modular Substations are Expected to Dominate the Market With Maximum Size (2015-2020)
Figure 38 11 Kv-33 Kv Modular Substation Industry is Expected to Grow at the Highest CAGR in the Middle East
Figure 39 Asia-Pacific is Projected to Be the Highest Growing Market in 33 Kv-400 Kv Modular Substations During the Forecast Period
Figure 40 Europe is Projected to Be the Highest Growing Market in Above 400 Kv Modular Substations, 2015-2020
Figure 41 Gas-Insulated Modular Substations are Expected to Dominate the Market With the Highest CAGR & Maximum Size (2015-2020)
Figure 42 Asia-Pacific is Expected to Dominate the Air-Insulated Modular Substation Industry During the Forecast Period
Figure 43 North America is Estimated to Be the Largest Market for Gas-Insulated Modular Substations, 2015
Figure 44 Regional Snapshot (2014): Aisa-Pacific to Have the Highest CAGR Due to Rapid Industrialization & Urbanization (2015�2020)
Figure 45 Modular Substation Market Size, By Region, 2015�2020 (USD Million)
Figure 46 North America: Modular Substation Industry
Figure 47 Asia-Pacific: Modular Substation Industry
Figure 48 Companies Adopted Contracts & Agreements as the Key Growth Strategy , 2011-2015
Figure 49 ABB Ltd. Accounted for A Major Share in the Modular Substation Industry, 2014
Figure 50 Market Evaluation Framework
Figure 51 Battle for Market Share: Contracts & Agreements is the Key Strategy
Figure 52 Regional Revenue Mix of Top 5 Market Players
Figure 53 ABB Ltd.: Company Snapshot
Figure 54 ABB Ltd.: SWOT Analysis
Figure 55 Eaton Corporation PLC.: Company Snapshot
Figure 56 Eaton Corporation PLC: SWOT Analysis
Figure 57 Siemens AG: Company Snapshot
Figure 58 Siemens AG:SWOT Analysis
Figure 59 General Electric Company: Company Snapshot
Figure 60 General Electric Company: SWOT Analysis
Figure 61 Crompton Greaves Limited: Company Snapshot
Figure 62 Crompton Greaves Limited: SWOT Analysis
Figure 63 Bharat Heavy Electricals Limited: Company Snapshot
Figure 64 SPX Transformer Solutions, Inc.: Company Snapshot


Growth opportunities and latent adjacency in Modular Substation Market