Mobile Mass Spectrometers Market by Application (Homeland Security, Military & Defence, Environmental monitoring, Emergency/rapid response & Disaster Management, Narcotics Detection, Chemical leak detection, Forensics), & Region - Global Forecasts to 2026
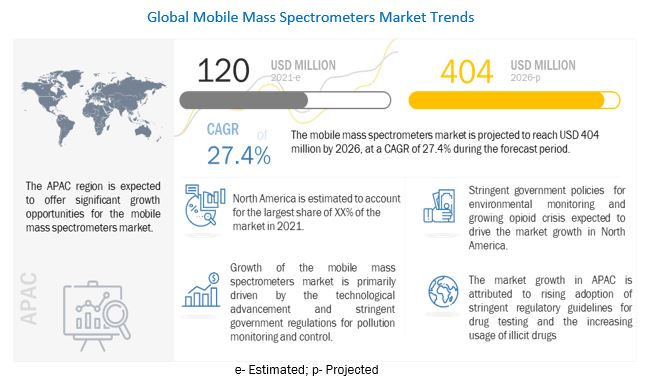
The mobile mass spectrometers market size is projected to reach USD 404 million by 2026, at a CAGR of 27.4% during the forecast period. Product architecture & ease of use and technological advancements coupled with stringent government regulations for pollution monitoring and control are high growth prospects for the mobile mass spectrometer market during the forecast period.

To know about the assumptions considered for the study, Request for Free Sample Report
Mobile Mass Spectrometers Market Growth Dynamics
Drivers: Technological advancements
The evolution in design and performance of portable mass spectrometer systems has changed drastically in the past 20 years as they continue to advance towards high performance with chemical and/or matrix-specific proficiency depending on the area of application.
Capabilities afforded by portable mass spectrometer systems are beneficial to these end users because it enables adjustments to both operational and strategic decisions in real-time.
These improvements in technology are expected to result in the rapid commercialization of mobile mass spectrometer systems. For instance, the market for security applications is growing due to ongoing advancements such as inbuilt compound libraries.
Restraints: Premium product pricing
Majority of commercially available portable MS systems are not universally suitable for large groups of users. They are still individually custom-built for specific applications.
Therefore, these systems are equipped with advanced features and functionalities and thus are high priced. Moreover, these instruments need periodic maintenance, leading to the increased overall cost of the equipment. This may restrain the growth of the mobile mass spectrometers market.
Opportunities: Increased industrial activities in emerging markets
Increase in industrialization in regions such as the Asia Pacific, Middle East, and Africa has increased awareness among the people regarding environmental pollution and degradation. This has resulted in the implementation of numerous environmental protection acts. Because of the increase in pollution and environmental contamination, several amendments and new environmental safety standards are expected to be set up mainly in the developing economies in the next five years.
The progressive development of new testing methods for testing samples of contaminants such as pesticide residues, heavy metals, and organic chemicals is expected to play an important role in promoting the growth of the mobile mass spectrometers market.
Challenges: Technical limitations related to product efficacy
It is reported that quantitative measures of performance such as resolution and detection limits are poorer in mobile mass spectrometers compared to those obtained with the corresponding conventional laboratory systems. This is primarily due to mechanical errors being relatively large compared to the scale of the miniaturized system.
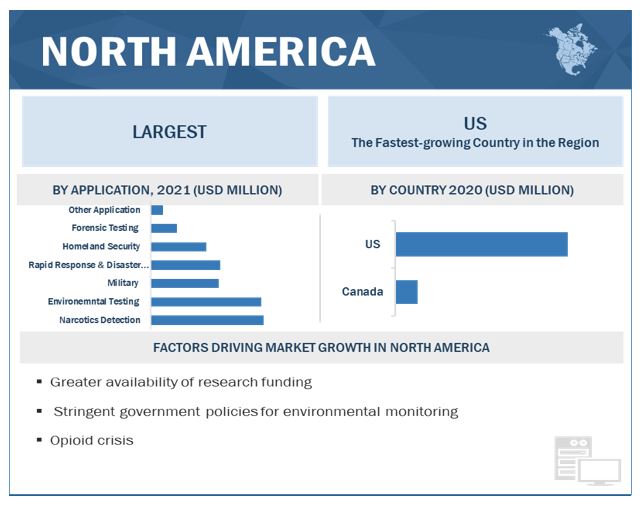
By application, Environmental testing is the key application of mobile mass spectrometers. Rising global demand for in situ environmental monitoring is expected to drive the mobile mass spectrometer market. Moreover, regulations and legislations set forth by government organizations have triggered the testing, inspection, and certification of environmental samples tested by the government and manufacturing companies. Regulatory bodies have introduced guidelines for regulating the inspection, sampling, and testing services of environmental samples to detect the presence of pollutants and contaminants. These bodies have introduced various programs to generate awareness and set testing specifications to ensure the safety of the environment and reduce the health risks associated with a polluted environment.
By region, North America accounted for the largest market share in the mobile mass spectrometers market in 2020. A number of factors, such as growing greater government focus on narcotics detection and homeland security and opioid crisis are driving the growth of the North American mobile mass spectrometers market. Moreover, in North American region the regulatory bodies are closely monitoring the safety and quality of the environment to establish environmental safety across the geographies.

To know about the assumptions considered for the study, download the pdf brochure
Mobile Mass Spectrometers Market Key Players
The major players in the mobile mass spectrometers market are FLIR (US), 908 Devices(US), PerkinElmer (US), Inficon (Switzerland), BaySpec (US)Bruker Corporation (US), PURSPEC (US), Focused Photonics (China), 1st detect (US), and Kore Technology(UK) among others.
Scope of the Mobile Mass Spectrometers Market Report
|
Report Metrics |
Details |
|
Market Size value 2026 |
USD 404 million |
|
Growth Rate |
27.4% Compound Annual Growth Rate (CAGR) |
|
Largest Market |
North America |
|
Market Dynamics |
Drivers, Opportunities, Restraints & Challenges |
|
Largest Share Segments |
|
|
Table of Content |
|
|
Market Segmentation |
Application, End User And Regional. |
|
Mobile Mass Spectrometers Market Growth Drivers |
Technological advancements |
|
Mobile Mass Spectrometers Market Growth Opportunities |
Increased industrial activities in emerging markets |
|
Report Highlights |
|
|
Geographies Covered |
North America, Europe, APAC, MEA, and Latin America |
This research report categorizes the mobile mass spectrometers market based on application and region
By Application
- Environmental testing
- Homeland Security
- Rapid Response & Disaster Management
- Military
- Narcotics Detection
- Forensic Testing
- Other Applications
By Region
- North America
- Europe
- Asia Pacific
- Rest of the World
Recent Developments:
- In July 2021, 908 Devices announced the expansion of its strategic distribution network in the APAC, Europe, and the Americas.
- In May 2021, 908 Devices updated its MX908 handheld mass spectrometer device, including an aerosol module to detect and identify aerosolized chemical threats.
- In March 2021, FLIR won a contract worth USD 8.0 million from the United States Defense Threat Reduction Agency’s Joint Science and Technology Office (DTRA JSTO) for the development of chemical detection solutions based on IMS and MS technology.
Frequently Asked Questions (FAQ):
What is the size of Mobile Mass Spectrometers Market ?
The Mobile Mass Spectrometers Market size is projected to reach USD 404 Million by 2026, growing at a CAGR of 27.4%.
What are the major growth factors of Mobile Mass Spectrometers Market ?
The high cost of mobile mass spectrometers is expected to limit market growth in the forecast years. Moreover, concerns related to technical efficacy of the product are also expected to challenge market growth to a certain extent.
Who all are the prominent players of Mobile Mass Spectrometers Market ?
The major players in the mobile mass spectrometer industry are FLIR (US), 908 Devices(US), PerkinElmer (US), Inficon (Switzerland), BaySpec (US)Bruker Corporation (US), PURSPEC (US), Focused Photonics (China), 1st detect (US), and Kore Technology(UK) among others.
To speak to our analyst for a discussion on the above findings, click Speak to Analyst

TABLE OF CONTENTS
1 INTRODUCTION
1.1 OBJECTIVES OF THE STUDY
1.2 MARKET DEFINITION
1.3 KEY EXCLUSIONS
2 RESEARCH METHODOLOGY
2.1 RESEARCH DATA
2.1.1 SECONDARY DATA
2.1.2 PRIMARY DATA
2.2 MARKET SIZE ESTIMATION METHODOLOGY
2.2.1 ILLUSTRATION FOR THE MARKET SIZING OF THE GLOBAL MOBILE MASS SPECTROMETERS MARKET
2.3 OVERALL WORKFLOW OF PRIMARY RESEARCH
2.3.1 PRIMARY SAMPLE SIZE
2.3.2 INDICATIVE LIST OF PRIMARY STAKEHOLDERS TARGETED
3 EXECUTIVE SUMMARY
3.1 GLOBAL MOBILE MASS SPECTROMETERS MARKET LANDSCAPE, 2020 VS. 2026
FIGURE1 GLOBAL MOBILE MASS SPECTROMETERS MARKET, BY VALUE (USD MILLION)
FIGURE2 GLOBAL MOBILE MASS SPECTROMETERS MARKET, BY VOLUME (UNITS)
3.2 GLOBAL MOBILE MASS SPECTROMETERS MARKET LANDSCAPE FOR KEY APPLICATIONS, 2020 VS. 2026
4 MARKET OVERVIEW
4.1 MARKET DYNAMICS
4.1.1 MAJOR DRIVERS
4.1.2 KEY RESTRAINTS
4.1.3 KEY GROWTH OPPORTUNITIES
4.2 COVID- SPECIFIC TRENDS
4.3 GLOBAL PRICING TREND ANALYSIS (AS OF 2020)
4.4 GLOBAL PATENT ANALYSIS
5 MOBILE MASS SPECTROMETERS MARKET VALUE DATA, BY APPLICATION (USD MILLION; 2019 — 2026)
5.1 MOBILE MASS SPECTROMETERS MARKET, BY APPLICATION
TABLE1 MOBILE MASS SPECTROMETERS MARKET VALUE DATA, BY APPLICATION, 2019-2026 (USD MILLION)
TABLE2 MOBILE MASS SPECTROMETERS MARKET VALUE DATA FOR ENVIRONMENTAL TESTING, BY REGION, 2019-2026 (USD MILLION)
TABLE3 MOBILE MASS SPECTROMETERS MARKET VALUE DATA FOR NARCOTICS DETECTION, BY REGION, 2019-2026 (USD MILLION)
TABLE4 MOBILE MASS SPECTROMETERS MARKET VALUE DATA FOR RAPID RESPONSE & DISASTER MANAGEMENT, BY REGION, 2019-2026 (USD MILLION)
TABLE5 MOBILE MASS SPECTROMETERS MARKET VALUE DATA FOR MILITARY APPLICATIONS, BY REGION, 2019-2026 (USD MILLION)
TABLE6 MOBILE MASS SPECTROMETERS MARKET VALUE DATA FOR HOMELAND SECURITY, BY REGION, 2019-2026 (USD MILLION)
TABLE7 MOBILE MASS SPECTROMETERS MARKET VALUE DATA FOR FORENSIC APPLICATIONS, BY REGION, 2019-2026 (USD MILLION)
TABLE8 MOBILE MASS SPECTROMETERS MARKET VALUE DATA FOR OTHER APPLICATIONS, BY REGION, 2019-2026 (USD MILLION)
6 MOBILE MASS SPECTROMETERS MARKET VALUE DATA, BY REGION (USD MILLION; 2019 — 2026)
6.1 GLOBAL
TABLE9 MOBILE MASS SPECTROMETERS MARKET VALUE DATA, BY REGION, 2019-2026 (USD MILLION)
TABLE10 MOBILE MASS SPECTROMETERS MARKET VOLUME DATA, BY REGION, 2019-2026 (UNITS)
6.2 NORTH AMERICA
TABLE11 NORTH AMERICA: MOBILE MASS SPECTROMETERS MARKET VALUE DATA, BY APPLICATION, 2019-2026 (USD MILLION)
TABLE12 NORTH AMERICA: MOBILE MASS SPECTROMETERS MARKET VOLUME DATA, BY COUNTRY, 2019-2026 (UNITS)
6.2.1 US
TABLE13 US: MOBILE MASS SPECTROMETERS MARKET VALUE DATA, BY APPLICATION, 2019-2026 (USD MILLION)
6.2.2 CANADA
TABLE14 CANADA: MOBILE MASS SPECTROMETERS MARKET VALUE DATA, BY APPLICATION, 2019-2026 (USD MILLION)
6.3 EUROPE
TABLE15 EUROPE: MOBILE MASS SPECTROMETERS MARKET VALUE DATA, BY APPLICATION, 2019-2026 (USD MILLION)
TABLE16 EUROPE: MOBILE MASS SPECTROMETERS MARKET VOLUME DATA, BY COUNTRY, 2019-2026 (UNITS)
6.3.1 GERMANY
TABLE17 GERMANY: MOBILE MASS SPECTROMETERS MARKET VALUE DATA, BY APPLICATION, 2019-2026 (USD MILLION)
6.3.2 UK
TABLE18 UK: MOBILE MASS SPECTROMETERS MARKET VALUE DATA, BY APPLICATION, 2019-2026 (USD MILLION)
6.3.3 FRANCE
TABLE19 FRANCE: MOBILE MASS SPECTROMETERS MARKET VALUE DATA, BY APPLICATION, 2019-2026 (USD MILLION)
6.3.4 ITALY
TABLE20 ITALY: MOBILE MASS SPECTROMETERS MARKET VALUE DATA, BY APPLICATION, 2019-2026 (USD MILLION)
6.3.5 REST OF EUROPE
TABLE21 REST OF EUROPE: MOBILE MASS SPECTROMETERS MARKET VALUE DATA, BY APPLICATION, 2019-2026 (USD MILLION)
6.4 ASIA-PACIFIC
TABLE22 ASIA PACIFIC: MOBILE MASS SPECTROMETERS MARKET VALUE DATA, BY APPLICATION, 2019-2026 (USD MILLION)
TABLE23 ASIA PACIFIC: MOBILE MASS SPECTROMETERS MARKET VOLUME DATA, BY COUNTRY, 2019-2026 (UNITS)
6.4.1 CHINA
TABLE24 CHINA: MOBILE MASS SPECTROMETERS MARKET VALUE DATA, BY APPLICATION, 2019-2026 (USD MILLION)
6.4.2 JAPAN
TABLE25 JAPAN: MOBILE MASS SPECTROMETERS MARKET VALUE DATA, BY APPLICATION, 2019-2026 (USD MILLION)
6.4.3 SOUTH KOREA
TABLE26 SOUTH KOREA: MOBILE MASS SPECTROMETERS MARKET VALUE DATA, BY APPLICATION, 2019-2026 (USD MILLION)
6.4.4 REST OF APAC
TABLE27 REST OF ASIA PACIFIC: MOBILE MASS SPECTROMETERS MARKET VALUE DATA, BY APPLICATION, 2019-2026 (USD MILLION)
6.5 REST OF WORLD
TABLE28 REST OF THE WORLD: MOBILE MASS SPECTROMETERS MARKET VALUE DATA, BY APPLICATION, 2019-2026 (USD MILLION
7 COMPETITIVE LANDSCAPE
7.1 GLOBAL MOBILE MASS SPECTROMETERS MARKET SHARE BY MAJOR PLAYER
7.1.1 MAJOR GLOBAL PLAYERS FOR MOBILE MASS SPECTROMETERS (2020)
7.2 DETAILED MAPPING OF MAJOR BRANDS
7.3 MAJOR STRATEGIC DEVELOPMENTS UNDERTAKEN BY LEADING VENDORS DURING 2018–2021
8 COMPANY PROFILES
(Business overview, Products offered, Recent developments, MNM view)*
8.1 1ST DETECT
8.2 908 DEVICES
8.3 BAYSPEC
8.4 BRUKER
8.5 ESS
8.6 TELEDYNE FLIR LLC.
8.7 FLUID INCLUSION TECHNOLOGIES
8.8 FOCUSED PHOTONICS
8.9 GASOMETRIX
8.10 GUANGZHOU HEXIN INSTRUMENT CO., LTD.
8.11 HIDEN ANALYTICAL
8.12 INFICON
8.13 KORE TECHNOLOGY
8.14 MASSTECH
8.15 PERKINELMER
8.16 PURDUE UNIVERSITY
8.17 PURSPEC
*Business overview, Products offered, Recent developments, MNM view might not be captured in case of unlisted companies
9 APPENDIX
9.1 KEY VERBATIM
9.2 DISCUSSION GUIDE
9.3 AUTHOR DETAILS
This study involved four major activities in estimating the current size of the mobile mass spectrometers market. Exhaustive secondary research was done to collect information on the market, peer market, and parent market. The next step was to validate these findings, assumptions, and market sizing with industry experts across the value chain through primary research. Both top-down and bottom-up approaches were used to estimate the total market size. After that, the market breakdown and data triangulation were done to determine the market size of the segments and sub-segments.
Secondary Research
This research study involved the use of extensive secondary sources, directories, and databases, such as Hoover’s, Bloomberg BusinessWeek, Factiva, and OneSource, to identify and collect information useful for a technical, market-oriented, and commercial study of the mobile mass spectrometers market. The other secondary sources included annual reports, press releases & investor presentations of companies, white papers, certified publications, articles by recognized authors, manufacturer associations, trade directories, and databases.
Primary Research
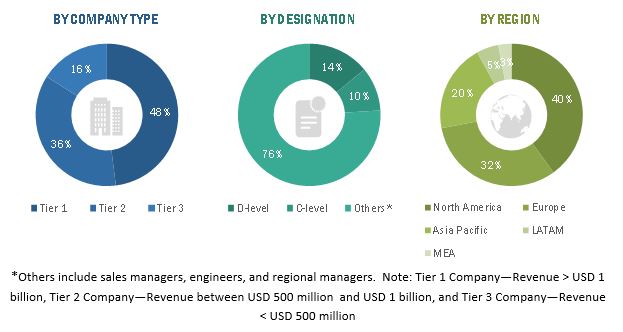
The mobile mass spectrometers market comprises several stakeholders, such as end-product manufacturers, raw material providers, and end-users in the supply chain. The demand-side of this market is characterized by its end-users, such as military & defense organizations, security agencies, and environmental testing laboratories among others. The supply-side is characterized by raw material providers, integrators, and others. Various primary sources from both the supply and demand sides of the market were interviewed to obtain qualitative and quantitative information. The breakdown of primary respondents are given below:

To know about the assumptions considered for the study, download the pdf brochure
Market Size Estimation
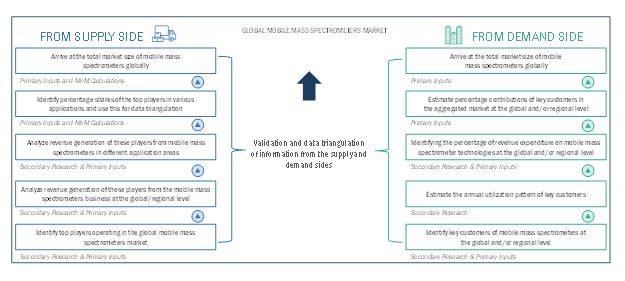
Both top-down and bottom-up approaches have been used to estimate and validate the size of the mobile mass spectrometers market and its dependent submarkets. These methods were also used extensively to determine the extent of various sub-segments in the market. The research methodology used to estimate the market size includes the following:
- The key players in the industry and demand have been identified through extensive secondary research, and their market share has been determined through both primary and secondary research.
- The industry’s supply chain and market size, in terms of value and volume, have been determined through primary and secondary research processes.
- All percentage shares, splits, and breakdowns have been determined using secondary sources and verified through primary sources.

Data Triangulation
After arriving at the overall market size—using the market size estimation processes as explained above—the market was split into several segments and subsegments. To complete the whole market engineering process and arrive at the exact statistics of each market segment and subsegment, data triangulation, and market breakdown procedures were employed, wherever applicable. The data was triangulated by studying various factors and trends from both the demand and supply sides in the end-use industries.
Report Objectives
- To analyze and estimate the global mobile mass spectrometers market size in terms of sales value (USD, 2019-2026) and growth forecasts (2021-2026) for target countries (US, Canada, Germany, UK, France, Italy, China, South Korea, and Japan)
- To analyze and estimate the global mobile mass spectrometers market size and growth forecasts in terms of key specific application areas for target countries
- To identify the emerging technologies, industry trends, and regulations that are expected to shape the future of the global mobile mass spectrometers market during the coming decade
- To study and outline the revenue impact of the COVID-19 pandemic on the global mobile mass spectrometers market
- To define and elaborate the major factors impacting the industry growth in each application and to identify major market opportunities, challenges, and threats
- To identify and analyze major and emerging players in the global mobile mass spectrometers market and to estimate their percentage contribution in terms of revenue in 2020
Available Customizations:
With the given market data, MarketsandMarkets offers customizations as per the client’s specific needs. The following customization options are available for the mobile mass spectrometers market report:
Regional Analysis
- Further breakdown of region or country-specific analysis
Company Information
- Detailed analyses and profiling of additional market players (up to 5)


 Generating Response ...


Growth opportunities and latent adjacency in Mobile Mass Spectrometers Market