Counter-IED Market by End User (Military, Homeland Security), Deployment (Vehicle mounted, Ship mounted, Airborne mounted, Handheld), Capability (Detection (ADS, MIDS), and Countermeasure (Jammer, Neutralization)) and Region - Global Forecast to 2022


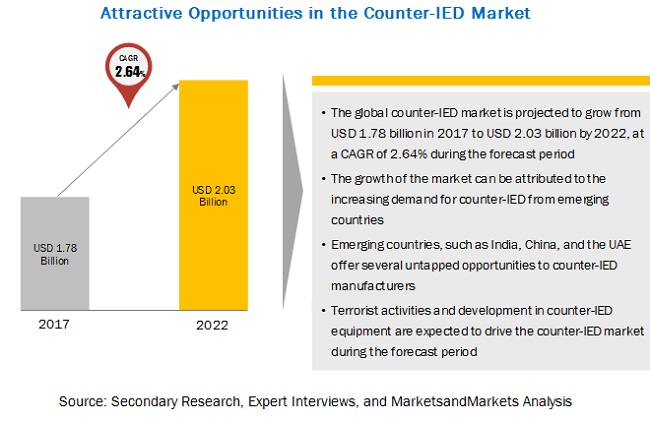
MarketsandMarkets forecasts the counter-IED market size to grow from USD 1.78 billion in 2017 to USD 2.03 billion by 2022, at a CAGR of 2.64% during the forecast period from 2017 to 2022. The major factors that are expected to be driving the counter-IED market are the changing nature of modern warfare, increasing incidences of terror attacks involving improvised explosive device (IED) blasts across the globe, increasing demand for counter-IED equipment and devices from the emerging economies as they have low budgets for carrying out R&D activities for the development of new and advanced counter-IED technologies, and deployment of different types of advanced IED detection and countermeasure equipment. The objectives of the report are to define, describe, and forecast the counter-IED market size based on end user, deployment, capability, and region.
Counter IED Market, By end user, the military segment is expected to lead in 2017.
Among end users, the military segment is expected to lead the counter-IED market in 2017. Militaries of different countries across the globe are widely engaged in dealing with insurgents, terrorists, and other non-state actors, who use improvised explosive devices (IEDs) as a major tool to inflict increased damages to public and private properties and cause casualties. As such, different types of counter-IED equipment are used by militaries of different countries to counter threats posed by these improvised explosive devices (IEDs).
By deployment, the airborne mounted segment of the counter-IED market is estimated to grow at the highest CAGR during the forecast period
The airborne mounted deployment segment of the counter-IED market is estimated to grow at the highest CAGR during the forecast period. The growth of this segment of the market can be attributed to extensive use of airborne platforms by militaries of different countries to detect improvised explosive devices (IEDs) planted underground. These platforms are added with different types of sensors and payloads to detect improvised explosive devices (IEDs) at varied ranges
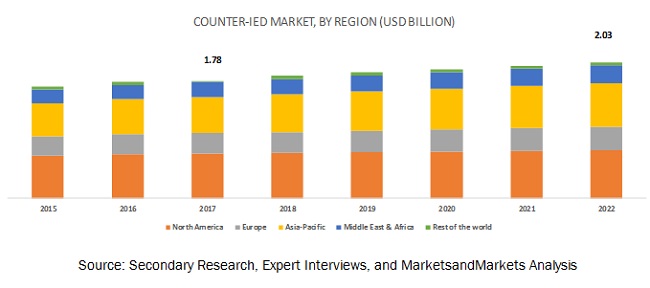
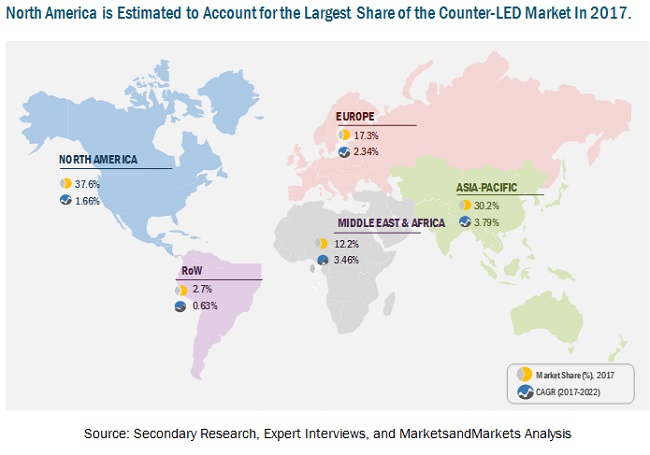
Counter IED Market, By Region, the Asia Pacific region is projected to grow at the highest CAGR during the forecast period
Among the regions, Asia Pacific�s counter-IED market is projected to grow at the highest CAGR during the forecast period, followed by the Middle East & Africa counter-IED market. The growing use of improvised explosive devices (IEDs) in terror attacks and increasing defense spending in the emerging countries of the Asia Pacific region are the factors expected to drive the growth of the Asia Pacific counter-IED market during the forecast period. A number of countries of the Asia Pacific region are replacing conventional IED detection techniques with modern ground penetrating radars, laser detectors, and high-resolution optical detection systems.
Market Dynamic : Counter IED Market
Driver: Increasing Focus on Counter IED Developments
Governments of various countries are prioritizing on enhancing counter-IED capabilities by training homeland security personnel, developing new solutions for EOD operations, and others. For instance, the US Joint Improvised Explosive Device Defeat Organization (JIEDDO) is involved in the development and procurement of advanced technologies, standardization and doctrine development and developing capabilities for EOD and IED technology. As a part of ongoing prioritization, in 2017, U.S. awarded a contract worth USD 1.7 billion to CACI International Inc to provide deployable analytical operations, intelligence, and training services to Joint Improvised-Threat Defeat Organization (JIDO).
Restraint: Protectionist policies leading to limited access to counter-IED technologies
Countries and consortiums that are developing counter-IED have placed various restrictions on the supply, sharing, selling, and proliferation of technologies. Protectionist policies are employed to limit the access of advance technology to other nations due to security concerns and geopolitical issues. These protectionist policies have led to limited access to counter-IED solutions and are a hurdle in the growth of the counter-IED market. For instance, the US is one of the leading markets for counter-IED. The US is sharing its expertise, solutions, training, and technologies with only NATO countries.
Opportunity: Increasing demand from homeland security agencies
Terrorists are targeting civilians and public assets using IEDs and restricting them is a major challenge for homeland security forces and agencies. Hence, homeland security is one of the major end users of counter-IED. Countries such as India, U.K., France, Turkey, Iran, and others are facing immense threat from IED blast. Homeland security agencies of these countries are increasingly procuring advance IED detection and countermeasure equipment�s. Similarly, U.S. Joint Improvised-Threat Defeat Organization trains homeland security personnel�s and assist them in handling and procurement of counter-IED. The demand for IED from the homeland security segment is increasing and is especially from terrorism affected countries, such as India, Israel and others. For instance, India is continuously investing in counter-IED technologies and procuring MRAP vehicles with counter-IED capabilities for its state forces who are dealing with IED attacks in terrorist affected regions.
Challenge: Developing robust IED countermeasures
Constant up gradation of systems is a major challenge for the companies involved in the counter-IED market. Continuous research & development and investment in diverse technologies are required to counter IEDs. For instance, U.S. in its MRAP program is continuously upgrading its vehicles with updated software and advanced counter-IED solutions. This also includes, enhancing armour protection of vehicles, adding new IED detection technologies, equipping soldiers with IED protection gears and others. Companies such as Chemring Group (U.K.), Israel Aerospace Industries (Israel) and others are involved in development of IED detection and countermeasure technologies due to continuous evolvement of IEDs.
Scope of the report
|
Report Metric |
Details |
|
Base year considered |
2016 |
|
Forecast period |
2017-2022 |
|
Forecast units |
Value (USD) |
|
Segments covered |
By End user, Deployment, Capability, and Region |
|
Geographies covered |
North America, Asia Pacific, Europe, Middle East & Africa, Rest of the World |
|
Companies covered |
Lockheed Martin Corporation (US), Raytheon Company (US), Northrop Grumman Corporation (US), Thales Group (France), General Dynamics Corporation (US), Elbit Systems Ltd (Israel), Harris Corporation (US), Chemring Group (UK), L3 Technologies Inc. (US), Allen-Vanguard Corporation (Canada), Netline Communications Technologies (Israel), Sierra Nevada Corporation (US), SRC, Inc (US). |
The research report categorizes the counter-IED market to forecast the revenues and analyze the trends in each of the following sub-segments:
Counter-IED Market, by End User
- Military
- Homeland Security
Counter-IED Market, by Deployment
- Vehicle Mounted
- Armored Vehicles
- Non-combatant Vehicles
- Unmanned Ground Vehicles (UGVs)
- Ship Mounted
- Naval Vessels
- Unmanned Maritime Vehicles (UMVs)
- Airborne Mounted
- Aircraft Platforms
- Aerostats
- Unmanned Aerial Vehicles (UAVs)
- Handheld
- Others
Counter-IED Market, by Capability
- Detection
- ADS-Above-surface Detection System
- MIDS-underground Mine and IED Detection System
- Stand-off IED Detectors
- Remote IED Inspection Equipment
- Countermeasures
- Jammers
- Neutralization
- Neutralizing Improvised Explosive Devices (NIED)
- Explosive Ordnance Disposal (EOD)
Counter-IED Market, by Region
- North America
- US
- Canada
- Europe
- Russia
- France
- Germany
- UK
- Rest of Europe
- Asia Pacific
- China
- India
- Japan
- Australia
- Rest of Asia Pacific
- Middle East & Africa
- Saudi Arabia
- Turkey
- Israel
- Rest of Middle East
- Rest of the World
Key Market Players
Lockheed Martin Corporation (US), Raytheon Company (US), Northrop Grumman Corporation (US), Thales Group (France), General Dynamics Corporation (US), Elbit Systems Ltd (Israel), Harris Corporation (US), Chemring Group (UK), L3 Technologies Inc. (US), Allen-Vanguard Corporation (Canada), Netline Communications Technologies (Israel), Sierra Nevada Corporation (US), SRC, Inc (US).Lockheed Martin Corporation (US) is one of the leading players in the counter-IED market. In the counter-IED market, the company is known for its jammer, namely, Symphony Block 40 and its other variants. Lockheed Martin offers products and services that cater to the defense, civil, and commercial applications. In 2016, Lockheed Martin received a contract from the US partner nations to provide Symphony Block 40 to them.
Recent Developments
- In 2016, Lockheed Martin Corporation received a contract from the US partner nations to provide Symphony Block 40 to them.
- In 2015, Allen-Vanguard received a contract from NATO for its urbanization project.
- In 2013, Allen-Vanguard received a contract from NSWC-Indian Head to develop and deliver Explosive Ordnance Disposal/ Improvised Explosive Device Defeat and provide diving and instructor training to the Azerbaijan Navy EOD Unit (AZE Unit).
- In 2013, Netline Communications Technologies received a contract from NATO to supply C-Guard reactive IED jammers and Hawk AI mobile phone interception systems to armies of NATO.
Critical questions the report answers:
- Where will all these developments take the industry in the long term?
- What are the upcoming trends for the counter-IED market?
- Which segment provides the most opportunity for growth?
- Who are the leading vendors operating in this market?
- What are the opportunities for new market entrants?
 Exclusive indicates content/data unique to MarketsandMarkets and not available with any competitors.
Table of Contents
1 Introduction (Page No. - 18)
1.1 Objectives of the Study
1.2 Market Definition
1.3 Study Scope
1.3.1 Markets Covered
1.3.2 Regional Scope
1.3.3 Years Considered for the Study
1.4 Currency & Pricing
1.5 Limitations
1.6 Market Stakeholders
2 Research Methodology (Page No. - 22)
2.1 Research Data
2.1.1 Secondary Data
2.1.1.1 Key Data From Secondary Sources
2.1.2 Primary Data
2.1.2.1 Key Data From Primary Sources
2.1.2.2 Key Industry Insights
2.1.2.3 Breakdown of Primaries
2.2 Factor Analysis
2.2.1 Introduction
2.2.2 Demand-Side Analysis
2.2.2.1 Requirement of Advanced Countermeasure Systems
2.2.2.2 Threats From Ground-Based IEDs
2.2.3 Supply-Side Analysis
2.2.3.1 Technological Advancements in Counter-IED
2.3 Market Size Estimation
2.3.1 Bottom-Up Approach
2.3.2 Top-Down Approach
2.4 Data Triangulation
3 Executive Summary (Page No. - 33)
4 Premium Insights (Page No. - 36)
4.1 Attractive Opportunities in the Counter-IED Market, 2017-2022
4.2 Counter-IED Market Size, By End User
4.3 Counter-IED Market Size, By Deployment
4.4 Counter-IED Market Size, By Capability
4.5 Detection Segment, By Subsegment
4.6 Counter-IED Market, By Region
5 Market Overview (Page No. - 39)
5.1 Introduction
5.2 Market Segmentation
5.2.1 By End User
5.2.2 By Capability
5.2.3 By Deployment
5.3 Market Dynamics
5.3.1 Drivers
5.3.1.1 Asymmetric Warfare Leading to Increase in IED Blast
5.3.1.2 Increasing Terrorist Activities Worldwide
5.3.1.3 Technological Advancement in IED Detection Systems
5.3.1.4 Increasing Focus on Counter IED Developments
5.3.2 Restraints
5.3.2.1 High Research and Development Cost
5.3.2.2 Protectionist Policies Leading to Limited Access to Counter-IED Technologies
5.3.3 Opportunities
5.3.3.1 Demand From Emerging Countries
5.3.3.2 Increasing Demand From Homeland Security Agencies
5.3.4 Challenges
5.3.4.1 Developing Robust IED Countermeasures
6 Industry Trend (Page No. - 45)
6.1 Introduction: Understanding Improvised Explosive Device
6.2 Counter-Improvised Explosive Device (C-IED)
6.3 Technology Requirements (Capability Enhancement)
6.4 Technological Trends
6.4.1 IED Detection Using Ultra-Wideband Radar (UWB)
6.4.2 Miniature Reactive Jammer (MRJ)
6.4.3 Ion Mobility Spectrometry (IMS)
6.4.4 High Power Electromagnetic (HPEM)
6.4.5 Tactical Signal Emulator System
6.5 Innovation & Patent Registrations
7 Counter-IED Market, By End User (Page No. - 51)
7.1 Introduction
7.2 Military
7.3 Homeland Security
8 Counter-IED Market, By Deployment (Page No. - 55)
8.1 Introduction
8.2 Vehicle Mounted
8.2.1 Armored Vehicles
8.2.1.1 Non-Combatant Vehicles
8.2.2 Unmanned Ground Vehicles
8.3 Ship Mounted
8.3.1 Naval Vessels
8.3.2 Unmanned Maritime Vehicles (UMV)
8.4 Airborne Mounted
8.4.1 Aircraft
8.4.2 Aerostat
8.4.3 Unmanned Aerial Vehicle (UAV)
8.5 Handheld
8.6 Others
9 Counter-IED Market, By Capability (Page No. - 63)
9.1 Introduction
9.2 Detection
9.2.1 Ads-Above-Surface Detection System
9.2.2 Mids-Underground Mine and IED Detection System
9.2.3 Stand-Off IED Detector
9.2.4 Remote IED Detection Equipment
9.3 Countermeasure
9.3.1 Jammers
9.3.2 Neutralization
9.3.2.1 Neutralizing Improvised Explosive Devices (NIED)
9.3.2.2 Explosive Ordnance Disposal (EOD)
10 Regional Analysis (Page No. - 69)
10.1 Introduction
10.2 North America
10.2.1 Counter-IED, By End User
10.2.2 Counter-IED, By Deployment
10.2.2.1 Vehicle-Mounted Segment, By Subsegment
10.2.2.2 Ship-Mounted Segment, By Subsegment
10.2.2.3 Airborne-Mounted Segment, By Subsegment
10.2.3 Counter-IED, By Capability
10.2.3.1 Detection Segment, By Subsegment
10.2.3.2 Countermeasure Segment, By Subsegment
10.2.4 By Country
10.2.4.1 US
10.2.4.1.1 Counter-IED, By End User
10.2.4.1.2 Counter-IED, By Deployment
10.2.4.2 Canada
10.2.4.2.1 Counter-IED, By End User
10.2.4.2.2 Counter-IED, By Deployment
10.3 Europe
10.3.1 Counter-IED, By End User
10.3.2 Counter-IED, By Deployment
10.3.2.1 Vehicle-Mounted Segment, By Subsegment
10.3.2.2 Ship-Mounted Segment, By Subsegment
10.3.2.3 Airborne-Mounted Segment, By Subsegment
10.3.3 Counter-IED, By Capability
10.3.3.1 Detection Segment, By Subsegment
10.3.3.2 Countermeasure Segment, By Subsegment
10.3.4 By Country
10.3.4.1 Russia
10.3.4.1.1 Counter-IED, By End User
10.3.4.1.2 Counter-IED, By Deployment
10.3.4.2 Germany
10.3.4.2.1 Counter-IED, By End User
10.3.4.2.2 Counter-IED, By Deployment
10.3.4.3 UK
10.3.4.3.1 Counter-IED, By End User
10.3.4.3.2 Counter-IED, By Deployment
10.3.4.4 France
10.3.4.4.1 Counter-IED, By End User
10.3.4.4.2 Counter-IED, By Deployment
10.3.4.5 Rest of Europe
10.3.4.5.1 Counter-IED, By End User
10.3.4.5.2 Counter-IED, By Deployment
10.4 Asia Pacific
10.4.1 Counter-IED, By End User
10.4.2 Counter-IED, By Deployment
10.4.2.1 Vehicle-Mounted Segment, By Subsegment
10.4.2.2 Ship-Mounted Segment, By Subsegment
10.4.2.3 Airborne-Mounted Segment, By Subsegment
10.4.3 Counter-IED, By Capability
10.4.3.1 Detection Segment, By Subsegment
10.4.3.2 Counter-IED, By Countermeasure
10.4.4 By Country
10.4.4.1 China
10.4.4.1.1 Counter-IED, By End User
10.4.4.1.2 Counter-IED, By Deployment
10.4.4.2 India
10.4.4.2.1 Counter-IED, By End User
10.4.4.2.2 Counter-IED, By Deployment
10.4.4.3 Australia
10.4.4.3.1 Counter-IED, By End User
10.4.4.3.2 Counter-IED, By Deployment
10.4.4.4 Japan
10.4.4.4.1 Counter-IED, By End User
10.4.4.4.2 Counter-IED, By Deployment
10.4.4.5 Rest of Asia Pacific
10.4.4.5.1 Counter-IED, By End User
10.4.4.5.2 Counter-IED, By Deployment
10.5 Middle East & Africa
10.5.1 Counter-IED, By End User
10.5.2 Counter-IED, By Deployment
10.5.2.1 Vehicle-Mounted Segment, By Subsegment
10.5.2.2 Ship-Mounted Segment, By Subsegment
10.5.2.3 Airborne-Mounted Segment, By Subsegment
10.5.3 Counter-IED Market, By Capability
10.5.3.1 Detection Segment, By Subsegment
10.5.3.2 Countermeasure Segment, By Subsegment
10.5.4 By Country
10.5.4.1 Israel
10.5.4.1.1 Counter-IED, By End User
10.5.4.1.2 Counter-IED, By Deployment
10.5.4.2 Turkey
10.5.4.2.1 Counter-IED, By End User
10.5.4.2.2 Counter-IED, By Deployment
10.5.4.3 Saudi Arabia
10.5.4.3.1 Counter-IED, By End User
10.5.4.3.2 Counter-IED, By Deployment
10.5.4.4 Rest of Middle East & Africa
10.5.4.4.1 Counter-IED, By End User
10.5.4.4.2 Counter-IED, By Deployment
10.6 Rest of the World (RoW)
10.6.1 Counter-IED, By End User
10.6.2 Counter-IED, By Deployment
10.6.2.1 Vehicle-Mounted Segment, By Subsegment
10.6.2.2 Ship-Mounted Segment, By Subsegment
10.6.2.3 Airborne-Mounted Segment, By Subsegment
10.6.3 Counter-IED, By Capability
10.6.3.1 Detection Segment, By Subsegment
10.6.3.2 Countermeasure Segment, By Subsegment
11 Competitive Landscape (Page No. - 110)
11.1 Introduction
11.2 Competitive Leadership Mapping
11.2.1 Visionary Leaders
11.2.2 Innovators
11.2.3 Dynamic Differentiators
11.2.4 Emerging Companies
11.3 Business Strategy Excellence
11.3.1 Business Strategies Adopted By Major Players in the Market
11.4 Strength of Product Portfolio
11.4.1 Product Portfolio Adopted By Major Players in the Market
12 Company Profiles (Page No. - 114)
(Overview, Strength of Product Portfolio, Business Strategy Excellence, Products Offering, Recent Development�s, Business Strategy)*
12.1 General Dynamics Corporation
12.2 Lockheed Martin Corporation
12.3 Elbit Systems Ltd.
12.4 Raytheon Company
12.5 Chemring Group
12.6 Thales Group
12.7 L3 Technologies, Inc.
12.8 Harris Corporation
12.9 Northrop Grumman Corporation
12.10 Allen-Vanguard Corporation
12.11 Netline Communications Technologies
12.12 Sierra Nevada Corporation
12.13 SRC, Inc.
*Details on Overview, Strength of Product Portfolio Business Strategy Excellence Products Offering, Recent Development�s, Business Strategy Might Not Be Captured in Case of Unlisted Companies.
13 Appendix (Page No. - 143)
13.1 Discussion Guide
13.2 Knowledge Store: Marketsandmarkets� Subscription Portal
13.3 Introducing RT: Real-Time Market Intelligence
13.4 Available Customization
13.5 Related Reports
13.6 Author Details
List of Tables (97 Tables)
Table 1 Delivery Mechanism
Table 2 Jido Lines of Operation
Table 3 Important Innovation & Patent Registrations, 2008-2016
Table 4 Counter-IED Size, By End User, 2015-2022 (USD Million)
Table 5 Military Segment, By Region, 2015-2022 (USD Million)
Table 6 Homeland Security Segment, By Region, 2015-2022 (USD Million)
Table 7 Counter-IED Market Size, By Deployment, 2015-2022 (USD Million)
Table 8 Vehicle Mounted Segment, By Region, 2015-2022 (USD Million)
Table 9 Vehicle Mounted Segment, By Subsegment, 2015-2022 (USD Million)
Table 10 Ship Mounted Segment, By Region, 2015-2022 (USD Million)
Table 11 Ship Mounted Segment, By Subsegment, 2015-2022 (USD Million)
Table 12 Airborne Mounted Segment, By Region, 2015-2022 (USD Million)
Table 13 Airborne Mounted Segment, By Subsegment, 2015-2022 (USD Million)
Table 14 Handheld Segment, By Region, 2015-2022 (USD Million)
Table 15 Others Segment, By Region, 2015-2022 (USD Million)
Table 16 Counter-IED Market Size, By Capability, 2015-2022 (USD Million)
Table 17 Detection Segment, By Region, 2015-2022 (USD Million)
Table 18 Detection Segment, By Subsegment, 2015-2022 (USD Million)
Table 19 Countermeasure Segment, By Region, 2015-2022 (USD Million)
Table 20 Countermeasure Segment, By Subsegment, 2015-2022 (USD Million)
Table 21 Counter-IED Size, By Region, 2015�2022 (USD Million)
Table 22 North America Counter-IED Size, By End User, 2015�2022 (USD Million)
Table 23 North America: Counter-IED Size, By Deployment, 2015�2022 (USD Million)
Table 24 North America: Vehicle-Mounted Segment, By Subsegment, 2015�2022 (USD Million)
Table 25 North America: Ship-Mounted Segment, By Subsegment, 2015�2022 (USD Million)
Table 26 North America: Airborne-Mounted Segment, By Subsegment, 2015�2022 (USD Million)
Table 27 North America: Counter-IED Size, By Capability, 2015�2022 (USD Million)
Table 28 North America: Detection Segment, By Subsegment, 2015�2022 (USD Million)
Table 29 North America: Countermeasure Segment, By Subsegment, 2015�2022 (USD Million)
Table 30 North America: Counter-IED Size, By Country, 2015�2022 (USD Million)
Table 31 US: Counter-IED Size, By End User, 2015�2022 (USD Million)
Table 32 US: Counter-IED Size, By Deployment, 2015�2022 (USD Million)
Table 33 Canada: Counter-IED Size, By End User, 2015�2022 (USD Million)
Table 34 Canada: Counter-IED Size, By Deployment, 2015�2022 (USD Million)
Table 35 Europe: Counter-IED Size, By End User, 2015�2022 (USD Million)
Table 36 Europe: Counter-IED Size, By Deployment, 2015�2022 (USD Million)
Table 37 Europe: Vehicle-Mounted Segment, By Subsegment, 2015�2022 (USD Million)
Table 38 Europe: Ship-Mounted Segment, By Subsegment, 2015�2022 (USD Million)
Table 39 Europe: Airborne-Mounted Segment, By Subsegment, 2015�2022 (USD Million)
Table 40 Europe: Counter-IED Size, By Capability, 2015�2022 (USD Million)
Table 41 Europe: Detection Segment, By Subsegment, 2015�2022 (USD Million)
Table 42 Europe: Countermeasure Segment, By Subsegment, 2015�2022 (USD Million)
Table 43 Europe: Counter-IED Size, By Country, 2015�2022 (USD Million)
Table 44 Russia: Counter-IED Size, By End User, 2015�2022 (USD Million)
Table 45 Russia: Counter-IED Size, By Deployment, 2015�2022 (USD Million)
Table 46 Germany: Counter-IED Size, By End User, 2015�2022 (USD Million)
Table 47 Germany: Counter-IED Size, By Deployment, 2015�2022 (USD Million)
Table 48 UK: Counter-IED Size, By End User, 2015�2022 (USD Million)
Table 49 UK: Counter-IED Size, By Deployment, 2015�2022 (USD Million)
Table 50 France: Counter-IED Size, By End User, 2015�2022 (USD Million)
Table 51 France: Counter-IED Size, By Deployment, 2015�2022 (USD Million)
Table 52 Rest of Europe: Counter-IED Size, By End User, 2015�2022 (USD Million)
Table 53 Rest of Europe: Counter-IED Size, By Deployment, 2015�2022 (USD Million)
Table 54 Asia Pacific: Counter-IED Size, By End User, 2015�2022 (USD Million)
Table 55 Asia Pacific: Counter-IED Size, By Deployment, 2015�2022 (USD Million)
Table 56 Asia Pacific: Vehicle-Mounted Segment, By Subsegment, 2015�2022 (USD Million)
Table 57 Asia Pacific: Ship-Mounted Segment, By Subsegment, 2015�2022 (USD Million)
Table 58 Asia Pacific: Airborne-Mounted Segment, By Subsegment, 2015�2022 (USD Million)
Table 59 Asia Pacific: Counter-IED Size, By Capability, 2015�2022 (USD Million)
Table 60 Asia Pacific: Counter-IED Size, By Detection, 2015�2022 (USD Million)
Table 61 Asia Pacific: Counter-IED Size, By Countermeasure, 2015�2022 (USD Million)
Table 62 Asia Pacific Counter-IED Size, By Country, 2015�2022 (USD Million)
Table 63 China: Counter-IED Size, By End User, 2015�2022 (USD Million)
Table 64 China: Counter-IED Size, By Deployment, 2015�2022 (USD Million)
Table 65 India: Counter-IED Size, By End User, 2015�2022 (USD Million)
Table 66 India: Counter-IED Size, By Deployment, 2015�2022 (USD Million)
Table 67 Australia: Counter-IED Size, By End User, 2015�2022 (USD Million)
Table 68 Australia: Counter-IED Size, By Deployment, 2015�2022 (USD Million)
Table 69 Japan: Counter-IED Size, By End User, 2015�2022 (USD Million)
Table 70 Japan: Counter-IED Size, By Deployment, 2015�2022 (USD Million)
Table 71 Rest of Asia Pacific: Counter-IED Size, By End User, 2015�2022 (USD Million)
Table 72 Rest of Asia Pacific: Counter-IED Size, By Deployment, 2015�2022 (USD Million)
Table 73 Middle East & Africa: Counter-IED Size, By End User, 2015�2022 (USD Million)
Table 74 Middle East & Africa: Counter-IED Size, By Deployment, 2015�2022 (USD Million)
Table 75 Middle East & Africa: Vehicle-Mounted Segment, By Subsegment, 2015�2022 (USD Million)
Table 76 Middle East & Africa: Ship-Mounted Segment, By Subsegment, 2015�2022 (USD Million)
Table 77 Middle East & Africa: Airborne-Mounted Segment, By Subsegment, 2015�2022 (USD Million)
Table 78 Middle East & Africa: Counter-IED Market Size, By Capability, 2015�2022 (USD Million)
Table 79 Middle East & Africa: Counter-IED Size, By Detection, 2015�2022 (USD Million)
Table 80 Middle East & Africa: Counter-IED Size, By Countermeasure, 2015�2022 (USD Million)
Table 81 Middle East & Africa: Counter-IED Size, By Country, 2015�2022 (USD Million)
Table 82 Israel: Counter-IED Size, By End User, 2015�2022 (USD Million)
Table 83 Israel: Counter-IED Size, By Deployment, 2015�2022 (USD Million)
Table 84 Turkey: Counter-IED Size, By End User, 2015�2022 (USD Million)
Table 85 Turkey: Counter-IED Size, By Deployment, 2015�2022 (USD Million)
Table 86 Saudi Arabia: Counter-IED Size, By End User, 2015�2022 (USD Million)
Table 87 Saudi Arabia: Counter-IED Size, By Deployment, 2015�2022 (USD Million)
Table 88 Rest of Middle East & Africa: Counter-IED Size, By End User, 2015�2022 (USD Million)
Table 89 Rest of Middle East & Africa: Counter-IED Size, By Deployment, 2015�2022 (USD Million)
Table 90 Rest of the World Counter-IED Size, By End User, 2015�2022 (USD Million)
Table 91 Rest of the World: Counter-IED Size, By Deployment, 2015�2022 (USD Million)
Table 92 Rest of the World: Vehicle-Mounted Segment, By Subsegment, 2015�2022 (USD Million)
Table 93 Rest of the World: Ship-Mounted Segment, By Subsegment, 2015�2022 (USD Million)
Table 94 Rest of the World: Airborne-Mounted Segment, By Subsegment, 2015�2022 (USD Million)
Table 95 Rest of the World: Counter-IED Market Size, By Capability, 2015�2022 (USD Million)
Table 96 Rest of the World: Detection Segment, By Subsegment, 2015�2022 (USD Million)
Table 97 Rest of the World: Counter-IED Market Size, By Countermeasure, 2015�2022 (USD Million)
List of Figures (74 Figures)
Figure 1 Counter-IED Market Segmentation
Figure 2 Counter IED Market: Regional Scope
Figure 3 Counter-IED Market: Research Flow
Figure 4 Counter-IED Market: Research Design
Figure 5 Breakdown of Primary Interviews:
Figure 6 Bottom-Up Approach
Figure 7 Top-Down Approach
Figure 8 Data Triangulation
Figure 9 Assumptions of the Research Study
Figure 10 The Military Segment Lead the Counter-IED Market in 2017
Figure 11 North America is Projected to Be the Largest Market for Counter-IED Market By 2022
Figure 12 The Countermeasure Segment is Projected to Grow at the Highest CAGR During the Forecast Period
Figure 13 The U.S. is Projected to Lead the Counter-IED Market During the Forecast Period
Figure 14 Long-Term Contracts and New Product Launches Were Key Growth Strategies Adopted By the Major Players From 2014 to 2016
Figure 15 Huge Investments By Asia-Pacific Countries to Procure Counter-IED Drive the Counter-IED Market
Figure 16 Military Segment Projected to Grow at A Higher CAGR During the Forecast Period
Figure 17 Vehicle Mounted Segment to Lead the Counter-IED Market During the Forecast Period
Figure 18 The Countermeasure Segment Projected to Grow at A Higher CAGR During the Forecast Period
Figure 19 The Remote IED Inspection Equipment Subsegment is Projected to Grow at the Highest CAGR During the Forecast Period
Figure 20 North America Estimated to Account for the Largest Share of the Counter-IED Market in 2017
Figure 21 Counter-IED Market Segmentation: By End User
Figure 22 Counter-IEDs Market Segmentation: By Capability
Figure 23 Counter-IED Market Segmentation: By Deployment
Figure 24 Counter-IED Market: Drivers, Restraints, Opportunities, and Challenges
Figure 25 The Military Segment is Projected to Grow at the Highest CAGR During the Forecast Period
Figure 26 Airborne-Mounted Segment is Projected to Grow at the Highest CAGR During the Forecast Period
Figure 27 Unmanned Ground Vehicle (UGV) Segment is Projected to Grow at the Highest CAGR During the Forecast Period
Figure 28 Unmanned Maritime Vehicles (UMV) Segment is Projected to Grow at the Highest CAGR During the Forecast Period
Figure 29 Unmanned Aerial Vehicles (UAV) Segment is Projected to Grow at the Highest CAGR During the Forecast Period
Figure 30 Countermeasure Segment is Projected to Grow at the Highest CAGR During the Forecast Period
Figure 31 Remote IED Inspection Equipment Subsegment is Projected to Grow at the Highest CAGR During the Forecast Period
Figure 32 Neutralization Subsegment is Projected to Grow at the Highest CAGR During the Forecast Period
Figure 33 Regional Snapshot
Figure 34 North America Counter-IED Market Snapshot
Figure 35 Europe Counter-IED Market Snapshot
Figure 36 Asia-Pacific Counter-IED Market Snapshot
Figure 37 Middle East Counter-IED Market Snapshot
Figure 38 Counter-IED Market :Competitive Leadership Mapping, 2017
Figure 39 General Dynamics Corporation: Company Snapshot
Figure 40 General Dynamics Corporation: Strength of Product Portfolio Scorecard
Figure 41 General Dynamics Corporation: Business Strategy Excellence Scorecard
Figure 42 Lockheed Martin Corporation: Company Snapshot
Figure 43 Lockheed Martin Corporation: Strength of Product Portfolio Scorecard
Figure 44 Lockheed Martin Corporation: Business Strategy Excellence Scorecard
Figure 45 Elbit Systems Ltd.: Company Snapshot
Figure 46 Elbit Systems Ltd.: Strength of Product Portfolio Scorecard
Figure 47 Elbit Systems Ltd.: Business Strategy Excellence Scorecard
Figure 48 Raytheon Company: Company Snapshot
Figure 49 Raytheon Company: Product Offerings Scorecard
Figure 50 Raytheon Company: Business Strategy Excellence Scorecard
Figure 51 Chemring Group: Company Snapshot
Figure 52 Chemring Group: Strength of Product Portfolio Scorecard
Figure 53 Chemring Group: Business Strategy Excellence Scorecard
Figure 54 Thales Group: Company Snapshot
Figure 55 Thales Group: Strength of Product Portfolio Scorecard
Figure 56 Thales Group: Business Strategy Excellence Scorecard
Figure 57 L3 Technologies, Inc.: Company Snapshot
Figure 58 L3 Technologies, Inc.: Strength of Product Portfolio Scorecard
Figure 59 L3 Technologies, Inc.: Business Strategy Excellence Scorecard
Figure 60 Harris Corporation: Company Snapshot
Figure 61 Harris Corporation: Strength of Product Portfolio Scorecard
Figure 62 Harris Corporation: Business Strategy Excellence Scorecard
Figure 63 Northrop Grumman Corporation: Company Snapshot
Figure 64 Northrop Grumman Corporation: Strength of Product Portfolio Scorecard
Figure 65 Northrop Grumman Corporation: Business Strategy Excellence Scorecard
Figure 66 Allen-Vanguard: Strength of Product Portfolio Scorecard
Figure 67 Allen-Vanguard: Business Strategy Excellence Scorecard
Figure 68 Netline Communications Technologies: Strength of Product Portfolio Scorecard
Figure 69 Netline Communications Technologies: Business Strategy Excellence Scorecard
Figure 70 Sierra Nevada Corporation: Strength of Product Portfolio Scorecard
Figure 71 Sierra Nevada Corporation: Business Strategy Excellence Scorecard
Figure 72 SRC, Inc.: Strength of Product Portfolio Scorecard
Figure 73 SRC, Inc.: Business Strategy Excellence Scorecard
Figure 74 Counter-IED Market Segmentation


Growth opportunities and latent adjacency in Counter-IED Market
I am the owner of a security consulting and training firm based in the U.S. and one of the courses we offer is IED Response Lane Training for Law Enforcement and government entities. I would like to find out how I can get into the network as a service provider in order to expand our reach to other countries to teach this course or how I can get in touch with someone that can help.Our Counter IED Training Aid provider is Inert Products LLC.