Milk Replacers Market by Type (Medicated, and Non-Medicated), Livestock (Ruminants, and Swine), Source (Milk-based, Non milk-based, and Blended), Form (Powdered, and Liquid), and Region - Global Forecast to 2022


[151 pages report]The global milk replacers market is estimated to be valued at USD 2.45 billion in 2017; this market is projected to reach USD 3.54 billion by 2022, at a CAGR of 7.59%.
The periodization considered for the study are as follows:
|
Report Metric |
Details |
|
Base year considered |
2016 |
|
Beginning of projection period |
2017 |
|
End of the projection period |
2022 |
Objectives of the report
- To define, segment, and measure the market in both quantitative and qualitative terms
- To provide an analysis of opportunities in the market for stakeholders through the identification of high-growth segments
- To strategically analyze the micromarkets with respect to individual growth trends, future prospects, and contribution to the total market
- To understand the industry trends of the market along with a value chain and supply chain analysis
- To provide a strategic profiling of key players in the milk replacers market and a comprehensive analysis of their core competencies
- To analyze the strategies of key players and developments, such as new product launches & product approvals, mergers & acquisitions and strategic alliances, agreements and collaborations, and investments & expansions
Research Methodology:
- Major regions were identified along with countries contributing to the maximum share.
- Secondary research was conducted to obtain the value of the milk replacers market for regions such as North America, Europe, Asia Pacific, and RoW.
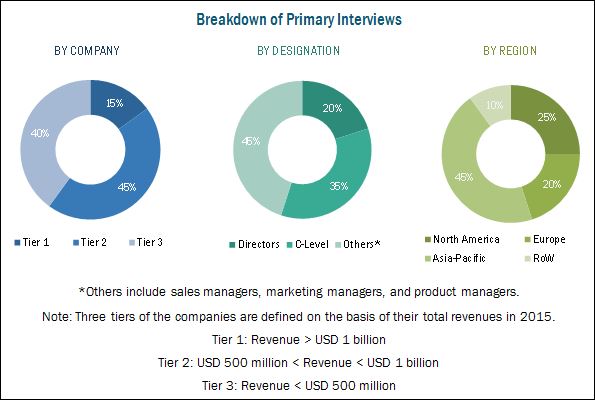
- The key players were identified through secondary sources such as Bloomberg, Businessweek, Factiva, agricultural magazines and the annual reports of the companies, while their market share in the respective regions was determined through both, primary and secondary research. The research methodology includes the study of annual and financial reports of top market players as well as interviews with industry experts (such as CEOs, VPs, directors, and marketing executives) for key insights (both quantitative and qualitative) for the market.
To know about the assumptions considered for the study, download the pdf brochure
The contributors involved in the value chain of the milk replacers market include raw material suppliers, R&D institutes, milk replacers manufacturing companies such as Cargill (U.S.), Archer Daniels Midland Company (U.S.), CHS Inc. (U.S.), Land O� Lakes (U.S.), and Lactalis Group (France), Glanbia, Plc (Ireland), VanDrie Group (Netherlands), FrieslandCampina (Netherlands), Nutreco N.V. (Netherlands), and Alltech (U.S.).
Target Audience
The stakeholders for the report are as follows:
- Milk replacers and other animal feed importers/exporters
- Milk replacers and other animal feed manufacturers/suppliers
- End consumers (animal rearers)
- Intermediary suppliers
- Wholesalers
- Traders
- Research institutes and organizations
- Regulatory bodies
�The study answers several questions for stakeholders, primarily which market segments to focus on in the next two to five years for prioritizing efforts and investments.�
Scope of the report
On the basis of type, the milk replacers market has been segmented as follows:
- Medicated
- Non-medicated
On the basis of livestock, the market has been segmented as follows:
- Ruminants
- Swine
- Others (equine and pets)
On the basis of source, the market has been segmented as follows:
- Milk-based
- Non-milk-based
- Blended
On the basis of form, the market has been segmented as follows
- Powder
- Liquid
On the basis of region, the market has been segmented as follows
- North America
- Europe
- Asia-Pacific
- Rest of the World (RoW)
Available Customizations on Milk Replacers Market
With the given market data, MarketsandMarkets offers customizations according to the company�s specific scientific needs.
The following customization options are available for the report:
Product Analysis
- Product matrix, which gives a detailed comparison of the product portfolio of each company
Geographic Analysis
- Further breakdown of the Rest of Asia-Pacific milk replacers market into Australia and New Zealand.
- Further breakdown of the Rest of Europe milk replacers market into Netherlands, Russia, and Italy.
- Further breakdown of milk replacers market of other countries of the RoW region into South America, Africa, and the Middle East
Company Information
- Detailed analyses and profiling of additional market players (up to five)
The global market is driven by the rise in milk prices, increase in awareness of cost-benefits and nutritional aspects of milk replacer products, adoption of precision nutrition techniques, concerns regarding mortality and health-related aspects, and rise in nutritional mismatches in the initial birth stage of livestock offspring.
Based on type, the market is segmented into medicated and non-medicated. The non-medicated segment accounted for the largest share in the market. The larger demand for non-medicated replacers has been attributed to its low prices. The medicated milk replacers segment is projected to be the faster-growing during the forecast period. Due to this, their demand in developing countries such as Brazil, India, and China is increasing as livestock bearers are very cost-conscious and the dairy farming industry is being increasingly organized.
Based on livestock, the milk replacers market is segmented as ruminants, swine, and others. Ruminants are estimated to form the largest segment during the forecast period. Raising healthy calves is one of the major requirements for livestock in general and ruminants in particular, given their use for dairy and meat production. Calves are born with only the abomasum, that is, the fourth stomach functioning, owing to which the digestion in calves is entirely dependent on the enzymes existing in the abomasum. Hence, infant ruminants are fed with high-quality milk replacers, which help fulfill the nutritional needs of young calves and boost their immunity against diseases.
Based on source, the market is segmented as milk-based, non-milk-based, and blended. Milk-based replacers formed the largest segment among the sources. Milk-based replacers are most commonly used to feed livestock offspring, as their digestive systems are adapted to function on milk, and thus, these replacers are ideal alternatives for whole milk to provide essential nutrition to baby mammals. These replacers are mostly used in developed countries, including the U.S., Germany, and Spain, primarily due to high awareness about the benefits of milk-based replacers.
Based on form, the market is segmented into powder and liquid. The powder of milk replacers formed the largest segment. Powdered milk replacers are cost-effective alternatives to whole milk feed for infant mammals. They are a mixture of ingredients such as whey and sodium caseinate. Powders are easy to handle and store, which are some of the main reasons for their increased demand among animal rearers. Due to the growing demand for ingredients of milk replacers, the overall prices of milk replacers have been increasing since 2006.
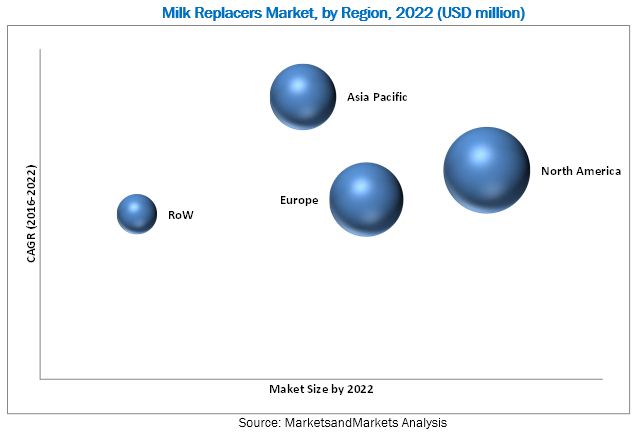
The Asia Pacific region is projected to witness the fastest growth in the global market. Progressive urbanization in Asia-Pacific and an increase in demand for quality animal products result in farmers focusing on the inclusion of nutritional ingredients in the diet of young livestock in order to ensure ideal productivity growth. Given the nutritional benefits of milk replacers, along with their cost benefits as supplements, the demand for milk replacers in this region is witnessing an upward trend.
Furthermore, the increasing acceptance and resultant demand by the dairy farming industry has an impact on the milk replacers market in this region, and it hence leads to the scope for development in the coming years.
The inclusion of antibiotics remains a matter of concern and is one of the major challenges faced by the milk replacers market. Antibiotics are added to some milk replacer products, mainly because producers usually rear their own livestock on-farm, and new diseases can be introduced through bought-in animals. Regular use of antibiotics increases the risk of cull calves being sold for slaughter with detectable levels of antibiotic residues in their carcasses. The EU banned the use of antibiotics in 2006; however, in the U.S., antibiotics are commonly added to milk replacers in an attempt to protect calves from infection.
Key players such as include Cargill (US), Archer Daniel Midland (US), CHS Inc. (US), Land O�Lakes Inc. (US), and Glanbia Plc (Ireland) have a strong presence in the Americas, followed by the Asia-Pacific region. These companies are focusing on strategizing their growth plans to expand their operations in this market.
To speak to our analyst for a discussion on the above findings, click Speak to Analyst
 Exclusive indicates content/data unique to MarketsandMarkets and not available with any competitors.
Table of Contents
1 Introduction (Page No. - 14)
1.1 Objectives of the Study
1.2 Market Definition
1.3 Study Scope
1.4 Periodization Considered for the Study
1.5 Currency
1.6 Units
1.7 Stakeholders
2 Research Methodology (Page No. - 17)
2.1 Introduction
2.2 Research Data
2.2.1 Secondary Data
2.2.2 Primary Data
2.2.2.1 Key Industry Insights
2.2.2.2 Breakdown of Primaries
2.3 Macroeconomic Indicators
2.3.1 Prices of Raw Materials
2.3.2 Trends in Milk Prices
2.3.3 Growth in Target Livestock Population Due to Improved Fertility Rates
2.3.4 Rise in Expenditure in Livestock Farms
2.4 Market Size Estimation
2.5 Market Breakdown & Data Triangulation
2.6 Research Assumptions
2.6.1 Assumptions
2.6.2 Limitations
3 Executive Summary (Page No. - 28)
4 Premium Insights (Page No. - 35)
4.1 Attractive Opportunities in this Market
4.2 Milk Replacers Market, By Key Region/Country, 2016
4.3 Developed vs Emerging Markets for Milk Replacers, 2017 vs 2022
4.4 Milk Replacers Market, By Type & Region, 2016
4.5 Europe: Milk Replacers Market, By Country & Source, 2016
4.6 North America: Milk Replacers Market, By Form, 2017�2022
5 Market Overview (Page No. - 40)
5.1 Introduction
5.2 Market Dynamics
5.2.1 Drivers
5.2.1.1 Extensive R&D to Drive Sustainable Development
5.2.1.2 Increasing Awareness Regarding Product Potential
5.2.1.3 Rising Milk Consumption
5.2.1.4 Adoption of Precision Nutrition Technique
5.2.2 Restraints
5.2.2.1 High Input Costs of Milk Replacer Proteins
5.2.2.2 Usage of Waste Or Trans-Species Milk as Alternatives
5.2.3 Opportunities
5.2.3.1 Promotion of Veal Consumption in the EU
5.2.3.2 Increasing Demand From Emerging Markets
5.2.4 Challenges
5.2.4.1 Inclusion of Antibiotics Remains A Matter of Concern
5.2.4.2 Environmental and Health Concerns
5.3 Standards for Quality Milk Replacers
5.3.1 Bamn Guidelines for Dry Powder
5.3.2 Bamn Guidelines for Reconstituted Liquid
5.4 Value Chain Analysis
5.5 Supply Chain
5.6 Animal Feed: Parent Market Trade Analysis
6 Milk Replacers Market, By Type (Page No. - 52)
6.1 Introduction
6.2 Medicated
6.3 Non-Medicated
7 Milk Replacers Market, By Livestock (Page No. - 56)
7.1 Introduction
7.2 Ruminants
7.3 Swine
7.4 Others
8 Milk Replacers Market, By Source (Page No. - 62)
8.1 Introduction
8.2 Milk-Based
8.3 Non-Milk Based
8.4 Blended
9 Milk Replacers Market, By Form (Page No. - 66)
9.1 Introduction
9.2 Powder
9.3 Liquid
10 Milk Replacers Market, By Region (Page No. - 69)
10.1 Introduction
10.2 North America
10.2.1 U.S.
10.2.2 Canada
10.2.3 Mexico
10.3 Europe
10.3.1 U.K.
10.3.2 Germany
10.3.3 France
10.3.4 Poland
10.3.5 Rest of Europe
10.4 Asia-Pacific
10.4.1 China
10.4.2 India
10.4.3 Japan
10.4.4 Rest of Asia-Pacific
10.5 Rest of the World
10.5.1 Africa
10.5.2 Middle East
10.5.3 South America
11 Competitive Landscape (Page No. - 98)
11.1 Introduction
11.2 Vendor Dive Analysis
11.2.1 Vanguards
11.2.2 Innovator
11.2.3 Dynamic
11.2.4 Emerging
11.3 CompetiTVe Benchmarking
11.3.1 Product Offering (For All 25 Players)
11.3.2 Business Strategy (For All 25 Players)
12 Company Profiles (Page No. - 102)
(Company at A Glance, Recent Financials, Products & Services, Strategies & Insights, & Recent Developments)*
12.1 Introduction
12.2 Cargill
12.3 Archer Daniels Midland Company
12.4 CHS Inc.
12.5 Land O'lakes, Inc.
12.6 Glanbia, PLC
12.7 Lactalis Group
12.8 Vandrie Group
12.9 Frieslandcampina
12.10 Nutreco N.V.
12.11 Alltech
12.12 Nukamel B.V.
12.13 Bewital Agri GmbH & Company Kg
*Details on Company at A Glance, Recent Financials, Products & Services, Strategies & Insights, & Recent Developments Might Not Be Captured in Case of Unlisted Companies.
13 Appendix (Page No. - 144)
13.1 Insights of Industry Experts
13.2 Discussion Guide
13.3 Knowledge Store: Marketsandmarkets� Subscription Portal
13.4 Introducing RT: Real-Time Market Intelligence
13.5 Available Customizations
13.6 Related Reports
List of Tables (73 Tables)
Table 1 SROC Research Facility Test Results, 2013
Table 2 Chemical Composition (%) and Energy Content of Milk for Different Ruminant Species
Table 3 Consumption of Meat and Milk in Developing and Developed Countries, 1980�2030
Table 4 Animal Feed Trade Data, By Largest Exporter, 2011�2015 (USD Million)
Table 5 Animal Feed Trade Data, By Largest Importer, 2011�2015 (USD Million)
Table 6 Milk Replacers Market Size, By Type, 2015-2022 (USD Million)
Table 7 Market Size, By Type, 2015-2022 (KT)
Table 8 Medicated: By Market Size, By Region, 2015-2022 (USD Million)
Table 9 Non-Medicated: By Market Size, By Region, 2015�2022 (USD Million)
Table 10 Milk Replacers Market Size, By Livestock, 2015�2022 (USD Million)
Table 11 Market Size, By Livestock, 2015�2022 (KT)
Table 12 Ruminants: By Market Size, By Livestock Type, 2015�2022 (USD Million)
Table 13 Ruminants: Market Size, By Region, 2015�2022 (USD Million)
Table 14 Swine: By Market Size, By Region, 2015�2022 (USD Million)
Table 15 Other Milk Replacers Market Size, By Region, 2015�2022 (USD Million)
Table 16 By Market Size, By Source, 2015�2022 (USD Million)
Table 17 Market Size, By Source, 2015�2022 (KT)
Table 18 Milk-Based Milk Replacers Market Size, By Region, 2015�2022 (USD Million)
Table 19 Non Milk-Based Milk Replacers Market Size, By Region, 2015�2022 (USD Million)
Table 20 Blended Milk Replacers Market Size, By Region, 2015�2022 (USD Million)
Table 21 Milk Replacers Market Size, By Form, 2015�2022 (USD Million)
Table 22 Market Size, By Form, 2015�2022 (KT)
Table 23 Powdered Milk Replacers Market Size, By Region, 2015�2022 (USD Million)
Table 24 Liquid Milk Replacers Market Size, By Region, 2015�2022 (USD Million)
Table 25 Milk Replacers Market Size, By Region, 2015�2022 (USD Million)
Table 26 Market Size, By Region, 2015�2022 (KT)
Table 27 North America:By Market Size, By Country, 2015�2022 (USD Million)
Table 28 North America: Market Size, By Country, 2015�2022 (KT)
Table 29 North America: Market for Milk Replacers Size, By Type, 2015�2022 (USD Million)
Table 30 North America: Market Size, By Type, 2015�2022 (KT)
Table 31 North America: Market Size, By Livestock, 2015�2022 (USD Million)
Table 32 North America: Market Size, By Livestock, 2015�2022 (KT)
Table 33 North America: Market Size, By Source, 2015�2022 (USD Million)
Table 34 North America: Market Size, By Form, 2015�2022 (USD Million)
Table 35 U.S.: Milk Replacers Market Size, By Livestock, 2015�2022 (USD Million)
Table 36 Canada: Market for Milk Replacers Size, By Livestock, 2015�2022 (USD Million)
Table 37 Mexico: Market Size, By Livestock, 2015�2022 (USD Million)
Table 38 Europe: By Market Size, By Country, 2015�2022 (USD Million)
Table 39 Europe: Market Size, By Country, 2015�2022 (KT)
Table 40 Europe: Milk Replacers Market Size, By Type, 2015�2022 (USD Million)
Table 41 Europe: Market Size, By Type, 2015�2022 (KT)
Table 42 Europe: Market Size, By Livestock, 2015�2022 (USD Million)
Table 43 Europe: Market Size, By Livestock, 2015�2022 (KT)
Table 44 Europe: Market Size, By Source, 2015�2022 (USD Million)
Table 45 Europe: Market Size, By Form, 2015�2022 (USD Million)
Table 46 U.K.: Milk Replacers Market Size, By Livestock, 2015�2022 (USD Million)
Table 47 Germany: Market Size, By Livestock, 2015�2022 (USD Million)
Table 48 France: Market for Milk Replacers Size, By Livestock, 2015�2022 (USD Million)
Table 49 Poland: Market Size, By Livestock, 2015�2022 (USD Million)
Table 50 Rest of Europe: By Market Size, By Livestock, 2015�2022 (USD Million)
Table 51 Asia-Pacific: Milk Replacers Market Size, By Country, 2015�2022 (USD Million)
Table 52 Asia-Pacific: Market Size, By Country, 2015�2022 (KT)
Table 53 Asia-Pacific: Market Size, By Type, 2015�2022 (USD Million)
Table 54 Asia-Pacific: Market Size, By Type, 2015�2022 (KT)
Table 55 Asia-Pacific: Market Size, By Livestock, 2015�2022 (USD Million)
Table 56 Asia-Pacific: Market Size, By Livestock, 2015�2022 (KT)
Table 57 Asia-Pacific: Market Size, By Source, 2015�2022 (USD Million)
Table 58 Asia-Pacific: Market Size, By Form, 2015�2022 (USD Million)
Table 59 China: Milk Replacers Market Size, By Livestock, 2015�2022 (USD Million)
Table 60 India: Market Size, By Livestock, 2015�2022 (USD Million)
Table 61 Japan: Market Size, By Livestock, 2015�2022 (USD Million)
Table 62 Rest of Asia-Pacific: Milk Replacers Market Size, By Livestock, 2015�2022 (USD Million)
Table 63 Rest of the World: By Market Size, By Region, 2015�2022 (USD Million)
Table 64 Rest of the World: Market Size, By Region, 2015�2022 (KT)
Table 65 Rest of the World: Market Size, By Type, 2015�2022 (USD Million)
Table 66 Rest of the World: Market Size, By Type, 2015�2022 (KT)
Table 67 Rest of the World: Market Size, By Livestock, 2015�2022 (USD Million)
Table 68 Rest of the World: Market Size, By Livestock, 2015�2022 (KT)
Table 69 Rest of the World: Market Size, By Source, 2015�2022 (USD Million)
Table 70 Rest of the World: Market Size, By Form, 2015�2022 (USD Million)
Table 71 Africa: Milk Replacers Market Size, By Livestock, 2015�2022 (USD Million)
Table 72 Middle East: Market Size, By Livestock, 2015�2022 (USD Million)
Table 73 South America: Milk Replacers Market Size, By Livestock, 2015�2022 (USD Million)
List of Figures (70 Figures)
Figure 1 Market Segmentation
Figure 2 Milk Replacers Market: Research Design
Figure 3 Breakdown of Primaries By Company, Designation, and Region
Figure 4 Trend in Major Feed Input Prices in the U.S. (2012�2016)
Figure 5 Milk Price Trend in the U.S. (1995�2014)
Figure 6 Growth in Livestock Population, 2010 vs 2014 (Million)
Figure 7 Growth in Livestock Farm Expenditure in the U.S., 2006 vs 2015 (USD Billion)
Figure 8 Increase in Expenditure on Animal Feed in the U.S., 2011 vs 2015 (USD Billion)
Figure 9 Market Size Estimation Methodology: Bottom-Up Approach
Figure 10 Market Size Estimation Methodology: Top-Down Approach
Figure 11 Data Triangulation Methodology
Figure 12 Milk Replacers Market Size, 2017�2022 (USD Million)
Figure 13 Market for Milk Replacers Size, By Source, 2017 vs 2022 (USD Million)
Figure 14 Market Size, By Type, 2017 vs 2022 (USD Million)
Figure 15 Market Size, By Form, 2017 vs 2022 (USD Million)
Figure 16 Market Size, By Livestock, 2017 vs 2022 (USD Million)
Figure 17Market Size, By Region (2016)
Figure 18 Milk Replacers: an Emerging Market With Promising Growth Potential, 2017�2022
Figure 19 U.S. Accounted for the Largest Share in the Market in 2016
Figure 20 Emerging Markets are Projected to Be the Most Attractive Markets for Milk Replacers Through 2022
Figure 21 Europe Accounted for the Largest Share in the Medicated Segment in 2016
Figure 22 Germany Accounted for the Largest Share in the European Milk Replacers Market in 2016
Figure 23 Powder is Projected to Be the Larger Segment Through 2022
Figure 24 Market for Milk Replacers: Drivers, Restraints, Opportunities, and Challenges
Figure 25 Global Per Capita Consumption of Milk, 1996-2024
Figure 26 Market by Milk Replacers: Value Chain
Figure 27 Market for Milk Replacers: Supply Chain
Figure 28 Medicated Segment is Projected to Be the Fastest-Growing Segment of the Milk Replacers Market From 2017 to 2022 (USD Million)
Figure 29 Ruminants is Projected to Be the Fastest-Growing Segment in Terms of Value Between 2017 & 2022
Figure 30 Ruminants: Milk Replacers Market Size, By Region, 2017 vs 2022 (USD Million)
Figure 31 Geographic Snapshot (2017�2022): India is Projected to Grow at the Highest Rate and is Emerging as A New Hotspot
Figure 32 Europe: Milk Replacers Market Snapshot
Figure 33 Asia-Pacific: Milk Replacers Market Snapshot
Figure 34 Dive Chart
Figure 35 Cargill: Company Snapshot
Figure 36 Cargill: Product Offering Scorecard
Figure 37 Cargill: Business Strategy Scorecard
Figure 38 Cargill: SWOT Analysis
Figure 39 Archer Daniels Midland Company: Company Snapshot
Figure 40 Archer Daniels Midland Company: Product Offering Scorecard
Figure 41 Archer Daniels Midland Company: Business Strategy Scorecard
Figure 42 Archer Daniels Midland Company: SWOT Analysis
Figure 43 CHS Inc.: Company Snapshot
Figure 44 CHS Inc.: Product Offering Scorecard
Figure 45 CHS Inc.: Business Strategy Scorecard
Figure 46 CHS Inc. : SWOT Analysis
Figure 47 Land O'lakes, Inc.: Company Snapshot
Figure 48 Land O'lakes, Inc.: Product Offering Scorecard
Figure 49 Land O'lakes, Inc.: Business Strategy Scorecard
Figure 50 Land O'lakes, Inc.: SWOT Analysis
Figure 51 Glanbia, PLC: Company Snapshot
Figure 52 Glanbia, PLC: Product Offering Scorecard
Figure 53 Glanbia, PLC: Business Strategy Scorecard
Figure 54 Glanbia, PLC: SWOT Analysis
Figure 55 Lactalis Group: Product Offering Scorecard
Figure 56 Lactalis Group: Business Strategy Scorecard
Figure 57 Vandrie Group: Product Offering Scorecard
Figure 58 Vandrie Group: Business Strategy Scorecard
Figure 59 Frieslandcampina: Company Snapshot
Figure 60 Frieslandcampina: Product Offering Scorecard
Figure 61 Frieslandcampina: Business Strategy Scorecard
Figure 62 Nutreco N.V.: Company Snapshot
Figure 63 Nutreco N.V.: Product Offering Scorecard
Figure 64 Nutreco N.V.: Business Strategy Scorecard
Figure 65 Alltech: Product Offering Scorecard
Figure 66 Alltech: Business Strategy Scorecard
Figure 67 Nukamel B.V.: Product Offering Scorecard
Figure 68 Nukamel B.V.: Business Strategy Scorecard
Figure 69 Bewital Agri GmbH & Company Kg: Product Offering Scorecard
Figure 70 Bewital Agri GmbH & Company Kg: Business Strategy Scorecard


Growth opportunities and latent adjacency in Milk Replacers Market