Military Wearables Market

Military Wearables Market by End User (Army, Navy, Air Force), Wearable Type (Headwear, Eyewear, Wristwear, Hearables and Bodywear), Technology (Vision and Surveillance, Exoskeleton, Smart Textiles, Others), and Region- Global Forecast to 2027

Report Code: AS 7107 Jul, 2022, by marketsandmarkets.com

Military wearables are smart electronic devices and equipment incorporated into a soldier’s clothing or worn on the body as implants or accessories. The Military Wearables Market size is projected to grow from USD 3.1 Billion in 2022 to USD 3.4 Billion by 2027, at a CAGR of 1.8% from 2022 to 2027.

Armed forces from various nations around the world have been working to empower their soldiers with innovative technologies like advanced head mounted displays, body diagnostics sensors, advanced personal clothing, improved navigation & communication devices, and other types of military wearables in an effort to increase the level of protection for their soldiers.
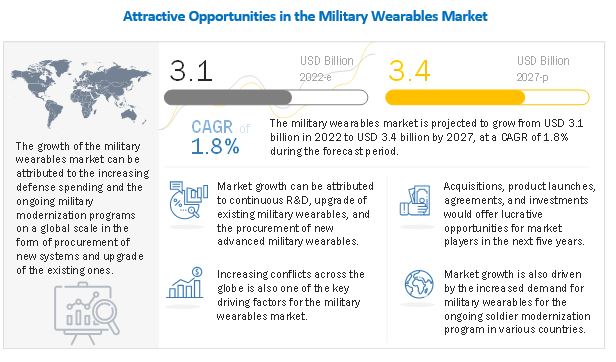
Military Wearables Market

To know about the assumptions considered for the study, download the pdf brochure

Simulators Market Dynamics:

Driver: Boosting the development of advanced and lightweight wearable systems

New and advanced military wearables have been developed to improve the combat capabilities of the soldiers because of advancements in networked soldier technology and future soldier clothing. As the geopolitical divergence among nations increases, soldiers are being upgraded to achieve tactical superiority, which has increased the use of advanced weaponry technology to assure their protection from threats.

Mature markets such as Asia Pacific, Europe & North America are seeing a gradual revival in demand for military wearables due to initiatives by governments top provide advanced wearables. Countries all over the world are investing in soldier modernization programs to provide the highest level of protection for their soldiers and decrease the number of casualties they sustain in order to fight the risk associated by asymmetrical warfare. Advance Protection Modern gadgets, equipment, and electronics are stitched inside soldiers' uniforms to assist military forces drastically lower the number of casualties.

Restraint:In developing nations, traditional military systems are preferred over advanced ones.

Financial instability is becoming more prevalent in emergency economies, which is a significant issue restricting market expansion. Developing nations like South Africa, Sudan, and the Philippines, among others, are forced to purchase more conventional weapons systems rather than investing in advanced military equipment due to high inflation and low GDP. The defence spending and expenditure in these nations have significantly decreased because of growing economic worries. Because of this, the defence ministries of various nations are unable to invest in enhancing the capabilities of their army systems, which is limiting the expansion of the market for military goods.

Opportunity: Enhancing the capabilities of current generation military equipment through the development and integration of advanced technology.

Global manufacturers of military wearables are continually aiming to provide a range of advanced technologies in the areas of communication and intelligence to help soldiers take immediate action and strategically on the battlefield. Companies creating modern military wearables have a strong emphasis on creating integrated modular military wearables to address deficiencies in lethality, mobility, survivability, sustainability and C4I. Defense forces from several nations are working to design and produce materials with ballistic content or even superior properties. When injured soldiers are unable to transmit a message for help, advanced technologies come in useful. In these situations, smart clothing recognises the concerns and delivers the appropriate messages via radio communication devices.

Challenge: Strategic and technological disorganization

Due to the rapidly changing nature of warfare, most nations now lack clarity on their combat requirements. Additionally, there is a discrepancy between the predicted performance of technologies and their availability. This lack of technical preparedness hinders the overall system approach-based projects now in place for upgrading soldiers from moving forward as expected. Furthermore, due to the lack of clarity on the long-term military needs of many nations and the inability of technologies to live up to their anticipated performance standards. Governments in nations like India, South Korea, and Brazil have recognized the difficulties that the pioneers of the soldier modernization programme have encountered and have chosen the incremental approach, which modernizes military wearables in stages, to ensure sustained procurements and prevent prolonged delays in doing so.

Military Wearables Market Ecosystem

Prominent companies and start-ups that provide military wearables and their services, distributors/ suppliers/ retailers, and end customers are the key stakeholders in the military wearables market ecosystem. Investors, funders, academic researchers, distributors, service providers, and industries serve
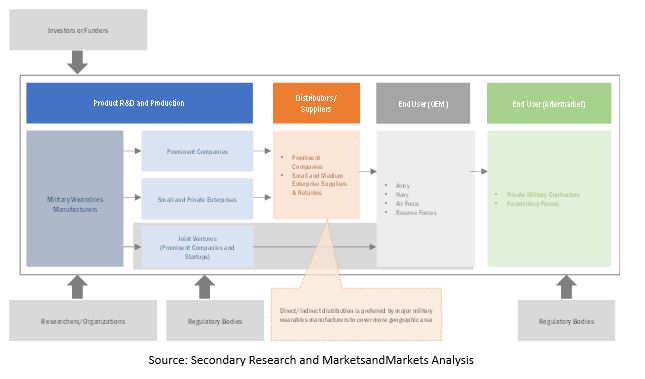
Military Wearables Market by Ecosystem

The land forces segment is estimated to account for the largest share of the military wearables market during the forecast period

Based on end user, the land forces are projected to witness highest market share on account of the current design features of military wearable which augment the augment the capabilities of the land forces as the soldiers are constantly exposed to hazardous working conditions leading to an increased risk of loss of life.

The vision & surveillance segment projected to lead military wearables market during forecast period

Based on technology, the video & surveillance segment is projected to lead the military wearables market during the forecast period. Companies have been undertaking extensive research to develop integrated military wearables with enhanced capabilities to provide soldiers with survivability, sustainability, safety, mobility, command, control, communication, and intelligence. Advancements in the technology for military wearables has helped soldiers combat the tough situations whether it is war or weather. The new generation of night vision goggles is designed to provide improved vision in various environments, including dust, smoke, zero illumination, and subterranean. Thus, thermal cameras and night vision goggles are being widely adopted among soldiers, thereby driving the growth of the vision & surveillance segment of the market.

Headwear segment is expected to account for the largest share in 2022

Based on wearables type, the headwear segment is projected to lead the military wearables market during the forecast period. There is huge demand due to the integration of the headwear with advanced technology (Augmented Reality (AR) & Virtual Reality (VR)) is the driven factor for wearables segment. Modern military wearables include a fire control computer, an integrated camera, and a display for enhanced low-light capability. For instance, Surface Optics Corporation developed a 3D camera technology for multispectral imaging that captures the information required to generate complete multispectral cubes with each focal plane exposure.

Asia Pacific segment is expected to account for the largest share in 2022

Asia Pacific accounted for the largest market share in 2022 due to enhanced adoption driven by threats such as terrorism, cross-border disputes, and sensitive multi-cultural issues. Most countries in the region envision to ensure infantry soldiers have increased lethality, survivability, and mobility while becoming self-contained combat machines. Increased defence expenditure and investments in the modernisation of various law enforcement agencies in these countries are also boosting the growth of the Military Wearables Industry in the region.
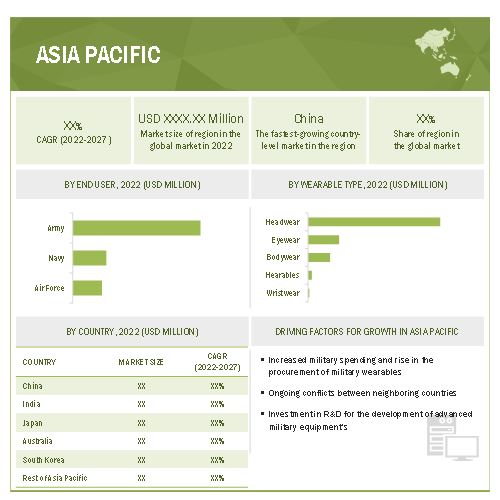
Military Wearables Market by Region

To know about the assumptions considered for the study, download the pdf brochure

Key Market Players

The Military Wearables Companies are dominated by a few globally established players such as BAE Systems PLC (UK), Elbit Systems Ltd. (Israel), Rheinmetall AG(Germany), Thales Group (France), Saab AB (Sweden), Aselsan A.S (Turkey), General Dynamic Corporation (US) are some of the market players.

Want to explore hidden markets that can drive new revenue in Military Wearables Market?

Scope of the Report

Report Metric

Details

Estimated Value
USD 3.1 billion in 2022
Projected Value USD 3.4billion by 2027
Growth Rate CAGR of 1.8%

Market size available for years

2018-2027

Base year considered

2021

Forecast period

2022-2027

Forecast units

Value (USD Million/ Billion)

Segments covered

By End User, Technology, Wearable Type, and By Region

Geographies covered

North America, Asia Pacific, Europe, the Middle East, and Rest of the World

Companies covered

BAE Systems PLC (UK), Elbit Systems Ltd. (Israel), Thales Group (France), Saab AB (Sweden), General Dynamics Corporation (US), Rheinmetall AG (Germany), L3Harris Corporation (US) among others

This research report categorizes the Military Wearables Market based on End User, Technology, Wearable Type and Region

Military Wearables Market, By End User

  • Land Forces
  • Naval Forces
  • Air Forces

Military Wearables Market, By Technology

  • Communication & Computing
  • Network and Connectivity Management
  • Navigation
  • Vision & Surveillance
  • Exoskeleton
  • Monitoring
  • Power and Energy Source
  • Smart Textiles

Military Wearables Market, By Wearable Type

  • Headwear
  • Eyewear
  • Wristwear
  • Hearables
  • Bodywear

Military Wearables Market, By Region

  • North America
  •  Europe
  • Asia Pacific
  • Middle East
  • Rest of the World

Recent Developments

  • In May 2022, Elbit Systems was awarded the contract to provide the DRICM (Direct infrared Countermeasures and EW (Electronic Warfare) systems for Airbus A330-200 MRTT Aircraft of European Air Force.
  • In May 2022, Elbit Systems Ltd of America was awarded the contract to supply Squad Binocular Night Vision Goggles systems to the U. S Marines Corps worth USD 49 million.
  • In May 2022, Thales was awarded with the contract to deliver the advance tactical radio to U. S army under the Combat Net Radio (CNR) Modernization Program. This contract was granted as part of the company's endeavor to replace its single-channel ground and airborne radio system (SINCGARS), which was outdated worth USD 6 Billion.
  • In March 2022, Aselsan A.S. was awarded with the contract that deals with the sale of communication equipment and services for ground platforms used by the Qatari military.

Frequently Asked Questions (FAQs):

To speak to our analyst for a discussion on the above findings, click Speak to Analyst


Exclusive indicates content/data unique to MarketsandMarkets and not available with any competitors.

TABLE OF CONTENTS
 
1 INTRODUCTION (Page No. - 38)
    1.1 STUDY OBJECTIVES
    1.2 MARKET DEFINITION
    1.3 STUDY SCOPE
           1.3.1 MARKETS COVERED
           1.3.2 REGIONAL SCOPE
           1.3.3 YEARS CONSIDERED
    1.4 CURRENCY AND PRICING CONSIDERED
           TABLE 1 USD EXCHANGE RATES
    1.5 INCLUSIONS AND EXCLUSIONS
           TABLE 2 MILITARY WEARABLES MARKET, BY SEGMENT
    1.6 LIMITATIONS
    1.7 STAKEHOLDERS
    1.8 SUMMARY OF CHANGES
           FIGURE 1 OLD VS NEW MARKET ESTIMATES
 
2 RESEARCH METHODOLOGY (Page No. - 44)
    2.1 RESEARCH DATA
           FIGURE 2 RESEARCH PROCESS FLOW
           FIGURE 3 MILITARY WEARABLES MARKET: RESEARCH DESIGN
    2.2 SECONDARY DATA
           2.2.1 SECONDARY SOURCES
    2.3 PRIMARY DATA
           2.3.1 PRIMARY SOURCES
    2.4 DEMAND- AND SUPPLY-SIDE ANALYSIS
           2.4.1 INTRODUCTION
           2.4.2 DEMAND-SIDE INDICATORS
                    2.4.2.1 Widening geopolitical rift leading to tactical evolution
           2.4.3 SUPPLY-SIDE INDICATORS
                    2.4.3.1 Oligopolistic market and supply of raw materials affect availability and pricing
    2.5 RESEARCH APPROACH & METHODOLOGY
           TABLE 3 SEGMENTS AND SUBSEGMENTS
    2.6 MARKET SIZE ESTIMATION
           2.6.1 BOTTOM-UP APPROACH
                    FIGURE 4 MARKET SIZE ESTIMATION: BOTTOM-UP APPROACH (DEMAND-SIDE)
           2.6.2 TOP-DOWN APPROACH
                    FIGURE 5 MARKET SIZE ESTIMATION: TOP-DOWN APPROACH (SUPPLY-SIDE)
           2.6.3 BREAKDOWN OF PRIMARIES
                    FIGURE 6 BREAKDOWN OF PRIMARY INTERVIEWS: BY COMPANY TYPE, DESIGNATION, AND REGION
    2.7 MARKET BREAKDOWN AND DATA TRIANGULATION
           FIGURE 7 DATA TRIANGULATION METHODOLOGY
    2.8 GROWTH RATE ASSUMPTIONS
    2.9 RESEARCH STUDY ASSUMPTIONS
           FIGURE 8 PARAMETRIC ASSUMPTIONS MADE FOR MARKET FORECAST
    2.10 RISKS
 
3 EXECUTIVE SUMMARY (Page No. - 55)
    FIGURE 9 LAND FORCES SEGMENT TO LEAD MILITARY WEARABLES MARKET FROM 2022 TO 2027
    FIGURE 10 MONITORING SEGMENT OF MILITARY WEARABLES MARKET TO GROW AT HIGHEST CAGR FROM 2022 TO 2027
    FIGURE 11 REGIONAL ANALYSIS: MILITARY WEARABLES MARKET
 
4 PREMIUM INSIGHTS (Page No. - 58)
    4.1 ATTRACTIVE OPPORTUNITIES IN MILITARY WEARABLES MARKET
           FIGURE 12 INCREASING MILITARY MODERNIZATION PROGRAMS DRIVING MARKET GROWTH
    4.2 MILITARY WEARABLES MARKET, BY END USER
           FIGURE 13 LAND FORCES SEGMENT TO ACCOUNT FOR LARGEST SHARE OF MARKET IN 2022
    4.3 MILITARY WEARABLES MARKET, BY WEARABLE TYPE
           FIGURE 14 HEADWEAR SEGMENT TO LEAD MARKET FROM 2022 TO 2027
    4.4 COMMUNICATION & COMPUTING SYSTEM MILITARY WEARABLES MARKET, BY PRODUCT
           FIGURE 15 TACTICAL MULTIBAND RADIOS TO LEAD COMMUNICATION & COMPUTING SYSTEM SEGMENT FROM 2022 TO 2027
    4.5 VISION & SURVEILLANCE MILITARY WEARABLES MARKET, BY SYSTEM
           FIGURE 16 IMAGING SEGMENT TO GROW AT HIGHER CAGR DURING FORECAST PERIOD
    4.6 MILITARY WEARABLES MARKET, BY TECHNOLOGY
           FIGURE 17 VISION & SURVEILLANCE SEGMENT TO ACCOUNT FOR LARGEST SHARE OF MARKET IN 2022
    4.7 MILITARY WEARABLES MARKET, BY COUNTRY
           FIGURE 18 CANADA TO WITNESS HIGHEST GROWTH DURING FORECAST PERIOD
 
5 MARKET OVERVIEW (Page No. - 62)
    5.1 INTRODUCTION
    5.2 MARKET DYNAMICS
           FIGURE 19 MILITARY WEARABLES MARKET: MARKET DYNAMICS
           5.2.1 DRIVERS
                    5.2.1.1 Developing lightweight and rugged wearable systems
                               TABLE 4 CAPABILITIES OF MILITARY WEARABLES
                               TABLE 5 SOLDIER MODERNIZATION PROGRAMS, BY COUNTRY/GROUP
                    5.2.1.2 Asymmetric warfare encourages adoption of military wearable technologies
                               FIGURE 20 NUMBER OF CASUALTIES DUE TO TERRORIST ATTACKS WORLDWIDE, 2006–2016
           5.2.2 RESTRAINTS
                    5.2.2.1 Conventional warfare systems preferred over advanced systems in developing countries
                    5.2.2.2 Supply chain disruptions
           5.2.3 OPPORTUNITIES
                    5.2.3.1 Developing and integrating advanced technologies to enhance current generation military wearable capabilities
                               TABLE 6 CAPABILITY DEFICIENCIES OF EXISTING MILITARY WEARABLES
                    5.2.3.2 Integrating nanotechnology into military wearable subsystems
                               TABLE 7 USE OF NANOTECHNOLOGY IN MILITARY WEARABLES
           5.2.4 CHALLENGES
                    5.2.4.1 Lack of strategic clarity and technology readiness
                    5.2.4.2 Reducing weight of military wearables without compromising on protection and combat performance
    5.3 TRENDS/DISRUPTIONS IMPACTING CUSTOMER BUSINESS
           5.3.1 REVENUE SHIFT AND NEW REVENUE POCKETS FOR MILITARY WEARABLES MANUFACTURERS
                    FIGURE 21 REVENUE SHIFT IN MILITARY WEARABLES MARKET
    5.4 PRICING ANALYSIS
           TABLE 8 AVERAGE SELLING PRICE RANGE: MILITARY WEARABLES MARKET (BY TECHNOLOGY)
    5.5 MARKET ECOSYSTEM
           5.5.1 PROMINENT COMPANIES
           5.5.2 PRIVATE AND SMALL ENTERPRISES
           5.5.3 END USERS
                    FIGURE 22 MARKET ECOSYSTEM MAP: MILITARY WEARABLES
                    TABLE 9 MILITARY WEARABLES MARKET ECOSYSTEM
    5.6 VALUE CHAIN ANALYSIS
           FIGURE 23 VALUE CHAIN ANALYSIS: MILITARY WEARABLES MARKET
    5.7 TECHNOLOGY ANALYSIS
           5.7.1 RADIOFREQUENCY
           5.7.2 ADDITIVE MANUFACTURING
    5.8 CASE STUDY ANALYSIS
           5.8.1 SMART CLOTHING
           5.8.2 SITUATION AWARENESS
           5.8.3 TRAINING & SIMULATION
           5.8.4 EXOSKELETON
           5.8.5 WEARABLE BATTERIES & ENERGY HARVESTERS
    5.9 PORTER’S FIVE FORCES MODEL
           TABLE 10 MILITARY WEARABLES MARKET: PORTER’S FIVE FORCES ANALYSIS
           5.9.1 THREAT OF NEW ENTRANTS
           5.9.2 THREAT OF SUBSTITUTES
           5.9.3 BARGAINING POWER OF SUPPLIERS
           5.9.4 BARGAINING POWER OF BUYERS
           5.9.5 COMPETITION IN THE INDUSTRY
    5.10 KEY STAKEHOLDERS AND BUYING CRITERIA
           5.10.1 KEY STAKEHOLDERS IN BUYING PROCESS
                     FIGURE 24 INFLUENCE OF STAKEHOLDERS IN BUYING PROCESS FOR MILITARY WEARABLE TECHNOLOGIES
                     TABLE 11 INFLUENCE OF STAKEHOLDERS IN BUYING PROCESS FOR MILITARY WEARABLE TECHNOLOGIES (%)
           5.10.2 BUYING CRITERIA
                     FIGURE 25 KEY BUYING CRITERIA FOR MILITARY WEARABLES TECHNOLOGIES
                     TABLE 12 KEY BUYING CRITERIA FOR MILITARY WEARABLES TECHNOLOGIES
    5.11 KEY CONFERENCES AND EVENTS IN 2022–2023
           TABLE 13 MILITARY WEARABLES MARKET: DETAILED LIST OF CONFERENCES AND EVENTS
    5.12 TARIFF REGULATORY LANDSCAPE FOR AEROSPACE INDUSTRY
           TABLE 14 NORTH AMERICA: LIST OF REGULATORY BODIES, GOVERNMENT AGENCIES, AND OTHER ORGANIZATIONS
           TABLE 15 EUROPE: LIST OF REGULATORY BODIES, GOVERNMENT AGENCIES, AND OTHER ORGANIZATIONS
           TABLE 16 ASIA PACIFIC: LIST OF REGULATORY BODIES, GOVERNMENT AGENCIES, AND OTHER ORGANIZATIONS
 
6 INDUSTRY TRENDS (Page No. - 82)
    6.1 INTRODUCTION
    6.2 SUPPLY CHAIN ANALYSIS
           FIGURE 26 SUPPLY CHAIN ANALYSIS OF MILITARY WEARABLES MARKET
    6.3 TECHNOLOGY TRENDS
           6.3.1 INDIVIDUAL SITUATIONAL AWARENESS: DELIVERING DECISIONS AT ALL COMMAND LEVELS
           6.3.2 AR AND VR FOR TRAINING AND SIMULATION
           6.3.3 MULTIBAND TACTICAL COMMUNICATION AMPLIFIERS
           6.3.4 MOBILE USER OBJECTIVE SYSTEM: CELL PHONE-LIKE CAPABILITY FOR SOFTWARE-DEFINED RADIOS
           6.3.5 NEAR FIELD COMMUNICATION
           6.3.6 SMART CLOTHING
           6.3.7 MICRO-ELECTROMECHANICAL SYSTEMS AND NANOTECHNOLOGY
           6.3.8 NEXT-GENERATION SENSOR SYSTEMS
           6.3.9 IOT-BASED WEARABLES
           6.3.10 SMART BATTERIES
    6.4 IMPACT OF MEGATRENDS
           6.4.1 IMPLEMENTATION OF INDUSTRY 4.0
           6.4.2 ADVANCEMENTS IN SUPPLY CHAIN FOR MILITARY WEARABLES MANUFACTURING
    6.5 INNOVATIONS AND PATENT REGISTRATIONS
           TABLE 17 INNOVATIONS AND PATENT REGISTRATIONS, 2019–2022
 
7 MILITARY WEARABLES MARKET, BY END USER (Page No. - 89)
    7.1 INTRODUCTION
           FIGURE 27 LAND FORCES SEGMENT TO DOMINATE MILITARY WEARABLES MARKET FROM 2022 TO 2027
           TABLE 18 MILITARY WEARABLES MARKET, BY END USER, 2018–2021 (USD MILLION)
           TABLE 19 MILITARY WEARABLES MARKET, BY END USER, 2022–2027 (USD MILLION)
    7.2 LAND FORCES
           7.2.1 ADOPTION OF WEARABLES TO ENHANCE NIGHT COMBAT AND LOAD-CARRYING CAPABILITIES OF LAND SOLDIERS
    7.3 AIRBORNE FORCES
           7.3.1 AR-BASED HELMETS USAGE BY FIGHTER PILOTS FOR BETTER SITUATIONAL AWARENESS
    7.4 NAVAL FORCES
           7.4.1 HEALTH MONITORING WEARABLE DEVICES USAGE FOR NAVAL FORCES
 
8 MILITARY WEARABLES MARKET, BY TECHNOLOGY (Page No. - 93)
    8.1 INTRODUCTION
           FIGURE 28 VISION & SURVEILLANCE SEGMENT TO LEAD MARKET FROM 2022 TO 2027
           TABLE 20 MILITARY WEARABLES MARKET, BY TECHNOLOGY, 2018–2021 (USD MILLION)
           TABLE 21 MILITARY WEARABLES MARKET, BY TECHNOLOGY, 2022–2027 (USD MILLION)
    8.2 VISION & SURVEILLANCE
           TABLE 22 VISION & SURVEILLANCE TECHNOLOGY MARKET, BY SYSTEM, 2018–2021 (USD MILLION)
           TABLE 23 VISION & SURVEILLANCE TECHNOLOGY MARKET, BY SYSTEM, 2022–2027 (USD MILLION)
           8.2.1 AUGMENTED REALITY & VIRTUAL REALITY
                    TABLE 24 AUGMENTED REALITY & VIRTUAL REALITY MARKET, BY PRODUCT, 2018–2021 (USD MILLION)
                    TABLE 25 AUGMENTED REALITY & VIRTUAL REALITY MARKET, BY PRODUCT, 2022–2027 (USD MILLION)
                    8.2.1.1 Head-mounted displays
                               8.2.1.1.1 Adoption of HMDs with AR in airborne forces
                    8.2.1.2 Smart glasses
                               8.2.1.2.1 Smart glasses integrated with 3D stereoscopic displays, wireless connectivity, and high-performance positional sensors to be explored by defense industry
                    8.2.1.3 Gesture tracking devices
                               8.2.1.3.1 Gesture-controlled robotics drives adoption
                    8.2.1.4 Smart helmets
                               8.2.1.4.1 Smart helmets integrated with low-resolution, high-resolution, and infrared cameras for integrated soldier suit
           8.2.2 IMAGING
                    TABLE 26 IMAGING MARKET, BY PRODUCT, 2018–2021 (USD MILLION)
                    TABLE 27 IMAGING MARKET, BY PRODUCT, 2022–2027 (USD MILLION)
                    8.2.2.1 Night vision goggles
                               8.2.2.1.1 Enhancing night combat capabilities of individual soldiers and integrating NVGs with smart helmets drive growth
                    8.2.2.2 Sights & scopes
                               8.2.2.2.1 Adopting sights & scopes for accurate targeting by combat soldiers
                    8.2.2.3 EO/IR & thermal cameras
                               8.2.2.3.1 EO/IR imaging systems in high demand for target acquisition and situational awareness
    8.3 EXOSKELETON
           TABLE 28 EXOSKELETON TECHNOLOGY MARKET, BY PRODUCT, 2018–2021 (USD MILLION)
           TABLE 29 EXOSKELETON TECHNOLOGY MARKET, BY PRODUCT, 2022–2027 (USD MILLION)
           8.3.1 PASSIVE EXOSKELETONS
                    8.3.1.1 Low cost and powerless operation led to high adoption of passive exoskeletons
           8.3.2 POWERED EXOSKELETONS
                    8.3.2.1 R&D activities to develop advanced battery-powered exoskeletons for land soldiers
    8.4 COMMUNICATION & COMPUTING SYSTEM
           TABLE 30 COMMUNICATION & COMPUTING SYSTEM TECHNOLOGY MARKET, BY PRODUCT, 2018–2021 (USD MILLION)
           TABLE 31 COMMUNICATION & COMPUTING SYSTEM TECHNOLOGY MARKET, BY PRODUCT, 2022–2027 (USD MILLION)
           8.4.1 TACTICAL MULTIBAND RADIOS
                    8.4.1.1 Portable radio programs boost tactical multiband radio growth in North America and Europe
           8.4.2 WEARABLE COMPUTERS
                    8.4.2.1 Electronic devices wired into clothing to track enemy targets increased soldier network with airborne, land, and naval forces
           8.4.3 TACTICAL HEADSETS
                    8.4.3.1 Developing cutting-edge headsets for tactical communication and hearing protection
           8.4.4 EMBEDDED ANTENNAS
                    8.4.4.1 IoT and jam-resistant communication led to adoption of embedded antennas
    8.5 NAVIGATION
           TABLE 32 NAVIGATION TECHNOLOGY MARKET, BY PRODUCT, 2018–2021 (USD MILLION)
           TABLE 33 NAVIGATION TECHNOLOGY MARKET, BY PRODUCT, 2022–2027 (USD MILLION)
           8.5.1 DISMOUNTED IFF
                    8.5.1.1 Adoption of dismounted IFF for special forces
           8.5.2 PERSONNEL RECOVERY DEVICES
                    8.5.2.1 Used by land forces to signal, alert, and notify authorities about well-being of soldiers
           8.5.3 DISMOUNTED POSITIONING, NAVIGATION, AND TIMING
                    8.5.3.1 Replaces GPS receivers and single source of positioning & navigation to support communications, command and control, logistics, and targeting
    8.6 POWER & ENERGY MANAGEMENT
           TABLE 34 POWER & ENERGY MANAGEMENT TECHNOLOGY MARKET, BY PRODUCT, 2018–2021 (USD MILLION)
           TABLE 35 POWER & ENERGY MANAGEMENT TECHNOLOGY MARKET, BY PRODUCT, 2022–2027 (USD MILLION)
           8.6.1 BATTERIES
                    8.6.1.1 Developing fuel cells powered batteries and solar-powered batteries for land soldiers
           8.6.2 ENERGY HARVESTERS
                    8.6.2.1 Requirement of energy harvesters for battery support applications
           8.6.3 WIRELESS CHARGERS
                    TABLE 36 POWER & ENERGY MANAGEMENT TECHNOLOGY MARKET, BY WIRELESS CHARGER, 2018–2021 (USD MILLION)
                    TABLE 37 POWER & ENERGY MANAGEMENT TECHNOLOGY MARKET, BY WIRELESS CHARGER, 2022–2027 (USD MILLION)
                    8.6.3.1 Magnetic resonance technology
                               8.6.3.1.1 Developing magnetic resonance technology for large power requirement wearables
                    8.6.3.2 Inductive technology
                               8.6.3.2.1 Adopting inductive wireless chargers for smart textiles and e-textiles to power wearables
                    8.6.3.3 Capacitive coupling/conductive
                               8.6.3.3.1 R&D in capacitive charging techniques to power devices and batteries
    8.7 SMART TEXTILES
           8.7.1 CAMOUFLAGE
                    8.7.1.1 Bionic adaptive material & thermal and photosensitive fibers in camouflage materials
           8.7.2 ENERGY HARVEST
                    8.7.2.1 Growing need for energy harvesters in various applications
           8.7.3 TEMPERATURE MONITORING & CONTROL
                    8.7.3.1 Real-time monitoring of body heat map of defense personnel to enhance training
           8.7.4 PROTECTION AND MOBILITY
                    8.7.4.1 Advancement in soldier protection equipment & wearables
    8.8 NETWORK & CONNECTIVITY MANAGEMENT
           TABLE 38 NETWORK & CONNECTIVITY MANAGEMENT TECHNOLOGY MARKET, BY PRODUCT, 2018–2021 (USD MILLION)
           TABLE 39 NETWORK & CONNECTIVITY MANAGEMENT TECHNOLOGY MARKET, 2022–2027 (USD MILLION)
           8.8.1 WEARABLE PERSONAL AREA NETWORKS & HUBS
                    8.8.1.1 Effective information sharing among war-fighting platforms by network-enabled capability in wearable PAN
           8.8.2 COMPACT CONNECTORS
                    8.8.2.1 Next-generation integrated connectors offer maximum wearability, modularity, and performance by withstanding severe operating and environmental conditions
           8.8.3 WIRES & CABLES
                    8.8.3.1 High-rate data transmission and rugged design explored in new range of wires & cables
           8.8.4 HEALTH MONITORING AND DIAGNOSTICS
                    8.8.4.1 Adopting biometric sensor integrated wearables
    8.9 MONITORING
           TABLE 40 MONITORING TECHNOLOGY MARKET, BY PRODUCT, 2018–2021 (USD MILLION)
           TABLE 41 MONITORING TECHNOLOGY MARKET, BY PRODUCT, 2022–2027 (USD MILLION)
           8.9.1 SMART BANDS & ACTIVITY TRACKERS
                    8.9.1.1 Adoption of smart bands and smartwatches among land soldiers for activity tracking and health monitoring
           8.9.2 WEARABLE PATCHES
                    8.9.2.1 Wearable patches usage for real-time non-invasive sensing and assessment of a soldier’s physiological condition
           8.9.3 BODY DIAGNOSTIC SENSORS
                    8.9.3.1 Developing wide range of body diagnostic sensors for health monitoring applications
 
9 MILITARY WEARABLES MARKET, BY WEARABLE TYPE (Page No. - 113)
    9.1 INTRODUCTION
           FIGURE 29 HEADWEAR SEGMENT TO LEAD MARKET FROM 2022 TO 2027
           TABLE 42 MILITARY WEARABLES MARKET, BY WEARABLE TYPE, 2018–2021 (USD MILLION)
           TABLE 43 MILITARY WEARABLES MARKET, BY WEARABLE TYPE, 2022–2027 (USD MILLION)
    9.2 HEADWEAR
           9.2.1 INTEGRATING ADVANCED TECHNOLOGIES IN HEADWEAR
    9.3 EYEWEAR
           9.3.1 TECHNOLOGICALLY ADVANCED NIGHT VISION EQUIPMENT TO DRIVE GROWTH
    9.4 BODYWEAR
           9.4.1 ADVANCEMENTS IN EXOSKELETONS, SMART TEXTILES, AND MONITORING SENSORS
    9.5 HEARABLES
           9.5.1 STRENGTHENING ARMY BY USING ADVANCED HEADSETS FOR COMMUNICATION
    9.6 WRISTWEAR
           9.6.1 FITBIT, SMARTWATCHES, AND WEARABLES PATCHES USAGE FOR TRACKING SOLDIER HEALTH
 
10 REGIONAL ANALYSIS (Page No. - 117)
     10.1 INTRODUCTION
             FIGURE 30 ASIA PACIFIC ACCOUNTED FOR LARGEST SHARE OF MILITARY WEARABLES MARKET IN 2022
             TABLE 44 MILITARY WEARABLES MARKET, BY REGION, 2018–2021 (USD MILLION)
             TABLE 45 MILITARY WEARABLES MARKET, BY REGION, 2022–2027 (USD MILLION)
     10.2 NORTH AMERICA
             10.2.1 PESTLE ANALYSIS: NORTH AMERICA
                        FIGURE 31 NORTH AMERICA: MILITARY WEARABLES MARKET SNAPSHOT
                        TABLE 46 NORTH AMERICA: MILITARY WEARABLES MARKET, BY END USER, 2018–2021 (USD MILLION)
                        TABLE 47 NORTH AMERICA: MILITARY WEARABLES MARKET, BY END USER, 2022–2027 (USD MILLION)
                        TABLE 48 NORTH AMERICA: MILITARY WEARABLES MARKET, BY TECHNOLOGY, 2018–2021 (USD MILLION)
                        TABLE 49 NORTH AMERICA: MILITARY WEARABLES MARKET, BY TECHNOLOGY, 2022–2027 (USD MILLION)
                        TABLE 50 NORTH AMERICA: MILITARY WEARABLES MARKET, BY WEARABLE TYPE, 2018–2021 (USD MILLION)
                        TABLE 51 NORTH AMERICA: MILITARY WEARABLES MARKET, BY WEARABLE TYPE, 2022–2027 (USD MILLION)
                        TABLE 52 NORTH AMERICA: MILITARY WEARABLES MARKET, BY COUNTRY, 2018–2021 (USD MILLION)
                        TABLE 53 NORTH AMERICA: MILITARY WEARABLES MARKET, BY COUNTRY, 2022–2027 (USD MILLION)
             10.2.2 US
                        10.2.2.1 MARKET SIZE ESTIMATION: TOP-DOWN APPROACH (SUPPLY-SIDE)
                                     TABLE 54 US: MILITARY WEARABLES MARKET, BY END USER, 2018–2021 (USD MILLION)
                                     TABLE 55 US: MILITARY WEARABLES MARKET, BY END USER, 2022–2027 (USD MILLION)
                                     TABLE 56 US: MILITARY WEARABLES MARKET, BY TECHNOLOGY, 2018–2021 (USD MILLION)
                                     TABLE 57 US: MILITARY WEARABLES MARKET, BY TECHNOLOGY, 2022–2027 (USD MILLION)
             10.2.3 CANADA
                        10.2.3.1 RESEARCH STUDY ASSUMPTIONS
                                     TABLE 58 CANADA: MILITARY WEARABLES MARKET, BY END USER, 2018–2021 (USD MILLION)
                                     TABLE 59 CANADA: MILITARY WEARABLES MARKET, BY END USER, 2022–2027 (USD MILLION)
                                     TABLE 60 CANADA: MILITARY WEARABLES MARKET, BY TECHNOLOGY, 2018–2021 (USD MILLION)
                                     TABLE 61 CANADA: MILITARY WEARABLES MARKET, BY TECHNOLOGY, 2022–2027 (USD MILLION)
     10.3 EUROPE
             10.3.1 PESTLE ANALYSIS: EUROPE
                        FIGURE 32 EUROPE: MILITARY WEARABLES MARKET SNAPSHOT
                        TABLE 62 EUROPE: MILITARY WEARABLES MARKET, BY END USER, 2018–2021 (USD MILLION)
                        TABLE 63 EUROPE: MILITARY WEARABLES MARKET, BY END USER, 2022–2027 (USD MILLION)
                        TABLE 64 EUROPE: MILITARY WEARABLES MARKET, BY TECHNOLOGY, 2018–2021 (USD MILLION)
                        TABLE 65 EUROPE: MILITARY WEARABLES MARKET, BY TECHNOLOGY, 2022–2027 (USD MILLION)
                        TABLE 66 EUROPE: MILITARY WEARABLES MARKET, BY WEARABLE TYPE, 2018–2021 (USD MILLION)
                        TABLE 67 EUROPE: MILITARY WEARABLES MARKET, BY WEARABLE TYPE, 2022–2027 (USD MILLION)
                        TABLE 68 EUROPE: MILITARY WEARABLES MARKET, BY COUNTRY, 2018–2021 (USD MILLION)
                        TABLE 69 EUROPE: MILITARY WEARABLES MARKET, BY COUNTRY, 2022–2027 (USD MILLION)
             10.3.2 UK
                        10.3.2.1 IMAGING SEGMENT TO GROW AT HIGHER CAGR DURING FORECAST PERIOD
                                     TABLE 70 UK: MILITARY WEARABLES MARKET, BY END USER, 2018–2021 (USD MILLION)
                                     TABLE 71 UK: MILITARY WEARABLES MARKET, BY END USER, 2022–2027 (USD MILLION)
                                     TABLE 72 UK: MILITARY WEARABLES MARKET, BY TECHNOLOGY, 2018–2021 (USD MILLION)
                                     TABLE 73 UK: MILITARY WEARABLES MARKET, BY TECHNOLOGY, 2022–2027 (USD MILLION)
             10.3.3 FRANCE
                        10.3.3.1 INTRODUCTION
                                     TABLE 74 FRANCE: MILITARY WEARABLES MARKET, BY END USER, 2018–2021 (USD MILLION)
                                     TABLE 75 FRANCE: MILITARY WEARABLES MARKET, BY END USER, 2022–2027 (USD MILLION)
                                     TABLE 76 FRANCE: MILITARY WEARABLES MARKET, BY TECHNOLOGY, 2018–2021 (USD MILLION)
                                     TABLE 77 FRANCE: MILITARY WEARABLES MARKET, BY TECHNOLOGY, 2022–2027 (USD MILLION)
             10.3.4 GERMANY
                        10.3.4.1 SOLDIER MODERNIZATION PROGRAMS, BY COUNTRY/GROUP
                                     TABLE 78 GERMANY: MILITARY WEARABLES MARKET, BY END USER, 2018–2021 (USD MILLION)
                                     TABLE 79 GERMANY: MILITARY WEARABLES MARKET, BY END USER, 2022–2027 (USD MILLION)
                                     TABLE 80 GERMANY: MILITARY WEARABLES MARKET, BY TECHNOLOGY, 2018–2021 (USD MILLION)
                                     TABLE 81 GERMANY: MILITARY WEARABLES MARKET, BY TECHNOLOGY, 2022–2027 (USD MILLION)
             10.3.5 RUSSIA
                        10.3.5.1 OPPORTUNITIES
                                     TABLE 82 RUSSIA: MILITARY WEARABLES MARKET, BY END USER, 2018–2021 (USD MILLION)
                                     TABLE 83 RUSSIA: MILITARY WEARABLES MARKET, BY END USER, 2022–2027 (USD MILLION)
                                     TABLE 84 RUSSIA: MILITARY WEARABLES MARKET, BY TECHNOLOGY, 2018–2021 (USD MILLION)
                                     TABLE 85 RUSSIA: MILITARY WEARABLES MARKET, BY TECHNOLOGY, 2022–2027 (USD MILLION)
             10.3.6 REST OF EUROPE
                        10.3.6.1 Lack of strategic clarity and technology readiness
                                     TABLE 86 REST OF EUROPE: MILITARY WEARABLES MARKET, BY END USER, 2018–2021 (USD MILLION)
                                     TABLE 87 REST OF EUROPE: MILITARY WEARABLES MARKET, BY END USER, 2022–2027 (USD MILLION)
                                     TABLE 88 REST OF EUROPE: MILITARY WEARABLES MARKET, BY TECHNOLOGY, 2018–2021 (USD MILLION)
                                     TABLE 89 REST OF EUROPE: MILITARY WEARABLES MARKET, BY TECHNOLOGY, 2022–2027 (USD MILLION)
     10.4 ASIA PACIFIC
             10.4.1 PESTLE ANALYSIS: ASIA PACIFIC
                        FIGURE 33 ASIA PACIFIC: MILITARY WEARABLES MARKET SNAPSHOT
                        TABLE 90 ASIA PACIFIC: MILITARY WEARABLES MARKET, BY END USER, 2018–2021 (USD MILLION)
                        TABLE 91 ASIA PACIFIC: MILITARY WEARABLES MARKET, BY END USER, 2022–2027 (USD MILLION)
                        TABLE 92 ASIA PACIFIC: MILITARY WEARABLES MARKET, BY TECHNOLOGY, 2018–2021 (USD MILLION)
                        TABLE 93 ASIA PACIFIC: MILITARY WEARABLES MARKET, BY TECHNOLOGY, 2022–2027 (USD MILLION)
                        TABLE 94 ASIA PACIFIC: MILITARY WEARABLES MARKET, BY WEARABLE TYPE, 2018–2021 (USD MILLION)
                        TABLE 95 ASIA PACIFIC: MILITARY WEARABLES MARKET, BY WEARABLE TYPE, 2022–2027 (USD MILLION)
                        TABLE 96 ASIA PACIFIC: MILITARY WEARABLES MARKET, BY COUNTRY, 2018–2021 (USD MILLION)
                        TABLE 97 ASIA PACIFIC: MILITARY WEARABLES MARKET, BY COUNTRY, 2022–2027 (USD MILLION)
             10.4.2 CHINA
                        10.4.2.1 ADDITIVE MANUFACTURING
                                     TABLE 98 CHINA: MILITARY WEARABLES MARKET, BY END USER, 2018–2021 (USD MILLION)
                                     TABLE 99 CHINA: MILITARY WEARABLES MARKET, BY END USER, 2022–2027 (USD MILLION)
                                     TABLE 100 CHINA: MILITARY WEARABLES MARKET, BY TECHNOLOGY, 2018–2021 (USD MILLION)
                                     TABLE 101 CHINA: MILITARY WEARABLES MARKET, BY TECHNOLOGY, 2022–2027 (USD MILLION)
             10.4.3 INDIA
                        10.4.3.1 WEARABLE BATTERIES & ENERGY HARVESTERS
                                     TABLE 102 INDIA: MILITARY WEARABLES MARKET, BY END USER, 2018–2021 (USD MILLION)
                                     TABLE 103 INDIA: MILITARY WEARABLES MARKET, BY END USER, 2022–2027 (USD MILLION)
                                     TABLE 104 INDIA: MILITARY WEARABLES MARKET, BY TECHNOLOGY, 2018–2021 (USD MILLION)
                                     TABLE 105 INDIA: MILITARY WEARABLES MARKET, BY TECHNOLOGY, 2022–2027 (USD MILLION)
             10.4.4 JAPAN
                        10.4.4.1 BARGAINING POWER OF SUPPLIERS
                                     TABLE 106 JAPAN: MILITARY WEARABLES MARKET, BY END USER, 2018–2021 (USD MILLION)
                                     TABLE 107 JAPAN: MILITARY WEARABLES MARKET, BY END USER, 2022–2027 (USD MILLION)
                                     TABLE 108 JAPAN: MILITARY WEARABLES MARKET, BY TECHNOLOGY, 2018–2021 (USD MILLION)
                                     TABLE 109 JAPAN: MILITARY WEARABLES MARKET, BY TECHNOLOGY, 2022–2027 (USD MILLION)
             10.4.5 SOUTH KOREA
                        10.4.5.1 INFLUENCE OF STAKEHOLDERS IN BUYING PROCESS FOR MILITARY WEARABLE TECHNOLOGIES (%)
                                     TABLE 110 SOUTH KOREA: MILITARY WEARABLES MARKET, BY END USER, 2018–2021 (USD MILLION)
                                     TABLE 111 SOUTH KOREA: MILITARY WEARABLES MARKET, BY END USER, 2022–2027 (USD MILLION)
                                     TABLE 112 SOUTH KOREA: MILITARY WEARABLES MARKET, BY TECHNOLOGY, 2018–2021 (USD MILLION)
                                     TABLE 113 SOUTH KOREA: MILITARY WEARABLES MARKET, BY TECHNOLOGY, 2022–2027 (USD MILLION)
             10.4.6 AUSTRALIA
                        10.4.6.1 TARIFF REGULATORY LANDSCAPE FOR AEROSPACE INDUSTRY
                                     TABLE 114 AUSTRALIA: MILITARY WEARABLES MARKET, BY END USER, 2018–2021 (USD MILLION)
                                     TABLE 115 AUSTRALIA: MILITARY WEARABLES MARKET, BY END USER, 2022–2027 (USD MILLION)
                                     TABLE 116 AUSTRALIA: MILITARY WEARABLES MARKET, BY TECHNOLOGY, 2018–2021 (USD MILLION)
                                     TABLE 117 AUSTRALIA: MILITARY WEARABLES MARKET, BY TECHNOLOGY, 2022–2027 (USD MILLION)
             10.4.7 REST OF ASIA PACIFIC
                        10.4.7.1 SUPPLY CHAIN ANALYSIS
                                     TABLE 118 REST OF ASIA PACIFIC: MILITARY WEARABLES MARKET, BY END USER, 2018–2021 (USD MILLION)
                                     TABLE 119 REST OF ASIA PACIFIC: MILITARY WEARABLES MARKET, BY END USER, 2022–2027 (USD MILLION)
                                     TABLE 120 REST OF ASIA PACIFIC: MILITARY WEARABLES MARKET, BY TECHNOLOGY, 2018–2021 (USD MILLION)
                                     TABLE 121 REST OF ASIA PACIFIC: MILITARY WEARABLES MARKET, BY TECHNOLOGY, 2022–2027 (USD MILLION)
     10.5 MIDDLE EAST
             10.5.1 PESTLE ANALYSIS: MIDDLE EAST
                        FIGURE 34 MIDDLE EAST: MILITARY WEARABLES MARKET SNAPSHOT
                        TABLE 122 MIDDLE EAST: MILITARY WEARABLES MARKET, BY END USER, 2018–2021 (USD MILLION)
                        TABLE 123 MIDDLE EAST: MILITARY WEARABLES MARKET, BY END USER, 2022–2027 (USD MILLION)
                        TABLE 124 MIDDLE EAST: MILITARY WEARABLES MARKET, BY TECHNOLOGY, 2018–2021 (USD MILLION)
                        TABLE 125 MIDDLE EAST: MILITARY WEARABLES MARKET, BY TECHNOLOGY, 2022–2027 (USD MILLION)
                        TABLE 126 MIDDLE EAST: MILITARY WEARABLES MARKET, BY WEARABLE TYPE, 2018–2021 (USD MILLION)
                        TABLE 127 MIDDLE EAST: MILITARY WEARABLES MARKET, BY WEARABLE TYPE, 2022–2027 (USD MILLION)
                        TABLE 128 MIDDLE EAST: MILITARY WEARABLES MARKET, BY COUNTRY, 2018–2021 (USD MILLION)
                        TABLE 129 MIDDLE EAST: MILITARY WEARABLES MARKET, BY COUNTRY, 2022–2027 (USD MILLION)
             10.5.2 SAUDI ARABIA
                        10.5.2.1 INNOVATIONS AND PATENT REGISTRATIONS, 2019–2022
                                     TABLE 130 SAUDI ARABIA: MILITARY WEARABLES MARKET, BY END USER, 2018–2021 (USD MILLION)
                                     TABLE 131 SAUDI ARABIA: MILITARY WEARABLES MARKET, BY END USER, 2022–2027 (USD MILLION)
                                     TABLE 132 SAUDI ARABIA: MILITARY WEARABLES MARKET, BY TECHNOLOGY, 2018–2021 (USD MILLION)
                                     TABLE 133 SAUDI ARABIA: MILITARY WEARABLES MARKET, BY TECHNOLOGY, 2022–2027 (USD MILLION)
             10.5.3 UAE
                        10.5.3.1 LAND FORCES
                                     TABLE 134 UAE: MILITARY WEARABLES MARKET, BY END USER, 2018–2021 (USD MILLION)
                                     TABLE 135 UAE: MILITARY WEARABLES MARKET, BY END USER, 2022–2027 (USD MILLION)
                                     TABLE 136 UAE: MILITARY WEARABLES MARKET, BY TECHNOLOGY, 2018–2021 (USD MILLION)
                                     TABLE 137 UAE: MILITARY WEARABLES MARKET, BY TECHNOLOGY, 2022–2027 (USD MILLION)
             10.5.4 ISRAEL
                        10.5.4.1 MILITARY WEARABLES MARKET, BY TECHNOLOGY
                                     TABLE 138 ISRAEL: MILITARY WEARABLES MARKET, BY END USER, 2018–2021 (USD MILLION)
                                     TABLE 139 ISRAEL: MILITARY WEARABLES MARKET, BY END USER, 2022–2027 (USD MILLION)
                                     TABLE 140 ISRAEL: MILITARY WEARABLES MARKET, BY TECHNOLOGY, 2018–2021 (USD MILLION)
                                     TABLE 141 ISRAEL: MILITARY WEARABLES MARKET, BY TECHNOLOGY, 2022–2027 (USD MILLION)
             10.5.5 TURKEY
                        10.5.5.1 VISION & SURVEILLANCE TECHNOLOGY MARKET, BY SYSTEM, 2018–2021 (USD MILLION)
                                     TABLE 142 TURKEY: MILITARY WEARABLES MARKET, BY END USER, 2018–2021 (USD MILLION)
                                     TABLE 143 TURKEY: MILITARY WEARABLES MARKET, BY END USER, 2022–2027 (USD MILLION)
                                     TABLE 144 TURKEY: MILITARY WEARABLES MARKET, BY TECHNOLOGY, 2018–2021 (USD MILLION)
                                     TABLE 145 TURKEY: MILITARY WEARABLES MARKET, BY TECHNOLOGY, 2022–2027 (USD MILLION)
             10.5.6 REST OF MIDDLE EAST
                        10.5.6.1 Adoption of HMDs with AR in airborne forces
                                     TABLE 146 REST OF MIDDLE EAST: MILITARY WEARABLES MARKET, BY END USER, 2018–2021 (USD MILLION)
                                     TABLE 147 REST OF MIDDLE EAST: MILITARY WEARABLES MARKET, BY END USER, 2022–2027 (USD MILLION)
                                     TABLE 148 REST OF MIDDLE EAST: MILITARY WEARABLES MARKET, BY TECHNOLOGY, 2018–2021 (USD MILLION)
                                     TABLE 149 REST OF MIDDLE EAST: MILITARY WEARABLES MARKET, BY TECHNOLOGY, 2022–2027 (USD MILLION)
     10.6 REST OF THE WORLD
             10.6.1 PESTLE ANALYSIS: REST OF THE WORLD
                        FIGURE 35 REST OF THE WORLD: MILITARY WEARABLES MARKET SNAPSHOT
                        TABLE 150 REST OF THE WORLD: MILITARY WEARABLES MARKET, BY END USER, 2018–2021 (USD MILLION)
                        TABLE 151 REST OF THE WORLD: MILITARY WEARABLES MARKET, BY END USER, 2022–2027 (USD MILLION)
                        TABLE 152 REST OF THE WORLD: MILITARY WEARABLES MARKET, BY TECHNOLOGY, 2018–2021 (USD MILLION)
                        TABLE 153 REST OF THE WORLD: MILITARY WEARABLES MARKET, BY TECHNOLOGY, 2022–2027 (USD MILLION)
                        TABLE 154 REST OF THE WORLD: MILITARY WEARABLES MARKET, BY WEARABLE TYPE, 2018–2021 (USD MILLION)
                        TABLE 155 REST OF THE WORLD: MILITARY WEARABLES MARKET, BY WEARABLE TYPE, 2022–2027 (USD MILLION)
                        TABLE 156 REST OF THE WORLD: MILITARY WEARABLES MARKET, BY COUNTRY, 2018–2021 (USD MILLION)
                        TABLE 157 REST OF THE WORLD: MILITARY WEARABLES MARKET, BY COUNTRY, 2022–2027 (USD MILLION)
             10.6.2 LATIN AMERICA
                        10.6.2.1 EXOSKELETON TECHNOLOGY MARKET, BY PRODUCT, 2018–2021 (USD MILLION)
                                     TABLE 158 LATIN AMERICA: MILITARY WEARABLES MARKET, BY END USER, 2018–2021 (USD MILLION)
                                     TABLE 159 LATIN AMERICA: MILITARY WEARABLES MARKET, BY END USER, 2022–2027 (USD MILLION)
                                     TABLE 160 LATIN AMERICA: MILITARY WEARABLES MARKET, BY TECHNOLOGY, 2018–2021 (USD MILLION)
                                     TABLE 161 LATIN AMERICA: MILITARY WEARABLES MARKET, BY TECHNOLOGY, 2022–2027 (USD MILLION)
             10.6.3 AFRICA
                        10.6.3.1 COMMUNICATION & COMPUTING SYSTEM
                                     TABLE 162 AFRICA: MILITARY WEARABLES MARKET, BY END USER, 2018–2021 (USD MILLION)
                                     TABLE 163 AFRICA: MILITARY WEARABLES MARKET, BY END USER, 2022–2027 (USD MILLION)
                                     TABLE 164 AFRICA: MILITARY WEARABLES MARKET, BY TECHNOLOGY, 2018–2021 (USD MILLION)
                                     TABLE 165 AFRICA: MILITARY WEARABLES MARKET, BY TECHNOLOGY, 2022–2027 (USD MILLION)
 
11 COMPETITIVE LANDSCAPE (Page No. - 177)
     11.1 INTRODUCTION 
     11.2 MARKET SHARE ANALYSIS OF KEY PLAYERS, 2021 
             TABLE 166 MILITARY WEARABLES MARKET: DEGREE OF COMPETITION
             FIGURE 36 MARKET SHARE OF TOP PLAYERS IN MILITARY WEARABLES MARKET, 2021
             TABLE 167 KEY DEVELOPMENTS BY LEADING PLAYERS IN MARKET BETWEEN 2020 AND 2022
     11.3 TOP FIVE PLAYERS RANKING ANALYSIS, 2021 
             FIGURE 37 MARKET RANKING OF LEADING PLAYERS, 2021
     11.4 REVENUE ANALYSIS OF TOP FIVE MARKET PLAYERS, 2021 
             FIGURE 38 REVENUE ANALYSIS FOR KEY COMPANIES IN PAST 5 YEARS
     11.5 COMPANY PRODUCT FOOTPRINT ANALYSIS 
             TABLE 168 COMPANY PRODUCT FOOTPRINT
             TABLE 169 COMPANY SOLUTION TYPE FOOTPRINT
             TABLE 170 COMPANY REGION FOOTPRINT
     11.6 COMPANY EVALUATION QUADRANT 
             11.6.1 STARS
             11.6.2 EMERGING LEADERS
             11.6.3 PERVASIVE PLAYERS
             11.6.4 PARTICIPANTS
                        FIGURE 39 MARKET COMPETITIVE LEADERSHIP MAPPING, 2021
     11.7 STARTUP/SME EVALUATION QUADRANT 
             11.7.1 PROGRESSIVE COMPANIES
             11.7.2 RESPONSIVE COMPANIES
             11.7.3 STARTING BLOCKS
             11.7.4 DYNAMIC COMPANIES
                        TABLE 171 MILITARY WEARABLES MARKET: DETAILED LIST OF KEY STARTUPS/SMES
                        FIGURE 40 MILITARY WEARABLES MARKET (STARTUP) COMPETITIVE LEADERSHIP MAPPING, 2021
     11.8 COMPETITIVE SCENARIO 
             11.8.1 MARKET EVALUATION FRAMEWORK
             11.8.2 PRODUCT LAUNCHES
                        TABLE 172 MILITARY WEARABLES MARKET: PRODUCT LAUNCHES, JUNE 2021–MAY 2022
             11.8.3 DEALS
                        TABLE 173 MILITARY WEARABLES MARKET: DEALS, FEBRUARY 2021–MAY 2022
 
12 COMPANY PROFILES (Page No. - 197)
     12.1 INTRODUCTION 
(Business overview, Products/Solutions/Services offered, Recent Developments, MnM view, Key strengths, Strategic choices, Weaknesses and competitive threats) *  
     12.2 KEY PLAYERS 
             12.2.1 BAE SYSTEMS PLC
                        TABLE 174 BAE SYSTEMS PLC: BUSINESS OVERVIEW
                        FIGURE 41 BAE SYSTEMS PLC: COMPANY SNAPSHOT
                        TABLE 175 BAE SYSTEMS PLC: PRODUCT DEVELOPMENTS
                        TABLE 176 BAE SYSTEMS PLC: DEALS
             12.2.2 ELBIT SYSTEMS LTD
                        TABLE 177 ELBIT SYSTEMS LTD: BUSINESS OVERVIEW
                        FIGURE 42 ELBIT SYSTEMS LTD: COMPANY SNAPSHOT
                        TABLE 178 ELBIT SYSTEMS LTD: DEALS
             12.2.3 RHEINMETALL AG
                        TABLE 179 RHEINMETALL AG: BUSINESS OVERVIEW
                        FIGURE 43 RHEINMETALL AG: COMPANY SNAPSHOT
                        TABLE 180 RHEINMETALL AG: PRODUCT LAUNCHES
                        TABLE 181 RHEINMETALL AG: DEALS
             12.2.4 SAAB AB
                        TABLE 182 SAAB AB: BUSINESS OVERVIEW
                        FIGURE 44 SAAB AB: COMPANY SNAPSHOT
                        TABLE 183 SAAB AB: PRODUCT LAUNCHES
                        TABLE 184 SAAB AB: DEALS
             12.2.5 THALES GROUP
                        TABLE 185 THALES GROUP: BUSINESS OVERVIEW
                        FIGURE 45 THALES GROUP: COMPANY SNAPSHOT
                        TABLE 186 THALES GROUP: DEALS
             12.2.6 ASELSAN A.S.
                        TABLE 187 ASELSAN A.S.: BUSINESS OVERVIEW
                        FIGURE 46 ASELSAN A.S.: COMPANY SNAPSHOT
                        TABLE 188 ASELSAN A.S.: PRODUCT LAUNCHES
                        TABLE 189 ASELSAN A.S.: DEALS
             12.2.7 TELEDYNE FLIR LLC
                        TABLE 190 TELEDYNE FLIR LLC: BUSINESS OVERVIEW
                        FIGURE 47 TELEDYNE FLIR LLC: COMPANY SNAPSHOT
                        TABLE 191 TELEDYNE FLIR LLC: PRODUCT LAUNCHES
                        TABLE 192 TELEDYNE FLIR LLC: DEALS
             12.2.8 GENERAL DYNAMICS CORPORATION
                        TABLE 193 GENERAL DYNAMICS CORPORATION: BUSINESS OVERVIEW
                        FIGURE 48 GENERAL DYNAMICS CORPORATION: COMPANY SNAPSHOT
                        TABLE 194 GENERAL DYNAMICS CORPORATION: DEALS
             12.2.9 BIONIC POWER INC.
                        TABLE 195 BIONIC POWER INC.: BUSINESS OVERVIEW
             12.2.10 L3HARRIS TECHNOLOGIES INC.
                        TABLE 196 L3HARRIS TECHNOLOGIES INC.: BUSINESS OVERVIEW
                        FIGURE 49 L3HARRIS TECHNOLOGIES INC: COMPANY SNAPSHOT
                        TABLE 197 L3HARRIS TECHNOLOGIES INC: DEALS
             12.2.11 LEONARDO S.P.A.
                        TABLE 198 LEONARDO S.P.A.: BUSINESS OVERVIEW
                        FIGURE 50 LEONARDO S.P.A.: COMPANY SNAPSHOT
                        TABLE 199 LEONARDO S.P.A.: DEALS
             12.2.12 LOCKHEED MARTIN CORPORATION
                        TABLE 200 LOCKHEED MARTIN CORPORATION: BUSINESS OVERVIEW
                        FIGURE 51 LOCKHEED MARTIN CORPORATION: COMPANY SNAPSHOT
                        TABLE 201 LOCKHEED MARTIN CORPORATION: DEALS
             12.2.13 NORTHROP GRUMMAN CORPORATION
                        TABLE 202 NORTHROP GRUMMAN CORPORATION: BUSINESS OVERVIEW
                        FIGURE 52 NORTHROP GRUMMAN CORPORATION: COMPANY SNAPSHOT
                        TABLE 203 NORTHROP GRUMMAN CORPORATION: DEALS
             12.2.14 SAFRAN SA
                        TABLE 204 SAFRAN SA: BUSINESS OVERVIEW
                        FIGURE 53 SAFRAN SA: COMPANY SNAPSHOT
                        TABLE 205 SAFRAN SA: DEALS
             12.2.15 ULTRA-ELECTRONICS
                        TABLE 206 ULTRA-ELECTRONICS: BUSINESS OVERVIEW
                        FIGURE 54 ULTRA-ELECTRONICS: COMPANY SNAPSHOT
                        TABLE 207 ULTRA-ELECTRONICS: DEALS
             12.2.16 INTERACTIVE WEAR AG
                        TABLE 208 INTERACTIVE WEAR AG: BUSINESS OVERVIEW
             12.2.17 TT ELECTRONICS PLC
                        TABLE 209 TT ELECTRONICS PLC: BUSINESS OVERVIEW
                        FIGURE 55 TT ELECTRONICS PLC: COMPANY SNAPSHOT
             12.2.18 TE CONNECTIVITY LTD.
                        TABLE 210 TE CONNECTIVITY LTD.: BUSINESS OVERVIEW
                        FIGURE 56 TE CONNECTIVITY LTD.: COMPANY SNAPSHOT
             12.2.19 ST ENGINEERING
                        TABLE 211 ST ENGINEERING: BUSINESS OVERVIEW
                        FIGURE 57 ST ENGINEERING: COMPANY SNAPSHOT
             12.2.20 VIASAT INC.
                        TABLE 212 VIASAT INC.: BUSINESS OVERVIEW
                        FIGURE 58 VIASAT INC.: COMPANY SNAPSHOT
                        TABLE 213 VIASAT INC.: DEALS
     12.3 OTHER PLAYERS 
             12.3.1 GLENAIR INC
                        TABLE 214 GLENAIR INC: COMPANY OVERVIEW
             12.3.2 EPSILOR-ELECTRIC FUEL LTD
                        TABLE 215 EPSILOR ELECTRIC FUEL LTD: COMPANY OVERVIEW
             12.3.3 MILPOWER SOURCE INC
                        TABLE 216 MILPOWER SOURCE INC: COMPANY OVERVIEW
             12.3.4 SAFARILAND L.L.C.
                        TABLE 217 SAFARILAND L.L.C.: COMPANY OVERVIEW
*Details on Business overview, Products/Solutions/Services offered, Recent Developments, MnM view, Key strengths, Strategic choices, Weaknesses and competitive threats might not be captured in case of unlisted companies.  
 
13 APPENDIX (Page No. - 260)
     13.1 DISCUSSION GUIDE 
     13.2 KNOWLEDGESTORE: MARKETSANDMARKETS’ SUBSCRIPTION PORTAL 
     13.3 CUSTOMIZATIONS OFFERED 
     13.4 RELATED REPORTS 
     13.5 AUTHOR DETAILS 
 

The study involved four major activities in estimating the current market size for the military wearables market. Exhaustive secondary research was conducted to collect information on the market, the peer markets, and the parent market. The next step was to validate these findings, assumptions, and sizing with industry experts across the value chain through primary research. Both top-down and bottom-up approaches were employed to estimate the complete market size. Thereafter, market breakdown and data triangulation procedures were used to estimate the market size of segments and subsegments.

Secondary Research

In the secondary research process, various secondary sources, such as D&B Hoovers, Bloomberg, BusinessWeek, and different magazines were referred to identify and collect information for this study. Secondary sources also included annual reports, press releases & investor presentations of companies, certified publications, articles by recognized authors, and simulators databases.

Primary Research

The military wearables market comprises several stakeholders, such as raw material providers, military wearables manufacturers and suppliers, and regulatory organizations in the supply chain. While the demand side of this market is characterized by various end users, the supply side is characterized by technological advancements in military wearables. Various primary sources from both the supply and demand sides of the market were interviewed to obtain qualitative and quantitative information. Following is the breakdown of primary respondents:
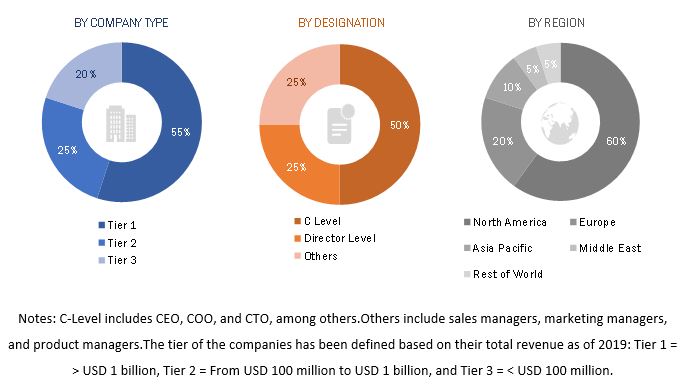
Military Wearables Market Size, and Share

To know about the assumptions considered for the study, download the pdf brochure

Market Size Estimation

Both top-down and bottom-up approaches were used to estimate and validate the total size of the military wearables market. These methods were also used extensively to estimate the size of various subsegments of the market. The research methodology used to estimate the market size includes the following:

  • Key players in the industry and markets were identified through extensive secondary research.
  • The industry’s supply chain and market size, in terms of value, were determined through primary and secondary research processes.
  • All percentage shares, splits, and breakdowns were determined using secondary sources and verified through primary sources.

Market size estimation methodology: Bottom-up approach

The bottom-up approach was employed to arrive at the overall size of the global military wearables market from the demand of wearable technologies by the armed forces of each nation and the average cost of modernizing a soldier was multiplied with the number of soldiers being modernized in each country. These calculations led to the estimation of the overall market size.

Military Wearables Market Size, and Bottom-up approach

Market size estimation methodology: Top-down approach

In the top-down approach, the overall market size was used to estimate the size of the individual markets (mentioned in market segmentation) through percentage splits obtained from secondary and primary research.

For calculation of the specific market segments, the most appropriate and immediate parent market size was used to implement the top-down approach. The bottom-up approach was also implemented to validate the market segment revenues obtained.

Market shares were then estimated for each company to verify the revenue shares used earlier in the bottom-up approach. With data triangulation procedure and validation of data through primaries, the overall parent market size and each market size were determined and confirmed in this study. The data triangulation procedure used for this study is explained in the market breakdown and triangulation section.

Military Wearables Market Size, and Top-down approach

Report Objectives

  • To identify and analyze key drivers, restraints, challenges, and opportunities influencing the growth of the military wearables market
  • To analyze the impact of macro and micro indicators on the market
  • To forecast the market size of segments for five regions, namely, North America, Europe, Asia Pacific, the Middle East, and the Rest of the World, along with major countries in each of these regions
  • To strategically analyze micromarkets with respect to individual technological trends, prospects, and their contribution to the overall market
  • To strategically profile key market players and comprehensively analyze their market ranking and core competencies
  • To provide a detailed competitive landscape of the market, along with an analysis of business and corporate strategies, such as contracts, agreements, partnerships, expansions, and new product developments
  • To identify detailed financial positions, key products, unique selling points, and key developments of leading companies in the market

Available customizations

Along with the market data, MarketsandMarkets offers customizations as per the specific needs of companies. The following customization options are available for the report:

Product Analysis

  • Product matrix, which gives a detailed comparison of the product portfolio of each company

Regional Analysis

  • Further breakdown of the market segments at country-level

Company Information

  • Detailed analysis and profiling of additional market players (up to 5)
Custom Market Research Services

We will customize the research for you, in case the report listed above does not meet with your exact requirements. Our custom research will comprehensively cover the business information you require to help you arrive at strategic and profitable business decisions.

Request Customization

Instant Answers with GPT - Ask Now!

Ask real questions. Get complete answers !
Report Code
AS 7107
Published ON
Jul, 2022
Choose License Type
BUY NOW
  • SHARE
X
Request Customization
Speak to Analyst
Speak to Analyst
OR FACE-TO-FACE MEETING
PERSONALIZE THIS RESEARCH
  • Triangulate with your Own Data
  • Get Data as per your Format and Definition
  • Gain a Deeper Dive on a Specific Application, Geography, Customer or Competitor
  • Any level of Personalization
REQUEST A FREE CUSTOMIZATION
LET US HELP YOU!
  • What are the Known and Unknown Adjacencies Impacting the Military Wearables Market
  • What will your New Revenue Sources be?
  • Who will be your Top Customer; what will make them switch?
  • Defend your Market Share or Win Competitors
  • Get a Scorecard for Target Partners
CUSTOMIZED WORKSHOP REQUEST
knowledgestore logo

Want to explore hidden markets that can drive new revenue in Military Wearables Market?

Find Hidden Markets
  • Call Us
  • +1-888-600-6441 (Corporate office hours)
  • +1-888-600-6441 (US/Can toll free)
  • +44-800-368-9399 (UK office hours)
CONNECT WITH US
ABOUT TRUST ONLINE
©2024 MarketsandMarkets Research Private Ltd. All rights reserved
DMCA.com Protection Status
Website Feedback