Marine VFD Market by End User Type (Marine Ships, and Offshore Platforms), Application ( Pump, Propulsion, Fan, Compressor, Crane & Hoist, Winch, HVAC, Steering, Scrubber, Shaft Generator, Power Electronics), & Region - Global Forecast to 2030
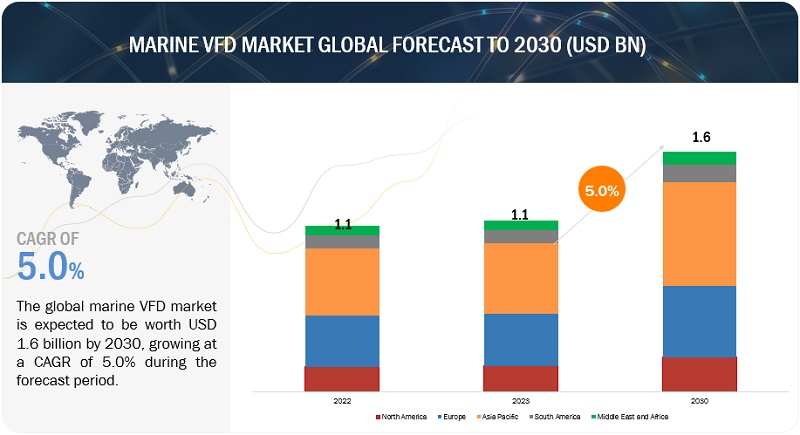
[237 Pages Report] The Marine VFD market is expected to grow from an estimated USD 1.1 billion in 2023 to USD 1.6 billion by 2030, at a CAGR of 5.0% during the forecast period. The nations are undergoing rapid industrialization, there is a greater demand for power. The increasing demand for energy-efficient systems in maritime vessels to control and adjust the speed and power of electric motors for efficiency and precision. This is enhancing the investment in the development of Marine VFD.
To know about the assumptions considered for the study, Request for Free Sample Report
To know about the assumptions considered for the study, download the pdf brochure
Marine VFD market Dynamics
Driver: Increasing demand for energy-efficient systems in maritime vessels
The maritime industry is currently in the midst of a significant transformation, with a strong focus on enhancing energy efficiency. This transformation is being primarily motivated by a combination of economic factors, sustainability goals, and the implementation of strict regulations. In this evolving landscape, the marine Variable Frequency Drive (VFD) market is experiencing substantial growth and is poised for further expansion. Key drivers of this growth include international regulations and standards, such as the Energy Efficiency Existing Ship Index (EEXI) and the Carbon Intensity Indicator (CII) established by the International Maritime Organization (IMO). These regulatory requirements necessitate vessels to meet stringent energy efficiency criteria, compelling shipowners and operators to invest in advanced technologies to comply with these mandates.
Restraints: High Initial Investment
Despite its considerable potential, the marine Variable Frequency Drive (VFD) market is faced with a significant restraint in the form of substantial investments associated with both retrofitting existing ships and integrating VFDs into new vessels. These cost-related challenges are expected to impede the growth of the marine VFD market.
One of the primary hindrances to the widespread adoption of marine VFDs is the significant upfront investment that is necessary. Retrofitting ships with VFDs can incur substantial costs, including expenses related to the procurement of VFD equipment, labor required for installation, engineering modifications, and the integration of the system. Similarly, the inclusion of VFDs in the designs of new ships demands allocating a portion of the ship's construction budget to this technology. These elevated initial costs have the potential to deter shipowners and operators, especially during periods of financial constraints or when budgets are closely managed.
Opportunity: Growing adoption of electric and hybrid propulsion systems
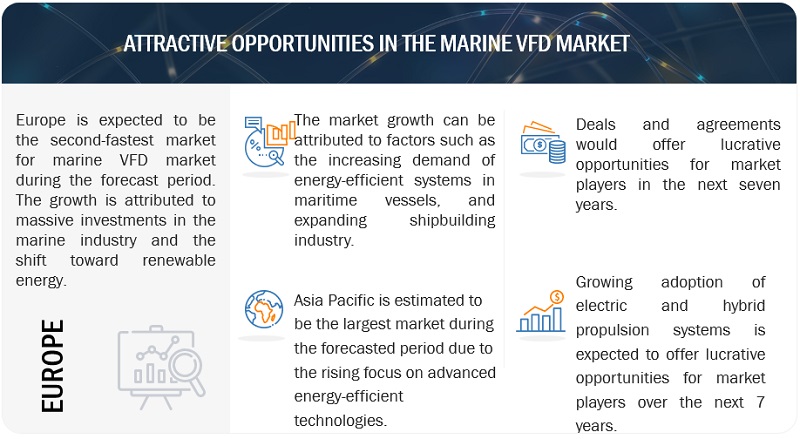
The maritime industry is currently experiencing a fundamental shift towards the adoption of electric and hybrid propulsion systems for marine vessels. The adoption of electric and hybrid propulsion in marine vessels is expected to drive the demand for marine VFDs. This shift is primarily driven by a compelling set of advantages, encompassing economic, environmental, and operational benefits. Notably, recent advancements in battery technology have played a pivotal role in facilitating this transformation, promising more efficient energy utilization, cost savings in fuel consumption, reduced emissions, and enhanced safety. Within this evolving landscape, there is a growing prevalence of electric and hybrid ships equipped with large batteries and optimized power control systems. These vessels derive significant advantages from their reduced reliance on traditional fuel sources, resulting in substantial cost reductions and a remarkable decrease in emissions, spanning CO2, SOX, NOX, and particulate matter. A notable catalyst for this shift has been the remarkable drop in battery prices, which have decreased by approximately 60-70% over the past four years, rendering battery propulsion economically feasible and attractive for a wide range of marine applications.
Challenges: Supply chain disruptions due to shortage of components and parts
The disruption in the semiconductor supply chain has emerged as a formidable challenge for the widespread adoption of marine VFDs in the maritime sector. These VFDs, known for their energy efficiency and precise control capabilities, rely heavily on semiconductor components, and the disruption in the supply chain for these crucial components has significant implications for the adoption of this technology.
According to the Semiconductor Industry Association, the semiconductor shortage took hold in 2020 due to a confluence of factors impacting supply and demand caused by the COVID-19 pandemic. In some industries, customers canceled chip purchases due to disrupted production, while in other industries, demand increased rapidly due to remote working policies. Moreover, the semiconductor supply chain disruption has impacted the innovation and development of advanced VFD technologies. The integration of cutting-edge semiconductor components, such as microcontrollers and digital signal processors, is crucial for enhancing the performance and functionality of VFDs. However, as semiconductor manufacturers struggle to meet demand across various industries, the maritime sector faces challenges accessing these advanced components for next-generation VFDs.
Marine VFD Market Ecosystem
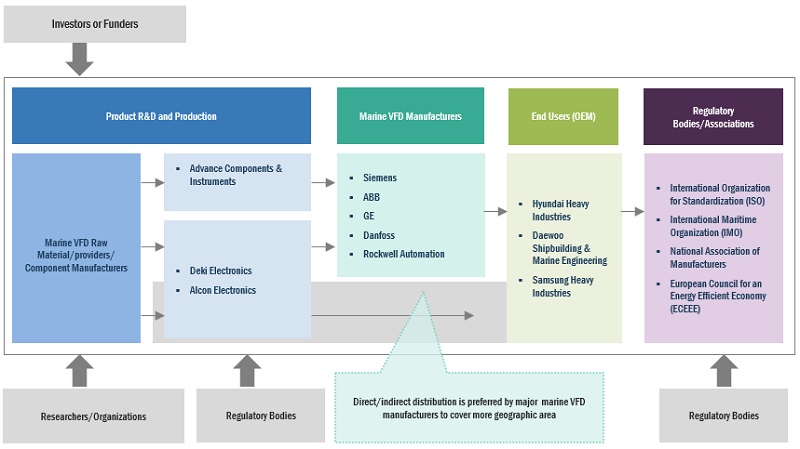
Notable players in this industry comprise long-standing, financially robust manufacturers of Marine VFD Market and related components. These companies have a significant track record in the market, offering a wide range of products, employing cutting-edge technologies, and maintaining robust global sales and marketing networks. Prominent companies in this market include Siemens (Germany), ABB (Switzerland), Danfoss (Denmark), General Electric (US), and Rockwell Automation (US).
Fan, is expected to be the second largest market on based on application type
Marine VFDs are employed in fans on marine vessels for several reasons. They enable precise control over fan speed, allowing adjustments to match the varying ventilation requirements of different ship compartments and conditions. This fine-tuned control ensures optimal air circulation and contributes to energy efficiency by preventing unnecessary power consumption when full fan speed is not required. In addition to energy savings, VFDs in marine fans extend equipment lifespan by reducing wear and tear on fan components through soft starting and stopping. Moreover, they also play a pivotal role in maintaining air quality and comfort for crew members and passengers, crucial for overall safety and well-being during extended voyages at sea.
Low voltage, by voltage, to hold the largest market share during the forecast period during the forecast period
Low voltage is one of the dominant segments of the marine VFD market. Low voltage marine VFDs represent specialized control systems tailored for marine and offshore applications characterized by lower voltage levels, typically below 1,000 volts. These VFDs are vital components in smaller vessels like ferries, tugboats, and offshore support vessels, where the precise control and enhanced energy efficiency they offer are of utmost importance. The growing small vessel market, including offshore support vessels and ferries, is fueling demand for low-voltage VFDs.
Asia Pacific is expected to account for the fastest market during the forecast period.
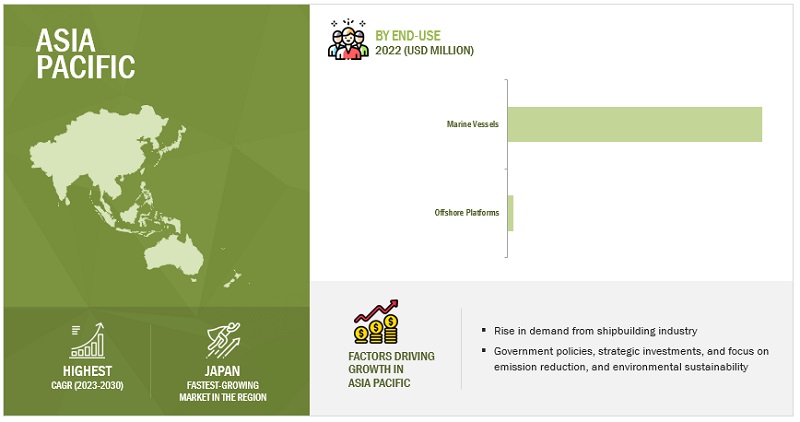
Asia Pacific is a fastest market the Asia Pacific region emerged as a notably expanding market for marine Variable Frequency Drives (VFDs). This region has been subdivided into three key segments: China, Japan, and the Rest of Asia Pacific, which includes countries like India, Australia, and South Korea.
China's significant growth in the naval sector and its competitive advancements in propulsion technologies, including innovations like ammonia-fueled ships, underscore the nation's dedication to maritime progress and sustainability. VFDs play a crucial role in enhancing vessel efficiency within this context. Japan's commitment to maritime security, exemplified by the introduction of the "Rules for Construction and Classification of Indian Naval Ships 2023," along with its thriving marine economy, further drives the demand for VFD technology. Australia's strong environmental focus and the growth of its shipbuilding sector align with the adoption of VFDs as a means to improve energy efficiency and reduce emissions. In India, regulatory measures aimed at vessel modernization and the release of naval construction rules emphasize the significance of VFDs in enhancing naval capabilities and promoting sustainability. South Korea's ventures into eco-friendly marine biofuels and propulsion innovations also contribute to the promotion of VFD adoption in the region. Collectively, these factors underscore the pivotal role of VFD technology in advancing maritime efficiency, sustainability, and overall performance within the diverse and dynamic Asia Pacific maritime landscape.
Key Market Players
The Marine VFD market is dominated by a few major players that have a wide regional presence. The major players in the Marine VFD market are Siemens (Germany), ABB (Switzerland), Danfoss (Denmark), General Electric (US), and Rockwell Automation (US). Between 2019 and 2023, Strategies such as product launches, contracts, agreements, partnerships, collaborations, alliances, acquisitions, and expansions are followed by these companies to capture a larger share of the Marine VFD market.
Scope of the Report
|
Report Metric |
Details |
|
Market size available for years |
2019–2030 |
|
Base year considered |
2022 |
|
Forecast period |
2023–2030 |
|
Forecast units |
Value (USD) |
|
Segments covered |
Type, Voltage, Application, End User, and Region |
|
Geographies covered |
Asia Pacific, North America, Europe, Middle East & Africa, and South America |
|
Companies covered |
Siemens (Germany), General Electric (US), Danfoss (Denmark), ABB (Switzerland), Rockwell Automation (US), Schneider Electric (France), NIDEC (Japan), WEG (Brazil), Ingeteam (Spain), Triol (Colombia), CG Power and Industrial Solutions (India), LS Electronics Co., Ltd. (South Korea), Johnson Controls (US), Honeywell (US), Parker Hannifin (US), Invertek Drives (UK), SELMA (Greece), HI-SEA (China), Bosch Rexroth (Germany), and Nord (India) |
This research report categorizes the marine VFD market by type, voltage, application, end user, and region
On the basis of type, the marine VFD market has been segmented as follows:
- New
- Retrofit
On the basis of voltage, the marine VFD market has been segmented as follows:
- Low Voltage
- Medium Voltage
On the basis of by application, the marine VFD market has been segmented as follows:
- Pump
- Propulsion
- Fan
- Compressor
- Crane & Hoist
- Winch
- HVAC
- Steering
- Scrubber
- Shaft Generator
- Power Electronics
On the basis of by end user, the marine VFD market has been segmented as follows:
- Marine ships
- Offshore platforms
On the basis of region, the marine VFD market has been segmented as follows:
- Asia Pacific
- Europe
- North America
- Middle East & Africa
- South America
Recent Developments
- In May 2023, GE Power Conversion signed an agreement to renew its partnership with Nedstack Fuel Cell Technology for the development of marine fuel cell solutions. The agreement follows on from a previous cooperation agreement for collaborative work. A pilot project for a large-scale marine fuel cell application provided valuable feasibility support to a cruise provider for their technical and commercial evaluation of decarbonization solutions.
- In June 2022, ABB leads a consortium to implement shore-to-ship power connections for ferries and cruise ships at the port of Toulon. ABB’s technology reduces emissions and noise during port stops. Additionally, ABB is installing an energy storage system to handle grid demand fluctuations and incorporate renewable energy sources, ensuring a sustainable and efficient solution.
- In December 2020, Cochin Shipyard selected Siemens to implement advanced marine solutions for India’s first fleet of 23 boats equipped with electric propulsion and battery-integrated technology.
Frequently Asked Questions (FAQ):
What is the current size of the Marine VFD market?
The current market size of global Marine VFD market is USD 1.1 billion in 2023.
What is the major drivers for Marine VFD market?
The global Marine VFD market is driven by in off-grid locations is fueled by increasing demand for energy-efficient systems in maritime vessels.
Which is the fastest-growing region during the forecasted period in Marine VFD market?
Asia Pacific is a fastest market the Asia Pacific region emerged as a notably expanding market for marine Variable Frequency Drives (VFDs).
Which is the second largest segment, by application type during the forecasted period in Marine VFD market?
Fan, is expected to be the second largest market. Marine VFDs are employed in fans on marine vessels for several reasons. They enable precise control over fan speed, allowing adjustments to match the varying ventilation requirements of different ship compartments and conditions.
Which is the largest segment, by end user during the forecasted period in Marine VFD market?
Low voltage holds the largest market share. Low voltage is one of the dominant segments of the marine VFD market. Low voltage marine VFDs represent specialized control systems tailored for marine and offshore applications characterized by lower voltage levels, typically below 1,000 volts. These VFDs are vital components in smaller vessels like ferries, tugboats, and offshore support vessels, where the precise control and enhanced energy efficiency they offer are of utmost importance.
To speak to our analyst for a discussion on the above findings, click Speak to Analyst


- 5.1 INTRODUCTION
-
5.2 MARKET DYNAMICSDRIVERS- Increasing demand for energy-efficient systems in maritime vessels- Expanding shipbuilding industryRESTRAINTS- High installation cost- Dependence on heavy liquid fuelsOPPORTUNITIES- Growing adoption of electric and hybrid propulsion systems- Technological advancements in remote monitoring of VFDsCHALLENGES- Undeveloped port infrastructure- Shortage of components and parts attributed to supply chain disruptions
-
5.3 TRENDS/DISRUPTIONS IMPACTING CUSTOMERS’ BUSINESSES
-
5.4 ECOSYSTEM ANALYSIS
-
5.5 VALUE CHAIN ANALYSISRAW MATERIAL PROVIDERS/SUPPLIERS/COMPONENT MANUFACTURERSMARINE VFD MANUFACTURERS/ASSEMBLERSDISTRIBUTORS/RESELLERSEND USERSMAINTENANCE/SERVICE PROVIDERS
- 5.6 PRICING ANALYSIS
-
5.7 TECHNOLOGY ANALYSISWIRELESS DIAGNOSTICMODULAR MEMORYPREDICTIVE MAINTENANCEPOWER ELECTRONICS
- 5.8 TARIFF ANALYSIS
- 5.9 REGULATORY LANDSCAPE
-
5.10 PATENT ANALYSIS
-
5.11 TRADE ANALYSISEXPORT DATAIMPORT DATA
- 5.12 KEY CONFERENCES AND EVENTS, 2023–2024
-
5.13 CASE STUDY ANALYSISDANFOSS PROVIDED MODULAR VACON 3000 DRIVE KIT TO ENHANCE PERFORMANCE OF INBOARD DREDGE PUMP OF DEME AND ELEVATE ENERGY EFFICIENCYHAREID GROUP EMPLOYED ABB DRIVES IN SHORE POWER SOLUTIONS TO DELIVER ENVIRONMENTALLY FRIENDLY ELECTRICAL POWER TO VESSELSSCHOTTEL GROUP HIRED INVERTEK DRIVES FAR EAST PTE LTD TO DELIVER VFD FOR PROPULSION APPLICATION
-
5.14 PORTER’S FIVE FORCES ANALYSISTHREAT OF SUBSTITUTESBARGAINING POWER OF SUPPLIERSBARGAINING POWER OF BUYERSTHREAT OF NEW ENTRANTSINTENSITY OF COMPETITIVE RIVALRY
-
5.15 KEY STAKEHOLDERS AND BUYING CRITERIAKEY STAKEHOLDERS IN BUYING PROCESSBUYING CRITERIA
- 6.1 INTRODUCTION
-
6.2 PUMPUSED TO ENHANCE OPERATIONAL EFFICIENCY OF PUMPS AND MITIGATE MECHANICAL STRESS
-
6.3 PROPULSIONHELP CONTROL SPEED AND POWER OUTPUT OF AC ELECTRIC MOTORS THAT DRIVE PROPELLERS OF VESSELS
-
6.4 FANOFFER PRECISE CONTROL OVER FAN SPEED TO MAKE ADJUSTMENTS TO MATCH VARYING VENTILATION REQUIREMENTS OF DIFFERENT SHIP COMPARTMENTS AND CONDITIONS
-
6.5 COMPRESSORHELP REDUCE POWER CONSUMPTION, EXTEND EQUIPMENT LIFESPAN, AND LOWER MAINTENANCE COST
-
6.6 CRANE & HOISTFACILITATE EFFECTIVE CARGO HANDLING AND ALLOW OPERATORS FINE-TUNE LIFTING SPEEDS AND LOAD CAPACITIES
-
6.7 WINCHREGULATE SPEED AND PERFORMANCE OF AC MOTORS DRIVING WINCHES
-
6.8 HVACENSURE ENERGY EFFICIENCY BY ADAPTING EQUIPMENT OPERATION TO REAL-TIME DEMAND
-
6.9 STEERINGIMPERATIVE TO ATTAIN PRECISE AND RESPONSIVE CONTROL OVER VESSEL DIRECTION
-
6.10 SCRUBBEROPTIMIZE EFFICIENCY OF SCRUBBERS IN REMOVING SULFUR DIOXIDE AND OTHER POLLUTANTS FROM EXHAUST GASES OF VESSELS
-
6.11 SHAFT GENERATORREDUCE WEAR AND TEAR AND ENSURE RELIABLE POWER SUPPLY
-
6.12 POWER ELECTRONICSENABLE EFFICIENT BATTERY CHARGING, OPTIMIZED UTILIZATION OF SHORE CONNECTIONS, AND ENHANCED STABILITY WITHIN DC GRIDS
- 7.1 INTRODUCTION
-
7.2 NEWINCREASING REQUIREMENT FOR PRECISE AND DYNAMIC CONTROL IN MARITIME SECTOR
-
7.3 RETROFITGROWING USE OF VFDS TO EXTEND OPERATIONAL LIFE OF VESSELS BY IMPROVING RELIABILITY OF CRITICAL SYSTEMS
- 8.1 INTRODUCTION
-
8.2 LOW VOLTAGERISING DEPLOYMENT OF LOW VOLTAGE VFDS ON CRITICAL SYSTEMS TO ACHIEVE COST SAVINGS AND REDUCE EMISSIONS
-
8.3 MEDIUM VOLTAGECAPABILITY TO OPTIMIZE ENERGY CONSUMPTION AND ENSURE SEAMLESS VOLTAGE COMPATIBILITY WITH MEDIUM VOLTAGE ELECTRICAL SYSTEMS
- 9.1 INTRODUCTION
-
9.2 MARINE SHIPSUSED TO OPTIMIZE ENERGY USAGE BY PRECISELY CONTROLLING ELECTRICAL SYSTEMS ON SHIPS
-
9.3 OFFSHORE PLATFORMSUSED IN OFFSHORE PLATFORMS TO ENHANCE ENERGY EFFICIENCY BY PRECISELY REGULATING CRITICAL ELECTRICAL SYSTEMS
- 10.1 INTRODUCTION
-
10.2 ASIA PACIFICASIA PACIFIC: RECESSION IMPACTBY TYPEBY VOLTAGEBY END USERBY APPLICATIONBY COUNTRYCHINA- Rising port infrastructure development investmentsJAPAN- High emphasis on slashing CO2 emissions and aligning with eco-friendly shipping agendaREST OF ASIA PACIFIC
-
10.3 EUROPEEUROPE: RECESSION IMPACTBY TYPEBY VOLTAGEBY END USERBY APPLICATIONBY COUNTRYGERMANY- Government-led incentives and subsidies for increasing adoption of eco-friendly maritime technologiesUK- Strong commitment to sustainable future and technological advancementsFRANCE- Relevant collaborations and partnerships in maritime sectorITALY- Technological innovations and shift toward renewable energySPAIN- Shift toward cleaner fuelsNORWAY- Presence of stringent environmental regulationsDENMARK- Growing adoption of energy-efficient technologies and focus on adhering to environmental compliancesSWEDEN- Integration of VFDs and other electrification technologies into ferries and other vessels to reduce reliance on fossil fuelsFINLAND- Government-led incentives and subsidies to shipping companies investing in green technologiesNETHERLANDS- Increasing offshore wind expansions and multiyear framework agreementsBELGIUM- Growing need to enhance efficiency and reduce vessel emissionsAUSTRIA- Government focus on use of green technologiesGREECE- High commitment to international maritime regulationsREST OF EUROPE
-
10.4 NORTH AMERICANORTH AMERICA: RECESSION IMPACTBY TYPEBY VOLTAGEBY END USERBY APPLICATIONBY COUNTRYUS- Strong government support and technological advancementsCANADA- Naval expansions and strategic collaborationsMEXICO- Rising offshore expansion activities and focus on environmental conservation
-
10.5 SOUTH AMERICASOUTH AMERICA: RECESSION IMPACTBY TYPEBY VOLTAGEBY END USERBY APPLICATIONBY COUNTRYBRAZIL- Government-led support and focus on sustainabilityARGENTINA- Flourishing fishing industryREST OF SOUTH AMERICA
-
10.6 MIDDLE EAST & AFRICARECESSION IMPACT: MIDDLE EAST & AFRICABY TYPEBY VOLTAGEBY END USERBY APPLICATIONBY COUNTRYTURKEY- Rising focus on modernization of maritime sectorSOUTH AFRICA- Deployment of floating power plants equipped with VFDsREST OF MIDDLE EAST & AFRICA

- 11.1 OVERVIEW
- 11.2 KEY STRATEGIES ADOPTED BY MAJOR PLAYERS
- 11.3 MARKET SHARE ANALYSIS, 2022
- 11.4 REVENUE ANALYSIS OF TOP FIVE PLAYERS, 2018–2022
-
11.5 EVALUATION MATRIX OF KEY COMPANIES, 2022STARSPERVASIVE PLAYERSEMERGING LEADERSPARTICIPANTS
- 11.6 COMPETITIVE BENCHMARKING
- 11.7 COMPETITIVE SCENARIOS AND TRENDS
-
12.1 KEY PLAYERSSIEMENS- Business overview- Products/Solutions/Services offered- Recent developments- MnM viewSCHNEIDER ELECTRIC- Business overview- Products/Solutions/Services offered- MnM viewGENERAL ELECTRIC- Business overview- Products/Solutions/Services offered- Recent developments- MnM viewABB- Business overview- Products/Solutions/Services offered- Recent developments- MnM viewDANFOSS- Business overview- Products/Solutions/Services offered- Recent developments- MnM viewNIDEC- Business overview- Products/Solutions/Services offered- Recent developmentsWEG- Business overview- Products/Solutions/Services offered- Recent developmentsROCKWELL AUTOMATION- Business overview- Products/Solutions/Services offered- Recent developments- MnM viewINGETEAM- Business overview- Products/Solutions/Services offered- Recent developmentsTRIOL- Business overview- Products/Solutions/Services offered- Recent developmentsCG POWER AND INDUSTRIAL SOLUTIONS- Business overview- Products/Solutions/Services offeredLS ELECTRIC CO., LTD.- Business overview- Products/Solutions/Services offeredJOHNSON CONTROLS- Business overview- Products/Solutions/Services offeredHONEYWELL- Business overview- Products/Solutions/Services offeredPARKER HANNIFIN- Business overview- Products/Solutions/Services offered- Recent developments
-
12.2 OTHER PLAYERSINVERTEK DRIVESSELMAHI-SEABOSCH REXROTHNORD
- 13.1 INSIGHTS FROM INDUSTRY EXPERTS
- 13.2 DISCUSSION GUIDE
- 13.3 KNOWLEDGESTORE: MARKETSANDMARKETS’ SUBSCRIPTION PORTAL
- 13.4 CUSTOMIZATION OPTIONS
- 13.5 RELATED REPORTS
- 13.6 AUTHOR DETAILS
- TABLE 1 MARINE VFD MARKET SNAPSHOT
- TABLE 2 MEASURES UNDERTAKEN TO ENHANCE ENERGY EFFICIENCY OF SHIPS
- TABLE 3 COMPANIES AND THEIR ROLE IN MARINE VFD ECOSYSTEM
- TABLE 4 AVERAGE SELLING PRICE (ASP) OF MARINE VFDS, BY VOLTAGE, 2020, 2021, 2022, AND 2030 (USD/UNIT)
- TABLE 5 AVERAGE SELLING PRICE (ASP) TREND, BY REGION, 2020, 2021, 2022, AND 2030 (USD/UNIT)
- TABLE 6 TARIFF LEVIED ON ELECTRIC MOTORS AND GENERATORS, 2022
- TABLE 7 MARKET: EUROPE REGULATIONS
- TABLE 8 MARKET: ASIA PACIFIC REGULATIONS
- TABLE 9 MARKET: NORTH AMERICA REGULATIONS
- TABLE 10 MARKET: INTERNATIONAL REGULATIONS
- TABLE 11 INTERNATIONAL: LIST OF REGULATORY BODIES, GOVERNMENT AGENCIES, AND OTHER ORGANIZATIONS
- TABLE 12 NORTH AMERICA: LIST OF REGULATORY BODIES, GOVERNMENT AGENCIES, AND OTHER ORGANIZATIONS
- TABLE 13 EUROPE: LIST OF REGULATORY BODIES, GOVERNMENT AGENCIES, AND OTHER ORGANIZATIONS
- TABLE 14 ASIA PACIFIC: LIST OF REGULATORY BODIES, GOVERNMENT AGENCIES, AND OTHER ORGANIZATIONS
- TABLE 15 MARKET: INNOVATIONS AND PATENT REGISTRATIONS
- TABLE 16 EXPORT DATA FOR PRODUCTS UNDER HS CODE: 8501, BY COUNTRY, 2020–2022 (USD THOUSAND)
- TABLE 17 IMPORT DATA FOR PRODUCTS UNDER HS CODE: 8501, BY COUNTRY, 2020–2022 (USD THOUSAND)
- TABLE 18 MARKET: LIST OF CONFERENCES AND EVENTS
- TABLE 19 MARKET: PORTER’S FIVE FORCES ANALYSIS
- TABLE 20 INFLUENCE OF STAKEHOLDERS ON BUYING PROCESS FOR TWO KEY END USERS (%)
- TABLE 21 KEY BUYING CRITERIA FOR TWO KEY END USERS
- TABLE 22 MARKET, BY APPLICATION, 2019–2022 (USD MILLION)
- TABLE 23 MARKET, BY APPLICATION, 2023–2030 (USD MILLION)
- TABLE 24 PUMP: MARKET, BY REGION, 2019–2022 (USD MILLION)
- TABLE 25 PUMP: MARKET, BY REGION, 2023–2030 (USD MILLION)
- TABLE 26 PROPULSION: MARKET, BY REGION, 2019–2022 (USD MILLION)
- TABLE 27 PROPULSION: MARKET, BY REGION, 2023–2030 (USD MILLION)
- TABLE 28 FAN: MARKET, BY REGION, 2019–2022 (USD MILLION)
- TABLE 29 FAN: MARKET, BY REGION, 2023–2030 (USD MILLION)
- TABLE 30 COMPRESSOR: MARKET, BY REGION, 2019–2022 (USD MILLION)
- TABLE 31 COMPRESSOR: MARKET, BY REGION, 2023–2030 (USD MILLION)
- TABLE 32 CRANE & HOIST: MARKET, BY REGION, 2019–2022 (USD MILLION)
- TABLE 33 CRANE & HOIST: MARKET, BY REGION, 2023–2030 (USD MILLION)
- TABLE 34 WINCH: MARKET, BY REGION, 2019–2022 (USD MILLION)
- TABLE 35 WINCH: MARKET, BY REGION, 2023–2030 (USD MILLION)
- TABLE 36 HVAC: MARKET, BY REGION, 2019–2022 (USD MILLION)
- TABLE 37 HVAC: MARKET, BY REGION, 2023–2030 (USD MILLION)
- TABLE 38 STEERING: MARKET, BY REGION, 2019–2022 (USD MILLION)
- TABLE 39 STEERING: MARKET, BY REGION, 2023–2030 (USD MILLION)
- TABLE 40 SCRUBBER: MARKET, BY REGION, 2019–2022 (USD MILLION)
- TABLE 41 SCRUBBER: MARKET, BY REGION, 2023–2030 (USD MILLION)
- TABLE 42 SHAFT GENERATOR: MARKET, BY REGION, 2019–2022 (USD MILLION)
- TABLE 43 SHAFT GENERATOR: MARKET, BY REGION, 2023–2030 (USD MILLION)
- TABLE 44 POWER ELECTRONICS: MARKET, BY REGION, 2019–2022 (USD MILLION)
- TABLE 45 POWER ELECTRONICS: MARKET, BY REGION, 2023–2030 (USD MILLION)
- TABLE 46 MARKET, BY TYPE, 2019–2022 (USD MILLION)
- TABLE 47 MARKET, BY TYPE, 2023–2030 (USD MILLION)
- TABLE 48 NEW: MARKET, BY REGION, 2019–2022 (USD MILLION)
- TABLE 49 NEW: MARKET, BY REGION, 2023–2030 (USD MILLION)
- TABLE 50 RETROFIT: MARKET, BY REGION, 2019–2022 (USD MILLION)
- TABLE 51 RETROFIT: MARKET, BY REGION, 2023–2030 (USD MILLION)
- TABLE 52 MARKET, BY VOLTAGE, 2019–2022 (USD MILLION)
- TABLE 53 MARKET, BY VOLTAGE, 2023–2030 (USD MILLION)
- TABLE 54 LOW VOLTAGE: MARKET, BY REGION, 2019–2022 (USD MILLION)
- TABLE 55 LOW VOLTAGE: MARKET, BY REGION, 2023–2030 (USD MILLION)
- TABLE 56 MEDIUM VOLTAGE: MARKET, BY REGION, 2019–2022 (USD MILLION)
- TABLE 57 MEDIUM VOLTAGE: MARKET, BY REGION, 2023–2030 (USD MILLION)
- TABLE 58 MARKET, BY END USER, 2019–2022 (USD MILLION)
- TABLE 59 MARKET, BY END USER, 2023–2030 (USD MILLION)
- TABLE 60 MARINE SHIPS: MARKET, BY REGION, 2019–2022 (USD MILLION)
- TABLE 61 MARINE SHIPS: MARKET, BY REGION, 2023–2030 (USD MILLION)
- TABLE 62 OFFSHORE PLATFORMS: MARKET, BY REGION, 2019–2022 (USD MILLION)
- TABLE 63 OFFSHORE PLATFORMS: MARKET, BY REGION, 2023–2030 (USD MILLION)
- TABLE 64 MARKET, BY REGION, 2019–2022 (USD MILLION)
- TABLE 65 MARKET, BY REGION, 2023–2030 (USD MILLION)
- TABLE 66 MARKET, BY REGION, 2019–2022 (THOUSAND UNITS)
- TABLE 67 MARKET, BY REGION, 2023–2030 (THOUSAND UNITS)
- TABLE 68 ASIA PACIFIC: MARKET, BY TYPE, 2019–2022 (USD MILLION)
- TABLE 69 ASIA PACIFIC: MARKET, BY TYPE, 2023–2030 (USD MILLION)
- TABLE 70 ASIA PACIFIC: MARKET, BY VOLTAGE, 2019–2022 (USD MILLION)
- TABLE 71 ASIA PACIFIC: MARKET, BY VOLTAGE, 2023–2030 (USD MILLION)
- TABLE 72 ASIA PACIFIC: MARKET, BY END USER, 2019–2022 (USD MILLION)
- TABLE 73 ASIA PACIFIC: MARKET, BY END USER, 2023–2030 (USD MILLION)
- TABLE 74 ASIA PACIFIC: MARKET, BY APPLICATION, 2019–2022 (USD MILLION)
- TABLE 75 ASIA PACIFIC: MARKET, BY APPLICATION, 2023–2030 (USD MILLION)
- TABLE 76 ASIA PACIFIC: MARKET, BY COUNTRY, 2019–2022 (USD MILLION)
- TABLE 77 ASIA PACIFIC: MARKET, BY COUNTRY, 2023–2030 (USD MILLION)
- TABLE 78 CHINA: MARKET, BY END USER, 2019–2022 (USD MILLION)
- TABLE 79 CHINA: MARKET, BY END USER, 2023–2030 (USD MILLION)
- TABLE 80 JAPAN: MARKET, BY END USER, 2019–2022 (USD MILLION)
- TABLE 81 JAPAN: MARKET, BY END USER, 2023–2030 (USD MILLION)
- TABLE 82 REST OF ASIA PACIFIC: MARKET, BY END USER, 2019–2022 (USD MILLION)
- TABLE 83 REST OF ASIA PACIFIC: MARKET, BY END USER, 2023–2030 (USD MILLION)
- TABLE 84 EUROPE: MARKET, BY TYPE, 2019–2022 (USD MILLION)
- TABLE 85 EUROPE: MARKET, BY TYPE, 2023–2030 (USD MILLION)
- TABLE 86 EUROPE: MARKET, BY VOLTAGE, 2019–2022 (USD MILLION)
- TABLE 87 EUROPE: MARKET, BY VOLTAGE, 2023–2030 (USD MILLION)
- TABLE 88 EUROPE: MARKET, BY END USER, 2019–2022 (USD MILLION)
- TABLE 89 EUROPE: MARKET, BY END USER, 2023–2030 (USD MILLION)
- TABLE 90 EUROPE: MARKET, BY APPLICATION, 2019–2022 (USD MILLION)
- TABLE 91 EUROPE: MARKET, BY APPLICATION, 2023–2030 (USD MILLION)
- TABLE 92 EUROPE: MARKET, BY COUNTRY, 2019–2022 (USD MILLION)
- TABLE 93 EUROPE: MARKET, BY COUNTRY, 2023–2030 (USD MILLION)
- TABLE 94 GERMANY: MARKET, BY END USER, 2019–2022 (USD MILLION)
- TABLE 95 GERMANY: MARKET, BY END USER, 2023–2030 (USD MILLION)
- TABLE 96 UK: MARKET, BY END USER, 2019–2022 (USD MILLION)
- TABLE 97 UK: MARKET, BY END USER, 2023–2030 (USD MILLION)
- TABLE 98 FRANCE: MARKET, BY END USER, 2019–2022 (USD MILLION)
- TABLE 99 FRANCE: MARKET, BY END USER, 2023–2030 (USD MILLION)
- TABLE 100 ITALY: MARKET, BY END USER, 2019–2022 (USD MILLION)
- TABLE 101 ITALY: MARKET, BY END USER, 2023–2030 (USD MILLION)
- TABLE 102 SPAIN: MARKET, BY END USER, 2019–2022 (USD MILLION)
- TABLE 103 SPAIN: MARKET, BY END USER, 2023–2030 (USD MILLION)
- TABLE 104 NORWAY: MARKET, BY END USER, 2019–2022 (USD MILLION)
- TABLE 105 NORWAY: MARKET, BY END USER, 2023–2030 (USD MILLION)
- TABLE 106 DENMARK: MARKET, BY END USER, 2019–2022 (USD MILLION)
- TABLE 107 DENMARK: MARKET, BY END USER, 2023–2030 (USD MILLION)
- TABLE 108 SWEDEN: MARKET, BY END USER, 2019–2022 (USD MILLION)
- TABLE 109 SWEDEN: MARKET, BY END USER, 2023–2030 (USD MILLION)
- TABLE 110 FINLAND: MARKET, BY END USER, 2019–2022 (USD MILLION)
- TABLE 111 FINLAND: MARKET, BY END USER, 2023–2030 (USD MILLION)
- TABLE 112 NETHERLANDS: MARKET, BY END USER, 2019–2022 (USD MILLION)
- TABLE 113 NETHERLANDS: MARKET, BY END USER, 2023–2030 (USD MILLION)
- TABLE 114 BELGIUM: MARKET, BY END USER, 2019–2022 (USD MILLION)
- TABLE 115 BELGIUM: MARKET, BY END USER, 2023–2030 (USD MILLION)
- TABLE 116 AUSTRIA: MARKET, BY END USER, 2019–2022 (USD MILLION)
- TABLE 117 AUSTRIA: MARKET, BY END USER, 2023–2030 (USD MILLION)
- TABLE 118 GREECE: MARKET, BY END USER, 2019–2022 (USD MILLION)
- TABLE 119 GREECE: MARKET, BY END USER, 2023–2030 (USD MILLION)
- TABLE 120 REST OF EUROPE: MARKET, BY END USER, 2019–2022 (USD MILLION)
- TABLE 121 REST OF EUROPE: MARKET, BY END USER, 2023–2030 (USD MILLION)
- TABLE 122 NORTH AMERICA: MARKET, BY TYPE, 2019–2022 (USD MILLION)
- TABLE 123 NORTH AMERICA: MARKET, BY TYPE, 2023–2030 (USD MILLION)
- TABLE 124 NORTH AMERICA: MARKET, BY VOLTAGE, 2019–2022 (USD MILLION)
- TABLE 125 NORTH AMERICA: MARKET, BY VOLTAGE, 2023–2030 (USD MILLION)
- TABLE 126 NORTH AMERICA: MARKET, BY END USER, 2019–2022 (USD MILLION)
- TABLE 127 NORTH AMERICA: MARKET, BY END USER, 2023–2030 (USD MILLION)
- TABLE 128 NORTH AMERICA: MARKET, BY APPLICATION, 2019–2022 (USD MILLION)
- TABLE 129 NORTH AMERICA: MARKET, BY APPLICATION, 2023–2030 (USD MILLION)
- TABLE 130 NORTH AMERICA: MARKET, BY COUNTRY, 2019–2022 (USD MILLION)
- TABLE 131 NORTH AMERICA: MARKET, BY COUNTRY, 2023–2030 (USD MILLION)
- TABLE 132 US: MARKET, BY END USER, 2019–2022 (USD MILLION)
- TABLE 133 US: MARKET, BY END USER, 2023–2030 (USD MILLION)
- TABLE 134 CANADA: MARKET, BY END USER, 2019–2022 (USD MILLION)
- TABLE 135 CANADA: MARKET, BY END USER, 2023–2030 (USD MILLION)
- TABLE 136 MEXICO: MARKET, BY END USER, 2019–2022 (USD MILLION)
- TABLE 137 MEXICO: MARKET, BY END USER, 2023–2030 (USD MILLION)
- TABLE 138 SOUTH AMERICA: MARKET, BY TYPE, 2019–2022 (USD MILLION)
- TABLE 139 SOUTH AMERICA: MARKET, BY TYPE, 2023–2030 (USD MILLION)
- TABLE 140 SOUTH AMERICA: MARKET, BY VOLTAGE, 2019–2022 (USD MILLION)
- TABLE 141 SOUTH AMERICA: MARKET, BY VOLTAGE, 2023–2030 (USD MILLION)
- TABLE 142 SOUTH AMERICA: MARKET, BY END USER, 2019–2022 (USD MILLION)
- TABLE 143 SOUTH AMERICA: MARKET, BY END USER, 2023–2030 (USD MILLION)
- TABLE 144 SOUTH AMERICA: MARKET, BY APPLICATION, 2019–2022 (USD MILLION)
- TABLE 145 SOUTH AMERICA: MARKET, BY APPLICATION, 2023–2030 (USD MILLION)
- TABLE 146 SOUTH AMERICA: MARKET, BY COUNTRY, 2019–2022 (USD MILLION)
- TABLE 147 SOUTH AMERICA: MARKET, BY COUNTRY, 2023–2030 (USD MILLION)
- TABLE 148 BRAZIL: MARKET, BY END USER, 2019–2022 (USD MILLION)
- TABLE 149 BRAZIL: MARKET, BY END USER, 2023–2030 (USD MILLION)
- TABLE 150 ARGENTINA: MARKET, BY END USER, 2019–2022 (USD MILLION)
- TABLE 151 ARGENTINA: MARKET, BY END USER, 2023–2030 (USD MILLION)
- TABLE 152 REST OF SOUTH AMERICA: MARKET, BY END USER, 2019–2022 (USD MILLION)
- TABLE 153 REST OF SOUTH AMERICA: MARKET, BY END USER, 2023–2030 (USD MILLION)
- TABLE 154 MIDDLE EAST & AFRICA: MARKET, BY TYPE, 2019–2022 (USD MILLION)
- TABLE 155 MIDDLE EAST & AFRICA: MARKET, BY TYPE, 2023–2030 (USD MILLION)
- TABLE 156 MIDDLE EAST & AFRICA: MARKET, BY VOLTAGE, 2019–2022 (USD MILLION)
- TABLE 157 MIDDLE EAST & AFRICA: MARKET, BY VOLTAGE, 2023–2030 (USD MILLION)
- TABLE 158 MIDDLE EAST & AFRICA: MARKET, BY END USER, 2019–2022 (USD MILLION)
- TABLE 159 MIDDLE EAST & AFRICA: MARKET, BY END USER, 2023–2030 (USD MILLION)
- TABLE 160 MIDDLE EAST & AFRICA: MARKET, BY APPLICATION, 2019–2022 (USD MILLION)
- TABLE 161 MIDDLE EAST & AFRICA: MARKET, BY APPLICATION, 2023–2030 (USD MILLION)
- TABLE 162 MIDDLE EAST & AFRICA: MARKET, BY COUNTRY, 2019–2022 (USD MILLION)
- TABLE 163 MIDDLE EAST & AFRICA: MARKET, BY COUNTRY, 2023–2030 (USD MILLION)
- TABLE 164 TURKEY: MARKET, BY END USER, 2019–2022 (USD MILLION)
- TABLE 165 TURKEY: MARKET, BY END USER, 2023–2030 (USD MILLION)
- TABLE 166 SOUTH AFRICA: MARKET, BY END USER, 2019–2022 (USD MILLION)
- TABLE 167 SOUTH AFRICA: MARKET, BY END USER, 2023–2030 (USD MILLION)
- TABLE 168 REST OF MIDDLE EAST & AFRICA: MARKET, BY END USER, 2019–2022 (USD MILLION)
- TABLE 169 REST OF MIDDLE EAST & AFRICA: MARKET, BY END USER, 2023–2030 (USD MILLION)
- TABLE 170 KEY STRATEGIES ADOPTED BY TOP PLAYERS, 2019–2022
- TABLE 171 MARKET: DEGREE OF COMPETITION
- TABLE 172 TYPE: COMPANY FOOTPRINT
- TABLE 173 END USER: COMPANY FOOTPRINT
- TABLE 174 APPLICATION: COMPANY FOOTPRINT
- TABLE 175 VOLTAGE: COMPANY FOOTPRINT
- TABLE 176 REGION: COMPANY FOOTPRINT
- TABLE 177 COMPANY FOOTPRINT
- TABLE 178 MARKET: DEALS, JANUARY 2019–JANUARY 2023
- TABLE 179 MARKET: OTHERS, JANUARY 2019–JANUARY 2023
- TABLE 180 SIEMENS: COMPANY OVERVIEW
- TABLE 181 SIEMENS: PRODUCTS/SOLUTIONS/SERVICES OFFERED
- TABLE 182 SIEMENS: DEALS
- TABLE 183 SCHNEIDER ELECTRIC: COMPANY OVERVIEW
- TABLE 184 SCHNEIDER ELECTRIC: PRODUCTS/SOLUTIONS/SERVICES OFFERED
- TABLE 185 GENERAL ELECTRIC: COMPANY OVERVIEW
- TABLE 186 GENERAL ELECTRIC: PRODUCTS/SOLUTIONS/SERVICES OFFERED
- TABLE 187 GENERAL ELECTRIC: DEALS
- TABLE 188 ABB: COMPANY OVERVIEW
- TABLE 189 ABB: PRODUCTS/SOLUTIONS/SERVICES OFFERED
- TABLE 190 ABB: DEALS
- TABLE 191 ABB: OTHERS
- TABLE 192 DANFOSS: COMPANY OVERVIEW
- TABLE 193 DANFOSS: PRODUCTS/SOLUTIONS/SERVICES OFFERED
- TABLE 194 DANFOSS: DEALS
- TABLE 195 NIDEC: COMPANY OVERVIEW
- TABLE 196 NIDEC: PRODUCTS/SOLUTIONS/SERVICES OFFERED
- TABLE 197 NIDEC: DEALS
- TABLE 198 NIDEC: OTHERS
- TABLE 199 WEG: COMPANY OVERVIEW
- TABLE 200 WEG: PRODUCTS/SOLUTIONS/SERVICES OFFERED
- TABLE 201 WEG: DEALS
- TABLE 202 WEG: OTHERS
- TABLE 203 ROCKWELL AUTOMATION: COMPANY OVERVIEW
- TABLE 204 ROCKWELL AUTOMATION: PRODUCTS/SOLUTIONS/SERVICES OFFERED
- TABLE 205 ROCKWELL AUTOMATION: DEALS
- TABLE 206 INGETEAM: COMPANY OVERVIEW
- TABLE 207 INGETEAM: PRODUCTS/SOLUTIONS/SERVICES OFFERED
- TABLE 208 INGETEAM: PRODUCT LAUNCHES
- TABLE 209 INGETEAM: DEALS
- TABLE 210 TRIOL: COMPANY OVERVIEW
- TABLE 211 TRIOL: PRODUCTS/SOLUTIONS/SERVICES OFFERED
- TABLE 212 TRIOL: DEALS
- TABLE 213 CG POWER AND INDUSTRIAL SOLUTIONS: COMPANY OVERVIEW
- TABLE 214 CG POWER AND INDUSTRIAL SOLUTIONS: PRODUCTS/SOLUTIONS/SERVICES OFFERED
- TABLE 215 LS ELECTRIC CO., LTD.: COMPANY OVERVIEW
- TABLE 216 LS ELECTRIC CO., LTD.: PRODUCTS/SOLUTIONS/SERVICES OFFERED
- TABLE 217 JOHNSON CONTROLS: COMPANY OVERVIEW
- TABLE 218 JOHNSON CONTROLS: PRODUCTS/SOLUTIONS/SERVICES OFFERED
- TABLE 219 HONEYWELL: COMPANY OVERVIEW
- TABLE 220 HONEYWELL: PRODUCTS/SOLUTIONS/SERVICES OFFERED
- TABLE 221 PARKER HANNIFIN: COMPANY OVERVIEW
- TABLE 222 PARKER HANNIFIN: PRODUCTS/SOLUTIONS/SERVICES OFFERED
- TABLE 223 PARKER HANNIFIN: DEALS
- FIGURE 1 MARKET: RESEARCH DESIGN
- FIGURE 2 DATA TRIANGULATION
- FIGURE 3 MAIN METRICS CONSIDERED TO ANALYZE AND ASSESS DEMAND FOR MARINE VFDS
- FIGURE 4 MARKET SIZE ESTIMATION METHODOLOGY: BOTTOM-UP APPROACH
- FIGURE 5 MARKET SIZE ESTIMATION METHODOLOGY: TOP-DOWN APPROACH
- FIGURE 6 KEY STEPS CONSIDERED TO ASSESS SUPPLY OF MARINE VFDS
- FIGURE 7 MARKET: SUPPLY-SIDE ANALYSIS
- FIGURE 8 COMPANY REVENUE ANALYSIS, 2022
- FIGURE 9 ASIA PACIFIC TO REGISTER HIGHEST CAGR IN MARKET DURING FORECAST PERIOD
- FIGURE 10 RETROFIT SEGMENT TO LEAD MARKET DURING FORECAST PERIOD
- FIGURE 11 LOW VOLTAGE SEGMENT TO DOMINATE MARKET DURING FORECAST PERIOD
- FIGURE 12 MARINE SHIPS SEGMENT TO LEAD MARKET DURING FORECAST PERIOD
- FIGURE 13 PUMP SEGMENT TO LEAD MARKET DURING FORECAST PERIOD
- FIGURE 14 RISING ADOPTION OF ENERGY-EFFICIENT SYSTEMS IN MARITIME SECTOR
- FIGURE 15 ASIA PACIFIC TO REGISTER HIGHEST CAGR DURING FORECAST PERIOD
- FIGURE 16 MARINE SHIPS SEGMENT AND US HELD LARGEST SHARES OF NORTH AMERICAN MARKET IN 2022
- FIGURE 17 RETROFIT SEGMENT TO DOMINATE MARKET IN 2030
- FIGURE 18 LOW VOLTAGE SEGMENT TO ACCOUNT FOR LARGER SHARE OF MARKET IN 2030
- FIGURE 19 MARINE SHIPS SEGMENT TO ACCOUNT FOR LARGER SHARE OF MARKET IN 2030
- FIGURE 20 PUMP SEGMENT TO ACCOUNT FOR LARGEST SHARE OF MARKET IN 2030
- FIGURE 21 MARKET: DRIVERS, RESTRAINTS, OPPORTUNITIES, AND CHALLENGES
- FIGURE 22 GLOBAL MERCHANT VESSEL FLEET, 2018–2023 (NUMBER OF SHIPS)
- FIGURE 23 INCREMENTAL CARGO DEMAND, 2015–2024
- FIGURE 24 USE OF ALTERNATIVE FUELS IN GLOBAL MARINE FLEET, 2022 (NUMBER OF SHIPS)
- FIGURE 25 REVENUE SHIFTS AND NEW REVENUE POCKETS FOR PLAYERS IN MARKET
- FIGURE 26 MARKET: ECOSYSTEM ANALYSIS
- FIGURE 27 MARKET: VALUE CHAIN ANALYSIS
- FIGURE 28 AVERAGE SELLING PRICE (ASP) OF MARINE VFDS, BY VOLTAGE, 2020, 2021, 2022, AND 2030 (USD/UNIT)
- FIGURE 29 AVERAGE SELLING PRICE (ASP) TREND, BY REGION, 2020, 2021, 2022, AND 2030
- FIGURE 30 EXPORT DATA FOR PRODUCTS UNDER HS CODE: 8501, BY KEY COUNTRY, 2020–2022 (USD THOUSAND)
- FIGURE 31 IMPORT DATA FOR PRODUCTS UNDER HS CODE: 8501, BY KEY COUNTRY, 2020–2022 (USD THOUSAND)
- FIGURE 32 MARKET: PORTER’S FIVE FORCES ANALYSIS
- FIGURE 33 INFLUENCE OF STAKEHOLDERS ON BUYING PROCESS FOR TWO KEY END USERS
- FIGURE 34 KEY BUYING CRITERIA FOR TWO KEY END USERS
- FIGURE 35 MARKET, BY APPLICATION, 2022
- FIGURE 36 MARKET, BY TYPE, 2022
- FIGURE 37 MARKET, BY VOLTAGE, 2022
- FIGURE 38 MARKET, BY END USER, 2022
- FIGURE 39 ASIA PACIFIC MARKET TO REGISTER HIGHEST CAGR DURING FORECAST PERIOD
- FIGURE 40 MARKET, BY REGION, 2022 (%)
- FIGURE 41 ASIA PACIFIC: MARINE VFD MARKET SNAPSHOT
- FIGURE 42 EUROPE: MARINE VFD MARKET SNAPSHOT
- FIGURE 43 MARINE VFD MARKET SHARE ANALYSIS, 2022
- FIGURE 44 MARINE VFD MARKET: REVENUE ANALYSIS OF TOP FIVE PLAYERS, 2018–2022
- FIGURE 45 MARINE VFD MARKET: EVALUATION MATRIX OF KEY COMPANIES, 2022
- FIGURE 46 SIEMENS: COMPANY SNAPSHOT
- FIGURE 47 SCHNEIDER ELECTRIC: COMPANY SNAPSHOT
- FIGURE 48 GENERAL ELECTRIC: COMPANY SNAPSHOT
- FIGURE 49 ABB: COMPANY SNAPSHOT
- FIGURE 50 DANFOSS: COMPANY SNAPSHOT
- FIGURE 51 NIDEC: COMPANY SNAPSHOT
- FIGURE 52 WEG: COMPANY SNAPSHOT
- FIGURE 53 ROCKWELL AUTOMATION: COMPANY SNAPSHOT
- FIGURE 54 CG POWER AND INDUSTRIAL SOLUTIONS: COMPANY SNAPSHOT
- FIGURE 55 JOHNSON CONTROLS: COMPANY SNAPSHOT
- FIGURE 56 HONEYWELL: COMPANY SNAPSHOT
- FIGURE 57 PARKER HANNIFIN: COMPANY SNAPSHOT
The study involved major activities in estimating the current size of the marine VFD market. Exhaustive secondary research was done to collect information on the peer and parent markets. The next step was to validate these findings, assumptions, and sizing with industry experts across the value chain through primary research. Both top-down and bottom-up approaches were employed to estimate the complete market size. Thereafter, market breakdown and data triangulation were used to estimate the market size of the segments and subsegments.
Secondary Research
This research study on the marine VFD market involved the use of extensive secondary sources, directories, and databases, such as Hoovers, Bloomberg, Businessweek, Factiva, International Energy Agency, and BP Statistical Review of World Energy, to identify and collect information useful for a technical, market-oriented, and commercial study of the global marine VFD market. The other secondary sources included annual reports, press releases & investor presentations of companies, white papers, certified publications, articles by recognized authors, manufacturer associations, trade directories, and databases.
Primary Research
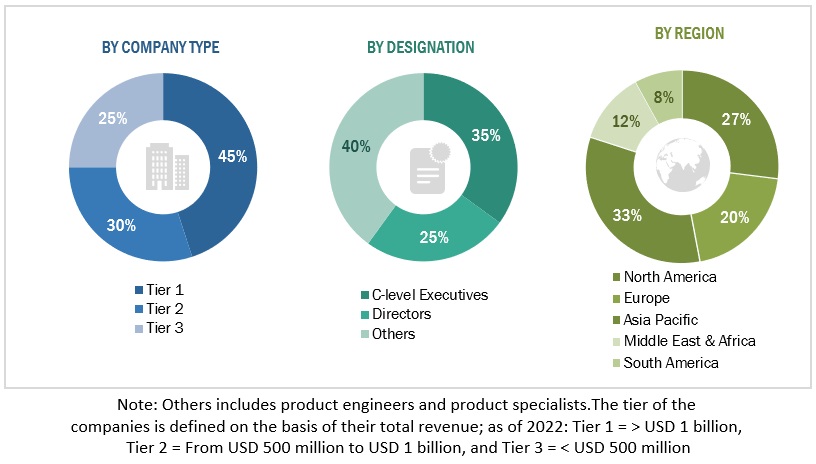
The marine VFD market comprises several stakeholders such as marine VFD manufacturers, manufacturers of subcomponents of marine VFD, manufacturing technology providers, and technology support providers in the supply chain. The demand side of this market is characterized by the rising demand for uninterrupted power supply from end users. Moreover, the demand is also driven by the rising demand from shipbuilding industry. The supply side is characterized by rising demand for contracts from the industrial sector, and deals & agreements among big players. Various primary sources from both the supply and demand sides of the market were interviewed to obtain qualitative and quantitative information. Following is the breakdown of primary respondents:
To know about the assumptions considered for the study, download the pdf brochure
Market Size Estimation
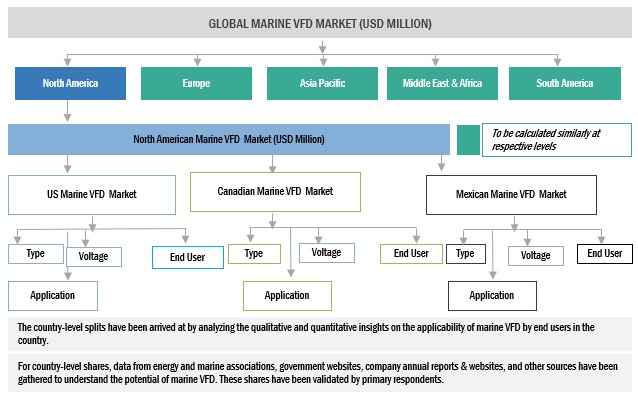
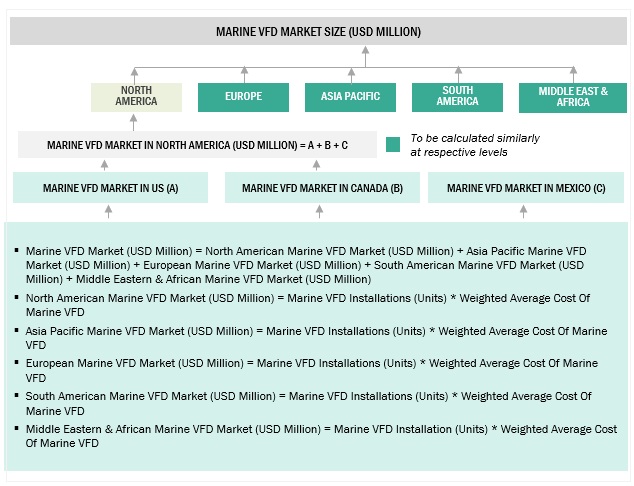
Both top-down and bottom-up approaches were used to estimate and validate the total size of the marine VFD market. These methods were also used extensively to estimate the size of various subsegments in the market. The research methodology used to estimate the market size includes the following:
- The key players in the industry and market have been identified through extensive secondary research, and their market share in the respective regions have been determined through both primary and secondary research.
- The industry’s value chain and market size, in terms of value, have been determined through primary and secondary research processes.
- All percentage shares, splits, and breakdowns have been determined using secondary sources and verified through primary sources.
Global Marine VFD Market Size: Top-down Approach
To know about the assumptions considered for the study, Request for Free Sample Report
Global Marine VFD Market Size: Bottom-Up Approach
Data Triangulation
After arriving at the overall market size from the estimation process explained above, the total market has been split into several segments and subsegments. To complete the overall market engineering process and arrive at the exact statistics for all the segments and subsegments, the data triangulation and market breakdown processes have been employed, wherever applicable. The data has been triangulated by studying various factors and trends from both the demand- and supply sides. Along with this, the market has been validated using both the top-down and bottom-up approaches.
Market Definition
Marine variable frequency drives (VFDs) are specialized devices used for controlling electric motor speed and torque in maritime settings. They optimize propulsion in ships and boats, offering energy efficiency by adjusting motor speed to match the load. VFDs provide precise control, reducing wear on motors and components through gradual speed changes. They replace mechanical systems, conserving space and weight. They are used for automatic speed adjustment, which ensures optimal performance. Marine VFDs are vital for efficient, controlled electric propulsion in modern watercraft, enhancing maneuverability and reducing energy consumption.
Key Stakeholders
- Associations, forums, and alliances related to marine VFD ecosystem
- Marine VFD manufacturing companies
- Cruise and passenger transport companies
- Consulting companies in the maritime sector
- Government and research organizations
- Marine vessel manufacturers
- Renewable energy associations
- Environmental associations
- International shipping and sea trading organizations
- Shipbuilding industry
- Vessel designers, owners, and operators
- Investment banks
- Original equipment manufacturers (OEMs)
Objectives of the Study
- To define, describe, segment, and forecast the marine VFD market, in terms of value and volume, on the basis of type, voltage, application, end user, and region
- To forecast the market size for five key regions: North America, South America, Europe, Asia Pacific, and Middle East & Africa, along with their key countries
- To provide detailed information about the key drivers, restraints, opportunities, and challenges influencing the growth of the market
- To strategically analyze the subsegments with respect to individual growth trends, prospects, and contributions of each segment to the overall market size
- To analyze market opportunities for stakeholders and the competitive landscape of the market
- To strategically profile the key players and comprehensively analyze their market shares and core competencies
- To analyze competitive developments, such as deals and agreements in the market
Available Customizations:
With the given market data, MarketsandMarkets offers customizations as per the client’s specific needs. The following customization options are available for this report:
Geographic Analysis
- Further breakdown of region or country-specific analysis
Company Information
- Detailed analyses and profiling of additional market players (up to 5)


 Generating Response ...


Growth opportunities and latent adjacency in Marine VFD Market