loT Middleware Market with Impact of Gen AI, by Platform (Device Management, Application Management, Connectivity Management, Data Management, and Security Management), Vertical (Government & Defense, Manufacturing, BFSI) - Global Forecast to 2029
IoT Middleware Market Overview
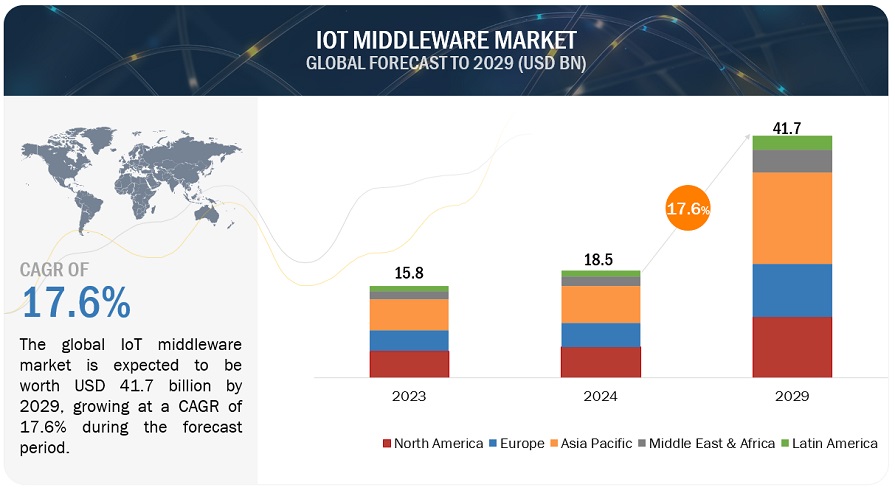
The IoT Middleware Market size was valued at US$15.8 billion in 2023 and is projected to grow from US$18.5 billion in 2024 to US$41.7 billion in 2029 at a CAGR of 17.6% during the forecast period.
Owing to the escalating IoT system, IoT middleware is quickly assuming the role of a vital software layer that oversees the relay of messages between the IoT devices and networks, besides powering the IoT applications. The ongoing trends reveal a significant focus on using cloud and edge computing for data processing in real-time and increased capacity. The development of more advanced IoT applications is supported by the increase in bandwidth and low latency due to the advent of 5G technology, thus favoring IoT middleware. Also, emphasis is placed on security and compatibility. In this context, middleware products have become more competent, using artificial intelligence and machine learning to control large amounts of information more effectively. This means there will be continuous growth in the need for IoT middleware platforms as organizations in different industries forge ahead with digitizing their activities.
To know about the assumptions considered for the study, Request for Free Sample Report
To know about the assumptions considered for the study, download the pdf brochure
IMPACT OF AI/GEN AI ON THE IOT MIDDLEWARE MARKET
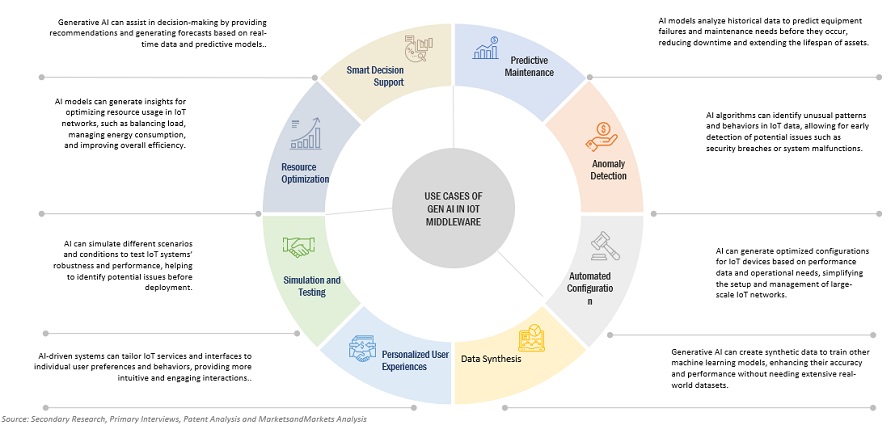
The middleware for IoT systems will be revolutionized by generative AI (Gen AI), thereby increasing system sophistication and innovation. Gen AI helps perform elaborate work, enhance data management, predict and maintain IoT devices and systems, and make decisions. It produces advanced models and algorithms to improve the analysis of connected systems in a real-time fashion and increase accuracy. IoT adoption across industries will help integrate Gen AI into IoT middleware, enhancing more intelligent, secure, and scalable solutions, leading to the growth of the IoT middleware market.
IoT Middleware Market Dynamics
Driver: Blockchain-enabled IoT
loT systems that have previously been implemented have used databases as their core, where data collected from users can be easily hacked or manipulated. Blockchain solves these issues by providing an environment with its decentralized ledger that is resistant to alterations and offers secure cryptography to generate a record of the transactions and interactions on a peer-to-peer network. This decentralization also decreases the effects of points of failure, tampering, and fraud since information is not favored in one familiar spot. For instance, IBM and Maersk’s TradeLens leverage blockchain to handle a constantly growing record of every supply chain transaction, consequently enhancing accountability. Moreover, the capability of blockchain to maintain secure device identities, besides using smart contracts to configure the processes of the loT middleware, is another improvement since it entails fewer administrative processes.>
Restraint: Integration with legacy systems
The devices in each organization are usually kept for many years because their parts are easily accessible. They have remained in the business environment for quite some time because replacing them would be very costly. Connecting mainframe systems with new systems requires a lot of effort and time, and it also leads to an increase in the operating costs of business entities. The integration process results in significant problems if systems are well-designed and coordinated, business rules are understood, or data need to be standardized. The main concern of the integration process is the proper completion of the implementation process within a definite time and the exclusion of the risks connected with it: most integration projects face the problem of implementation delay. Another consideration is the accuracy of data, which is vital in data migration and integration with legacy systems; therefore, significant planning is done before attempting the integration of legacy systems.
Opportunity: Increasing shift toward outcome and pull economies
The outcome economy is based on the development of pay-per-outcome, which means that the customer is offered to pay for the worth of the product depending on the quality and time of delivery of services. Organizations must move from sequential and single-organization supply chains to value-based digital ecosystems to achieve competitiveness. Interconnectivity of gadgets and software systems within the loT environment may help pool info and facilitate inter-industrial cooperation, improving business relations and knowledge.
The pull economy is centered on three significant elements. The first aspect is PDCA’s continuing demand sensing, using modern methods of analysis to generate a market need forecast and all the certainties of the supply chain. The second area is complex automation at the end-to-end, which links devices with every other business process for optimized business performance. The third is where business defines such issues as resource utilization and minimizing wasteful processes.
Challenge: Data security and privacy issues related to IoT devices
Mature verticals are attempting to advance their business and manufacturing processes and analyze and predict the performance of the machines by using new-generation technologies like loT, Al, and cloud. One of the significant challenges while integrating the system is the need for a qualified and experienced workforce to optimally deploy technologies of the loT process. Due to changes in the economy, companies are experiencing a need for digital skills in their workers, affecting their operations and productivity. For instance, a survey conducted by The British Chambers of Commerce (BCC) revealed that more than three-fourths of companies need help finding the right digital talent in the marketplace. Also, the absence of protocol standards challenges some organizations in integrating the devices they connect into the legacy system. As the loT technology has successfully proceeded with operational integration within the industries, it is still in the initial stage.
Market Ecosystem
The IoT middleware market is highly competitive and comprises many vendors who offer solutions to a specific or niche market segment. In recent years, several changes have occurred in the IoT middleware market. Currently, vendors are involved in various partnerships and collaborations to develop comprehensive solutions that address a wide range of requirements. Microsoft(US), IBM (US), PTC (US), AWS (US), SAP (Germany), Cisco (US), Google (US), Hitachi (Japan), HPE (US), Bosch (Germany), Oracle (US), etc. are some of the major players operating in this ecosystem.
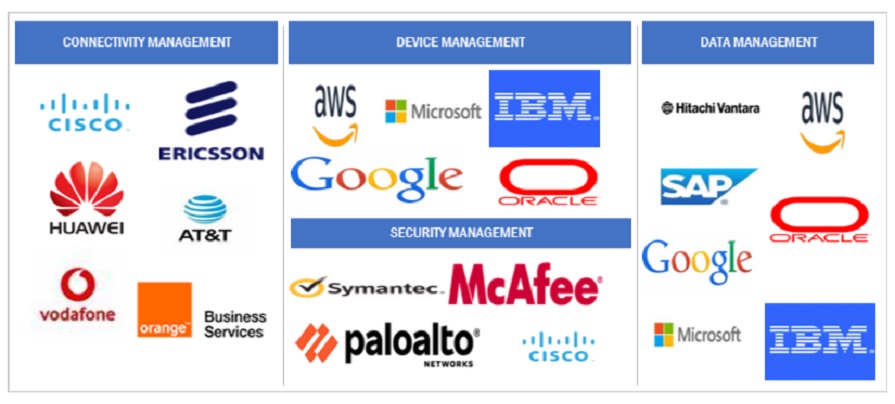
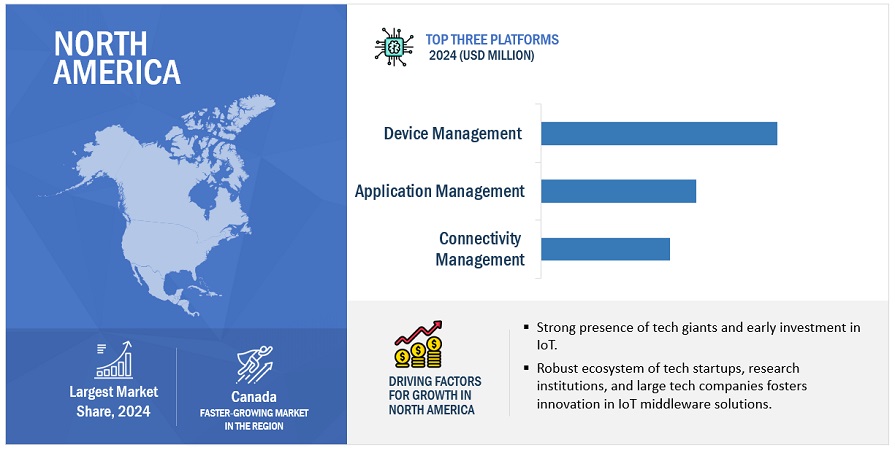
The device management platform type will contribute the largest market share in the IoT middleware market during the forecast period.
With the growing number of IoT ecosystems that interconnect a vast array of devices, including low-power sensors and simple microcontrollers, as well as other complex systems that connect devices to server gateways, it is imperative to employ a single platform in handling information and applications across these chains. Configuration and control, monitoring and diagnostics, as well as updates and software maintenance, are some of the major capabilities that device management platforms include, including related capabilities like provisioning and authentication. These platforms also feature superior capabilities such as activation certification, device configuration, monitoring, problem-solving, and service enablers. With device management platforms, all connected devices within organizations may be controlled, monitored, and protected. These platforms allow active and distant management of connected objects and their concomitant hardware and software as soon as objects and operations are incorporated.
Based on region, North America is expected to contribute the second-largest share in the IoT middleware market.
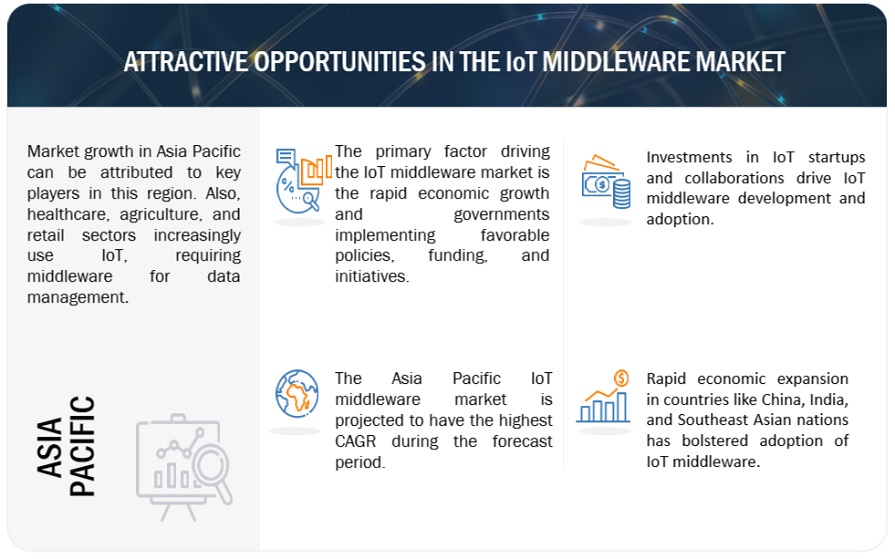
North America holds the second-largest share of the IoT middleware market. The IoT middleware market in North America is explicitly influenced by the high usage of IoT in the manufacturing and service industries in the US and Canada. These nations boast of stable and developed economies in which they can invest significantly in research and innovation, leading to the development of such great technologies. Major players such as IBM, Cisco, and Microsoft take the front row and provide IoT solutions from one or more industries. In particular, recent partnerships with the Canadian government and Quebec are critical for developing IoT, improving the region’s ICT environment, and growth of innovations.
List Top IoT Middleware Market Companies:
The major Companies in the IoT middleware market are Microsoft (US), IBM (US), PTC (US), AWS (US), SAP (Germany), Cisco (US), HPE (US), Bosch (Germany), Oracle (US), etc. These players have adopted various growth strategies such as partnerships, agreements, product launches, and enhancements to expand their footprint in the IoT middleware market.
Scope of the Report
|
Report Metrics |
Details |
|
Market size available for years |
2019–2029 |
|
Base year considered |
2023 |
|
Forecast period |
2024–2029 |
|
Forecast units |
Value (USD) Million/Billion |
|
Segments Covered |
By Platform Type, Vertical, and Region |
|
Region covered |
North America, Europe, Asia Pacific, Middle East & Africa, and Latin America |
|
Top IoT Middleware Market Companies covered |
The major players in the IoT middleware market are Microsoft (US), IBM (US), PTC (US), Cisco (US), AWS (US), SAP (Germany), Google (US), Hitachi (Japan), Oracle (US), HPE (US), Bosch (Germany), Siemens (Germany), GE (US), Schneider Electric (US), Software AG (Germany), Aeris Communication (US), Salesforce (US), Atos (France), ClearBlade (US), Davra Networks (US), Axiros (Germany), Eurotech (Italy), Litmus Automation (US), Ayla Networks (US), SumatoSoft (US), QiO Technologies (UK), Particle Industries (US), and Exosite (US). |
This research report categorizes the IoT middleware market to forecast revenues and analyze trends in each of the following submarkets:
Based on Platform Type:
- Device Management
- Application Management
- Connectivity Management
- Data Management
- Security Management
Based on Vertical:
- Government & Defense
- Manufacturing
- BFSI
- Transportation & Logistics
- Energy & Utilities
- Healthcare
- Retail
- Other Vertical (Agriculture, Tourism And Hospitality, IT and Telecom, And Education)
By Region:
-
North America
- United States (US)
- Canada
-
Europe
- United Kingdom (UK)
- Germany
- France
- Italy
- Spain
- Nordics
- Rest of Europe
-
Asia Pacific
- China
- Japan
- India
- Australia & New Zealand
- Southeast Asia
- Rest of Asia Pacific
-
Middle East and Africa
-
GCC Countries
- UAE
- KSA
- Rest of GCC Countries
- South Africa
- Rest of the Middle East & Africa
-
GCC Countries
-
Latin America
- Brazil
- Mexico
- Rest of Latin America
Recent Developments
- In May 2024, Hitachi and Google Cloud announced a multi-year partnership to accelerate enterprise innovation and productivity with generative AI. Through this partnership, Hitachi will further accelerate the growth of Lumada, its core digital business, and advance operational efficiencies for the Hitachi Group.
- In April 2024, Cloud Software Group and Microsoft signed an eight-year strategic partnership agreement. This agreement will strengthen the go-to-market collaboration for the Citrix virtual application and desktop platform and support the development of new cloud and AI solutions with an integrated product roadmap.
- In September 2023, AWS collaborated with InterVision, fueling InterVision’s strategy and vision to expand and accelerate cloud adoption and modernization across its public sector and commercial customer base.
- In June 2023, PTC and Rockwell Automation announced an extension of their partnership, focused on adopting Internet of Things (IoT) and augmented reality (AR) software.
Frequently Asked Questions (FAQ):
What is the definition of the IoT middleware market?
The IoT middleware market comprises software platforms that bridge the gap between IoT devices and applications. IoT middleware provides a standardized set of APIs, protocols, and tools that abstract the underlying complexities of hardware, operating systems, and communication protocols, allowing developers to focus on building innovative IoT applications. Key functions of IoT middleware include device management, application enablement, connectivity management, data management, security management, and the ability to integrate with legacy systems. The IoT middleware market caters to the growing demand for interoperable, scalable, and secure IoT infrastructure across manufacturing, healthcare, transportation & logistics, energy & utilities, etc.
What is the market size of the IoT middleware market?
The IoT middleware market size is projected to grow from USD 18.5 billion in 2024 to USD 41.7 billion by 2029, at a CAGR of 17.6% during the forecast period.
What are the major drivers in the IoT middleware market?
The IoT middleware market is driven by increased system integration in the IoT domain, a higher data generation rate from IoT devices, and the need for efficient data processing. The need to integrate IoT devices, the scalability of solutions, and protection from external threats are key factors propelling the use of middleware platforms. Also, the rise in awareness of data privacy laws and regulations and their adherence to proper data solutions drive the market's growth.
Who are the key players operating in the IoT middleware market?
The major players in the IoT middleware market are Microsoft (US), IBM (US), PTC (US), Cisco (US), AWS (US), SAP (Germany), Google (US), Hitachi (Japan), Oracle (US), HPE (US), Bosch (Germany), Siemens (Germany), GE (US), Schneider Electric (US), Software AG (Germany), Aeris Communication (US), Salesforce (US), Atos (France), ClearBlade (US), Davra Networks (US), Axiros (Germany), Eurotech (Italy), Litmus Automation (US), Ayla Networks (US), SumatoSoft (US), QiO Technologies (UK), Particle Industries (US), and Exosite (US). These players have adopted various growth strategies, such as partnerships, agreements, collaborations, product launches, enhancements, and acquisitions, to expand their footprint in the IoT middleware market.
What are the opportunities for new market entrants in the IoT middleware market?
The IoT middleware market presents substantial opportunities for new entrants. IoT emerges as an ecosystem, and as the systems incorporated into it become more complex, there will be a growing need for specific middleware. Some areas still have densely packed competition, but conventional opportunities are more significant in edge computing, or AI, and other analytical or vertical-focused middleware platforms where it is less of a problem to compete for a share of the action as a startup or small vendor. In addition, to build the technology niches and attract customers who require secure and compliant services, newcomers must emphasize security issues, private data regulation, and handling. .
To speak to our analyst for a discussion on the above findings, click Speak to Analyst


- 5.1 INTRODUCTION
-
5.2 MARKET DYNAMICSDRIVERS- Increasing focus on blockchain-enabled IoT- Emergence of 5G & edge computing- Growing need for centralized monitoring- Increasing adoption of cloudRESTRAINTS- Integration complexity with legacy systems- Absence of uniform IoT standards and lack of interoperability- Concerns over data security and privacyOPPORTUNITIES- Increasing shift toward outcome and pull economies- Rising adoption of IoT in SMEsCHALLENGES- Lack of skilled workforce- Implementation and security challenges
- 5.3 EVOLUTION OF IOT MIDDLEWARE
-
5.4 ECOSYSTEM ANALYSIS
-
5.5 CASE STUDY ANALYSISCASE STUDY 1: LUFTHANSA TECHNIK USES ENTERPRISE PLM TO SUSTAIN AVIATION EXCELLENCECASE STUDY 2: NESTLE SCALES TO 2.8 MILLION CONNECTED DEVICES WITH AWS IOTCASE STUDY 3: ENSURING SUSTAINABLE WATER UTILITY SERVICES IN JAPAN WITH HITACHI’S ADVANCED SOLUTIONSCASE STUDY 4: ORACLE CLOUD HELPS TITAN INTERNATIONAL TRANSFORM INTO SMART CONNECTED MANUFACTURER
- 5.6 VALUE CHAIN ANALYSIS
-
5.7 REGULATORY LANDSCAPEREGULATORY BODIES, GOVERNMENT AGENCIES, AND OTHER ORGANIZATIONS- International Telecommunication Union (ITU)- Internet of Things Consortium (IoTC)- North America- Europe- Asia Pacific- Middle East & Africa- Latin America
-
5.8 PATENT ANALYSISMETHODOLOGYLIST OF MAJOR PATENTS
-
5.9 TECHNOLOGY ANALYSISKEY TECHNOLOGIES- 5G- Wi-Fi- Communication protocolsCOMPLEMENTARY TECHNOLOGIES- Edge computing- Artificial intelligence (AI) and machine learning (ML)- BlockchainADJACENT TECHNOLOGIES- Augmented reality (AR) and virtual reality (VR)- Big data analytics- Cybersecurity solutions
-
5.10 PRICING ANALYSISAVERAGE SELLING PRICE TREND OF KEY PLAYERS, BY IOT PLATFORMINDICATIVE PRICING ANALYSIS, BY SUBSCRIPTION TYPE
-
5.11 PORTER’S FIVE FORCES MODELTHREAT OF NEW ENTRANTSTHREAT OF SUBSTITUTESBARGAINING POWER OF BUYERSBARGAINING POWER OF SUPPLIERSINTENSITY OF COMPETITIVE RIVALRY
-
5.12 TRENDS/DISRUPTIONS IMPACTING CUSTOMER BUSINESS
-
5.13 KEY STAKEHOLDERS AND BUYING CRITERIAKEY STAKEHOLDERS IN BUYING PROCESSBUYING CRITERIA
-
5.14 CURRENT AND EMERGING BUSINESS MODELSCURRENT BUSINESS MODELSEMERGING BUSINESS MODELS
-
5.15 KEY CONFERENCES AND EVENTS, 2024–2025
-
5.16 TECHNOLOGY ROADMAP FOR IOT MIDDLEWARE MARKETIOT MIDDLEWARE TECHNOLOGY ROADMAP TILL 2030- Short-term roadmap (2023–2025)- Mid-term roadmap (2026–2028)- Long-term roadmap (2028–2030)
- 5.17 BEST PRACTICES IN IOT MIDDLEWARE MARKET
- 5.18 TOOLS, FRAMEWORKS, AND TECHNIQUES USED IN IOT MIDDLEWARE SOLUTIONS
-
5.19 INVESTMENT AND FUNDING SCENARIO
-
5.20 IMPACT OF GENERATIVE AI ON IOT MIDDLEWARE MARKETINTEGRATING GENERATIVE AI IN IOT MIDDLEWAREUSE CASES OF GENERATIVE AI IN IOT MIDDLEWAREBEST PRACTICES TO LEVERAGE GENERATIVE AI FOR IOT MIDDLEWARETRENDS OF GENERATIVE AI IN IOT MIDDLEWAREFUTURE OF GENERATIVE AI IN IOT MIDDLEWARE
-
6.1 INTRODUCTIONPLATFORM TYPE: MARKET DRIVERS
-
6.2 DEVICE MANAGEMENTHELPS ORGANIZATIONS IN EFFECTIVELY MANAGING AND TRACKING, AND SECURING DEVICES
-
6.3 APPLICATION MANAGEMENTPLATFORM ADDRESSES NEEDS SUCH AS INTELLIGENT PRODUCT ENHANCEMENTS, LOWER COSTS, RESOURCE OPTIMIZATION, AND REDUCED WASTAGE
-
6.4 DATA MANAGEMENTHELPS ANALYZE DATA WITH MACHINE LEARNING AND ALGEBRAICAL CALCULATIONS
-
6.5 CONNECTIVITY MANAGEMENTPROVIDES CENTRALIZED MONITORING, HELPING ORGANIZATIONS TO MANAGE VARIOUS PROCESSES OPTIMALLY
-
6.6 SECURITY MANAGEMENTSECURES IOT ECOSYSTEM AGAINST CYBER THREATS
-
7.1 INTRODUCTIONVERTICAL: MARKET DRIVERS
-
7.2 MANUFACTURINGIOT HELPS IN FACTORY AUTOMATION, INDUSTRY 4.0 AND HELPS ORGANIZATIONS STREAMLINE BUSINESS PROCESSES AND OPTIMIZE OPERATIONSMANUFACTURING: USE CASES
-
7.3 GOVERNMENT & DEFENSEOPPORTUNITIES TO CREATE SMART CITIES, IMPROVE CITY PLANNING, AND CONTROL WATER AND WASTE MANAGEMENTGOVERNMENT & DEFENSE: USE CASES
-
7.4 TRANSPORTATION & LOGISTICSIOT PLATFORMS HELP AUTOMOTIVE INDUSTRY IMPROVE OPERATIONAL EFFICIENCY, REDUCING DOWNTIME AND LOWERING COSTSTRANSPORTATION & LOGISTICS: USE CASES
-
7.5 ENERGY & UTILITIESIMPLEMENTATION OF IOT SOLUTIONS ACROSS ORGANIZATIONAL PROCESSES OPTIMIZES SUPPLY CHAIN, ENHANCES ASSET MONITORING & MAINTENANCE, AND INCREASES POTENTIAL RETURN ON IOT INVESTMENTSENERGY & UTILITIES: USE CASES
-
7.6 HEALTHCAREIOT IN HEALTHCARE HAS WIDENED DUE TO RISING ADOPTION OF WIRELESS DEVICESHEALTHCARE: USE CASES
-
7.7 RETAILIOT PLATFORMS ENABLE RETAIL CHAINS TO BE CONNECTED CENTRALLY TO IMPROVE ORDER AND INVENTORY MANAGEMENTRETAIL: USE CASES
-
7.8 BANKING, FINANCIAL SERVICES, AND INSURANCEIOT TECHNOLOGIES ENHANCE USER EXPERIENCE, REDUCE OPERATIONAL COSTS, AND OFFER PERSONALIZED SERVICESBANKING, FINANCIAL SERVICES, AND INSURANCE: USE CASES
- 7.9 OTHER VERTICALS
- 8.1 INTRODUCTION
-
8.2 NORTH AMERICAMACROECONOMIC OUTLOOK FOR NORTH AMERICAUS- Presence of major IoT solution providers in US to drive marketCANADA- Rising investment in smart city initiatives to promote adoption of IoT technologies in Canada
-
8.3 EUROPEMACROECONOMIC OUTLOOK FOR EUROPEUK- Government funding for R&D to drive market in UKGERMANY- Manufacturing industry has been pivotal in driving growth of German marketFRANCE- Rising investment in smart grids and cities to drive French marketITALY- Italy progressing in IoT applications, especially in smart city and energy management projectsSPAIN- Adoption of IoT middleware across various sectors to drive market in SpainNORDIC COUNTRIES- Growing focus on smart and sustainable IoT middleware to drive market in Nordic countriesREST OF EUROPE
-
8.4 ASIA PACIFICMACROECONOMIC OUTLOOK FOR ASIA PACIFICCHINA- Development of IoT with advanced Internet infrastructure and innovative applications to drive market growth in ChinaJAPAN- Japan’s cost-effective IoT platforms in cloud allow smaller companies to grow their operations with improved connectivity optionsINDIA- Growing e-commerce industry in India to drive marketAUSTRALIA & NEW ZEALAND- Deployment of 5G and adoption of AI, cloud, and big data to drive market growth in ANZSOUTH KOREA- Rising 5G adoption to allow IoT applications to flourish with increased data usage and improved effectivenessREST OF ASIA PACIFIC
-
8.5 MIDDLE EAST & AFRICAMACROECONOMIC OUTLOOK FOR MIDDLE EAST & AFRICAGCC COUNTRIES- UAE- KSA- Rest of GCC countriesSOUTH AFRICA- Popularity of mobile application-based IoT middleware solutions to drive marketREST OF MIDDLE EAST & AFRICA
-
8.6 LATIN AMERICAMACROECONOMIC OUTLOOK FOR LATIN AMERICABRAZIL- Government initiatives to develop and accelerate the adoption of IoT in BrazilMEXICO- Popularity of mobile application-based IoT middleware solutions to drive market in MexicoREST OF LATIN AMERICA

- 9.1 INTRODUCTION
-
9.2 KEY PLAYER STRATEGIES/RIGHT TO WIN, 2023OVERVIEW OF STRATEGIES ADOPTED BY KEY IOT MIDDLEWARE MARKET VENDORS
- 9.3 REVENUE ANALYSIS
- 9.4 MARKET SHARE ANALYSIS
-
9.5 COMPANY EVALUATION MATRIX: KEY PLAYERS, 2023STARSEMERGING LEADERSPERVASIVE PLAYERSPARTICIPANTSCOMPANY FOOTPRINT: KEY PLAYERS, 2023
-
9.6 COMPANY EVALUATION MATRIX: STARTUPS/SMES, 2023PROGRESSIVE COMPANIESRESPONSIVE COMPANIESDYNAMIC COMPANIESSTARTING BLOCKSCOMPETITIVE BENCHMARKING: STARTUPS/SMES
-
9.7 COMPETITIVE SCENARIO AND TRENDSPRODUCT LAUNCHESDEALS
- 9.8 BRAND/PRODUCT COMPARISON
- 9.9 COMPANY VALUATION AND FINANCIAL METRICS
-
10.1 KEY PLAYERSMICROSOFT- Business overview- Products/Solutions/Services offered- Recent developments- MnM viewIBM- Business overview- Products/Solutions/Services offered- Recent developments- MnM viewCISCO- Business overview- Products/Solutions/Services offered- Recent developments- MnM viewAMAZON WEB SERVICES- Business overview- Products/Solutions/Services offered- Recent developments- MnM viewPTC- Business overview- Products/Solutions/Services offered- Recent developments- MnM viewSAP- Business overview- Products/Solutions/Services offered- Recent developmentsHITACHI- Business overview- Platforms/Solutions/Services offered- Recent developmentsORACLE- Business overview- Products/Solutions/Services offered- Recent developmentsGOOGLE- Business overview- Products/Solutions/Services offered- Recent developmentsBOSCH- Business overview- Products/Solutions/Services offered- Recent developmentsHPESIEMENSGESCHNEIDER ELECTRICSOFTWARE AGAERIS COMMUNICATIONSSALESFORCEATOS
-
10.2 STARTUPS/SMESCLEARBLADEDAVRA NETWORKSAXIROSEUROTECHLITMUS AUTOMATIONAYLA NETWORKSSUMATOSOFTQIO TECHNOLOGIESEXOSITEPARTICLE INDUSTRIES, INC.
- 11.1 INTRODUCTION
-
11.2 IOT MARKET – GLOBAL FORECAST TO 2026MARKET DEFINITIONMARKET OVERVIEW- IoT market, by component- IoT market, by organization size- IoT market, by focus area- IoT market, by region
-
11.3 IOT IN MANUFACTURING MARKET – GLOBAL FORECAST TO 2026MARKET DEFINITIONMARKET OVERVIEW- IoT in manufacturing market, by component- IoT in manufacturing market, by solution- IoT in manufacturing market, by service- IoT in manufacturing market, by deployment mode- IoT in manufacturing market, by organization size- IoT in manufacturing market, by application- IoT in manufacturing market, by vertical- IoT in manufacturing market, by region
- 12.1 DISCUSSION GUIDE
- 12.2 KNOWLEDGESTORE: MARKETSANDMARKETS’ SUBSCRIPTION PORTAL
- 12.3 CUSTOMIZATION OPTIONS
- 12.4 RELATED REPORTS
- 12.5 AUTHOR DETAILS
- TABLE 1 USD EXCHANGE RATES, 2021–2023
- TABLE 2 KEY PRIMARY INTERVIEW PARTICIPANTS
- TABLE 3 RESEARCH ASSUMPTIONS
- TABLE 4 RISK ASSESSMENT
- TABLE 5 IOT MIDDLEWARE MARKET: ECOSYSTEM
- TABLE 6 NORTH AMERICA: REGULATORY BODIES, GOVERNMENT AGENCIES, AND OTHER ORGANIZATIONS
- TABLE 7 EUROPE: REGULATORY BODIES, GOVERNMENT AGENCIES, AND OTHER ORGANIZATIONS
- TABLE 8 ASIA PACIFIC: LIST OF REGULATORY BODIES, GOVERNMENT AGENCIES, AND OTHER ORGANIZATIONS
- TABLE 9 REST OF THE WORLD: REGULATORY BODIES, GOVERNMENT AGENCIES, AND OTHER ORGANIZATIONS
- TABLE 10 AVERAGE SELLING PRICE OF KEY PLAYERS FOR IOT PLATFORMS (USD)
- TABLE 11 INDICATIVE PRICING ANALYSIS OF IOT, BY SUBSCRIPTION TYPE (USD)
- TABLE 12 IMPACT OF EACH FORCE ON IOT MIDDLEWARE MARKET
- TABLE 13 INFLUENCE OF STAKEHOLDERS ON BUYING PROCESS FOR TOP THREE VERTICALS
- TABLE 14 KEY BUYING CRITERIA FOR TOP THREE VERTICALS
- TABLE 15 IOT MIDDLEWARE MARKET: DETAILED LIST OF CONFERENCES AND EVENTS, 2024–2025
- TABLE 16 MARKET, BY PLATFORM TYPE, 2019–2023 (USD MILLION)
- TABLE 17 IOT MIDDLEWARE MARKET, BY PLATFORM TYPE, 2024–2029 (USD MILLION)
- TABLE 18 DEVICE MANAGEMENT: MARKET, BY REGION, 2019–2023 (USD MILLION)
- TABLE 19 DEVICE MANAGEMENT: MARKET, BY REGION, 2024–2029 (USD MILLION)
- TABLE 20 APPLICATION MANAGEMENT: MARKET, BY REGION, 2019–2023 (USD MILLION)
- TABLE 21 APPLICATION MANAGEMENT: MARKET, BY REGION, 2024–2029 (USD MILLION)
- TABLE 22 DATA MANAGEMENT: MARKET, BY REGION, 2019–2023 (USD MILLION)
- TABLE 23 DATA MANAGEMENT: MARKET, BY REGION, 2024–2029 (USD MILLION)
- TABLE 24 CONNECTIVITY MANAGEMENT: MARKET, BY REGION, 2019–2023 (USD MILLION)
- TABLE 25 CONNECTIVITY MANAGEMENT: MARKET, BY REGION, 2024–2029 (USD MILLION)
- TABLE 26 SECURITY MANAGEMENT: MARKET, BY REGION, 2019–2023 (USD MILLION)
- TABLE 27 SECURITY MANAGEMENT: MARKET, BY REGION, 2024–2029 (USD MILLION)
- TABLE 28 IOT MIDDLEWARE MARKET, BY VERTICAL, 2019–2023 (USD MILLION)
- TABLE 29 MARKET, BY VERTICAL, 2024–2029 (USD MILLION)
- TABLE 30 MANUFACTURING: MARKET, BY REGION, 2019–2023 (USD MILLION)
- TABLE 31 MANUFACTURING: MARKET, BY REGION, 2024–2029 (USD MILLION)
- TABLE 32 GOVERNMENT & DEFENSE: MARKET, BY REGION, 2019–2023 (USD MILLION)
- TABLE 33 GOVERNMENT & DEFENSE: MARKET, BY REGION, 2024–2029 (USD MILLION)
- TABLE 34 TRANSPORTATION & LOGISTICS: MARKET, BY REGION, 2019–2023 (USD MILLION)
- TABLE 35 TRANSPORTATION & LOGISTICS: MARKET, BY REGION, 2024–2029 (USD MILLION)
- TABLE 36 ENERGY & UTILITIES: MARKET, BY REGION, 2019–2023 (USD MILLION)
- TABLE 37 ENERGY & UTILITIES: MARKET, BY REGION, 2024–2029 (USD MILLION)
- TABLE 38 HEALTHCARE: MARKET, BY REGION, 2019–2023 (USD MILLION)
- TABLE 39 HEALTHCARE: MARKET, BY REGION, 2024–2029 (USD MILLION)
- TABLE 40 RETAIL: MARKET, BY REGION, 2019–2023 (USD MILLION)
- TABLE 41 RETAIL: MARKET, BY REGION, 2024–2029 (USD MILLION)
- TABLE 42 BANKING, FINANCIAL SERVICES, AND INSURANCE: MARKET, BY REGION, 2019–2023 (USD MILLION)
- TABLE 43 BANKING, FINANCIAL SERVICES, AND INSURANCE: MARKET, BY REGION, 2024–2029 (USD MILLION)
- TABLE 44 OTHER VERTICALS: MARKET, BY REGION, 2019–2023 (USD MILLION)
- TABLE 45 OTHER VERTICALS: MARKET, BY REGION, 2024–2029 (USD MILLION)
- TABLE 46 MARKET, BY REGION, 2019–2023 (USD MILLION)
- TABLE 47 MARKET, BY REGION, 2024–2029 (USD MILLION)
- TABLE 48 NORTH AMERICA: IOT MIDDLEWARE MARKET, BY PLATFORM TYPE, 2019–2023 (USD MILLION)
- TABLE 49 NORTH AMERICA: MARKET, BY PLATFORM TYPE, 2024–2029 (USD MILLION)
- TABLE 50 NORTH AMERICA: MARKET, BY VERTICAL, 2019–2023 (USD MILLION)
- TABLE 51 NORTH AMERICA: MARKET, BY VERTICAL, 2024–2029 (USD MILLION)
- TABLE 52 NORTH AMERICA: MARKET, BY COUNTRY, 2019–2023 (USD MILLION)
- TABLE 53 NORTH AMERICA: MARKET, BY COUNTRY, 2024–2029 (USD MILLION)
- TABLE 54 US: MARKET, BY PLATFORM TYPE, 2019–2023 (USD MILLION)
- TABLE 55 US: MARKET, BY PLATFORM TYPE, 2024–2029 (USD MILLION)
- TABLE 56 US: MARKET, BY VERTICAL, 2019–2023 (USD MILLION)
- TABLE 57 US: MARKET, BY VERTICAL, 2024–2029 (USD MILLION)
- TABLE 58 EUROPE: MARKET, BY PLATFORM TYPE, 2019–2023 (USD MILLION)
- TABLE 59 EUROPE: MARKET, BY PLATFORM TYPE, 2024–2029 (USD MILLION)
- TABLE 60 EUROPE: IOT MIDDLEWARE MARKET, BY VERTICAL, 2019–2023 (USD MILLION)
- TABLE 61 EUROPE: MARKET, BY VERTICAL, 2024–2029 (USD MILLION)
- TABLE 62 EUROPE: MARKET, BY COUNTRY, 2019–2023 (USD MILLION)
- TABLE 63 EUROPE: MARKET, BY COUNTRY, 2024–2029 (USD MILLION)
- TABLE 64 UK: MARKET, BY PLATFORM TYPE, 2019–2023 (UKD MILLION)
- TABLE 65 UK: MARKET, BY PLATFORM TYPE, 2024–2029 (UKD MILLION)
- TABLE 66 UK: MARKET, BY VERTICAL, 2019–2023 (UKD MILLION)
- TABLE 67 UK: MARKET, BY VERTICAL, 2024–2029 (UKD MILLION)
- TABLE 68 GERMANY: MARKET, BY PLATFORM TYPE, 2019–2023 (USD MILLION)
- TABLE 69 GERMANY: MARKET, BY PLATFORM TYPE, 2024–2029 (USD MILLION)
- TABLE 70 GERMANY: MARKET, BY VERTICAL, 2019–2023 (USD MILLION)
- TABLE 71 GERMANY: MARKET, BY VERTICAL, 2024–2029 (USD MILLION)
- TABLE 72 ITALY: MARKET, BY PLATFORM TYPE, 2019–2023 (USD MILLION)
- TABLE 73 ITALY: MARKET, BY PLATFORM TYPE, 2024–2029 (USD MILLION)
- TABLE 74 ITALY: MARKET, BY VERTICAL, 2019–2023 (USD MILLION)
- TABLE 75 ITALY: MARKET, BY VERTICAL, 2024–2029 (USD MILLION)
- TABLE 76 ASIA PACIFIC: MARKET, BY PLATFORM TYPE, 2019–2023 (USD MILLION)
- TABLE 77 ASIA PACIFIC: IOT MIDDLEWARE MARKET, BY PLATFORM TYPE, 2024–2029 (USD MILLION)
- TABLE 78 ASIA PACIFIC: MARKET, BY VERTICAL, 2019–2023 (USD MILLION)
- TABLE 79 ASIA PACIFIC: MARKET, BY VERTICAL, 2024–2029 (USD MILLION)
- TABLE 80 ASIA PACIFIC: MARKET, BY COUNTRY, 2019–2023 (USD MILLION)
- TABLE 81 ASIA PACIFIC: MARKET, BY COUNTRY, 2024–2029 (USD MILLION)
- TABLE 82 CHINA: MARKET, BY PLATFORM TYPE, 2019–2023 (USD MILLION)
- TABLE 83 CHINA: MARKET, BY PLATFORM TYPE, 2024–2029 (USD MILLION)
- TABLE 84 CHINA: MARKET, BY VERTICAL, 2019–2023 (USD MILLION)
- TABLE 85 CHINA: MARKET, BY VERTICAL, 2024–2029 (USD MILLION)
- TABLE 86 INDIA: MARKET, BY PLATFORM TYPE, 2019–2023 (USD MILLION)
- TABLE 87 INDIA: MARKET, BY PLATFORM TYPE, 2024–2029 (USD MILLION)
- TABLE 88 INDIA: MARKET, BY VERTICAL, 2019–2023 (USD MILLION)
- TABLE 89 INDIA: MARKET, BY VERTICAL, 2024–2029 (USD MILLION)
- TABLE 90 MIDDLE EAST & AFRICA: IOT MIDDLEWARE MARKET, BY PLATFORM TYPE, 2019–2023 (USD MILLION)
- TABLE 91 MIDDLE EAST & AFRICA: MARKET, BY PLATFORM TYPE, 2024–2029 (USD MILLION)
- TABLE 92 MIDDLE EAST & AFRICA: MARKET, BY VERTICAL, 2019–2023 (USD MILLION)
- TABLE 93 MIDDLE EAST & AFRICA: MARKET, BY VERTICAL, 2024–2029 (USD MILLION)
- TABLE 94 MIDDLE EAST & AFRICA: MARKET, BY COUNTRY, 2019–2023 (USD MILLION)
- TABLE 95 MIDDLE EAST & AFRICA: MARKET, BY COUNTRY, 2024–2029 (USD MILLION)
- TABLE 96 MIDDLE EAST & AFRICA: MARKET, BY GCC COUNTRY, 2019–2023 (USD MILLION)
- TABLE 97 MIDDLE EAST & AFRICA: MARKET, BY GCC COUNTRY, 2024–2029 (USD MILLION)
- TABLE 98 KSA: MARKET, BY PLATFORM TYPE, 2019–2023 (USD MILLION)
- TABLE 99 KSA: MARKET, BY PLATFORM TYPE,2024–2029 (USD MILLION)
- TABLE 100 KSA: IOT MIDDLEWARE MARKET, BY VERTICAL, 2019–2023 (USD MILLION)
- TABLE 101 KSA: MARKET, BY VERTICAL, 2024–2029 (USD MILLION)
- TABLE 102 LATIN AMERICA: MARKET, BY PLATFORM TYPE, 2019–2023 (USD MILLION)
- TABLE 103 LATIN AMERICA: MARKET, BY PLATFORM TYPE, 2024–2029 (USD MILLION)
- TABLE 104 LATIN AMERICA: MARKET, BY VERTICAL, 2019–2023 (USD MILLION)
- TABLE 105 LATIN AMERICA: MARKET, BY VERTICAL, 2024–2029 (USD MILLION)
- TABLE 106 LATIN AMERICA: IOT MIDDLEWARE MARKET, BY COUNTRY, 2019–2023 (USD MILLION)
- TABLE 107 LATIN AMERICA: MARKET, BY COUNTRY, 2024–2029 (USD MILLION)
- TABLE 108 BRAZIL: MARKET, BY PLATFORM TYPE, 2019–2023 (USD MILLION)
- TABLE 109 BRAZIL: MARKET, BY PLATFORM TYPE, 2024–2029 (USD MILLION)
- TABLE 110 BRAZIL: MARKET, BY VERTICAL, 2019–2023 (USD MILLION)
- TABLE 111 BRAZIL: MARKET, BY VERTICAL, 2024–2029 (USD MILLION)
- TABLE 112 MARKET: DEGREE OF COMPETITION
- TABLE 113 IOT MIDDLEWARE MARKET: VERTICAL FOOTPRINT
- TABLE 114 MARKET: PLATFORM TYPE FOOTPRINT
- TABLE 115 MARKET: REGION FOOTPRINT
- TABLE 116 IOT MIDDLEWARE MARKET: DETAILED LIST OF KEY STARTUPS/SMES
- TABLE 117 MARKET: COMPETITIVE BENCHMARKING OF KEY STARTUPS/SMES
- TABLE 118 IOT MIDDLEWARE MARKET: PRODUCT LAUNCHES, JANUARY 2023–JULY 2024
- TABLE 119 IOT MIDDLEWARE MARKET: DEALS, JANUARY 2023–JULY 2024
- TABLE 120 MICROSOFT: COMPANY OVERVIEW
- TABLE 121 MICROSOFT: PRODUCTS/SOLUTIONS/SERVICES OFFERED
- TABLE 122 MICROSOFT: PRODUCT LAUNCHES
- TABLE 123 MICROSOFT: DEALS
- TABLE 124 IBM: COMPANY OVERVIEW
- TABLE 125 IBM: PRODUCTS/SOLUTIONS/SERVICES OFFERED
- TABLE 126 IBM: DEALS
- TABLE 127 CISCO: COMPANY OVERVIEW
- TABLE 128 CISCO: PRODUCTS/SOLUTIONS/SERVICES OFFERED
- TABLE 129 CISCO: PRODUCT LAUNCHES
- TABLE 130 CISCO: DEALS
- TABLE 131 AMAZON WEB SERVICES: COMPANY OVERVIEW
- TABLE 132 AMAZON WEB SERVICES: PRODUCTS/SOLUTIONS/SERVICES OFFERED
- TABLE 133 AMAZON WEB SERVICES: DEALS
- TABLE 134 PTC: COMPANY OVERVIEW
- TABLE 135 PTC: PRODUCTS/SOLUTIONS/SERVICES OFFERED
- TABLE 136 PTC: DEALS
- TABLE 137 SAP: COMPANY OVERVIEW
- TABLE 138 SAP: PRODUCTS/SOLUTIONS/SERVICES OFFERED
- TABLE 139 SAP: DEALS
- TABLE 140 HITACHI: COMPANY OVERVIEW
- TABLE 141 HITACHI: DEALS
- TABLE 142 ORACLE: COMPANY OVERVIEW
- TABLE 143 ORACLE: PRODUCTS/SOLUTIONS/SERVICES OFFERED
- TABLE 144 ORACLE: DEALS
- TABLE 145 GOOGLE: COMPANY OVERVIEW
- TABLE 146 GOOGLE: PRODUCTS/SOLUTIONS/SERVICES OFFERED
- TABLE 147 GOOGLE: DEALS
- TABLE 148 BOSCH: COMPANY OVERVIEW
- TABLE 149 BOSCH: PRODUCTS/SOLUTIONS/SERVICES OFFERED
- TABLE 150 BOSCH: DEALS
- TABLE 151 IOT MARKET, BY COMPONENT, 2015–2020 (USD BILLION)
- TABLE 152 IOT MARKET, BY COMPONENT, 2021–2026 (USD BILLION)
- TABLE 153 IOT MARKET, BY ORGANIZATION SIZE, 2015–2020 (USD BILLION)
- TABLE 154 IOT MARKET, BY ORGANIZATION SIZE, 2021–2026 (USD BILLION)
- TABLE 155 IOT MARKET, BY FOCUS AREA, 2015–2020 (USD BILLION)
- TABLE 156 IOT MARKET, BY FOCUS AREA, 2021–2026 (USD BILLION)
- TABLE 157 IOT MARKET, BY REGION, 2015–2020 (USD BILLION)
- TABLE 158 IOT MARKET, BY REGION, 2021–2026 (USD BILLION)
- TABLE 159 IOT IN MANUFACTURING MARKET, BY COMPONENT, 2016–2020 (USD MILLION)
- TABLE 160 IOT IN MANUFACTURING MARKET, BY COMPONENT 2021–2026 (USD MILLION)
- TABLE 161 IOT IN MANUFACTURING MARKET, BY SOLUTION, 2016–2020 (USD MILLION)
- TABLE 162 IOT IN MANUFACTURING MARKET, BY SOLUTION, 2021–2026 (USD MILLION)
- TABLE 163 IOT IN MANUFACTURING MARKET, BY SERVICE, 2016–2020 (USD MILLION)
- TABLE 164 IOT IN MANUFACTURING MARKET, BY SERVICE, 2021–2026 (USD MILLION)
- TABLE 165 IOT IN MANUFACTURING MARKET, BY DEPLOYMENT MODE, 2016–2020 (USD MILLION)
- TABLE 166 IOT IN MANUFACTURING MARKET, BY DEPLOYMENT MODE, 2021–2026 (USD MILLION)
- TABLE 167 IOT IN MANUFACTURING MARKET, BY ORGANIZATION SIZE, 2016–2020 (USD MILLION)
- TABLE 168 IOT IN MANUFACTURING MARKET, BY ORGANIZATION SIZE, 2021–2026 (USD MILLION)
- TABLE 169 IOT IN MANUFACTURING MARKET, BY APPLICATION, 2016–2020 (USD MILLION)
- TABLE 170 IOT IN MANUFACTURING MARKET, BY APPLICATION, 2021–2026 (USD MILLION)
- TABLE 171 IOT IN MANUFACTURING MARKET, BY VERTICAL, 2016–2020 (USD MILLION)
- TABLE 172 IOT IN MANUFACTURING MARKET, BY VERTICAL, 2021–2026 (USD MILLION)
- TABLE 173 IOT IN MANUFACTURING MARKET, BY REGION, 2016–2020 (USD MILLION)
- TABLE 174 IOT IN MANUFACTURING MARKET, BY REGION, 2021–2026 (USD MILLION)
- FIGURE 1 IOT MIDDLEWARE MARKET: RESEARCH DESIGN
- FIGURE 2 BREAKDOWN OF PRIMARY INTERVIEWS, BY COMPANY TYPE, DESIGNATION, AND REGION
- FIGURE 3 DATA TRIANGULATION
- FIGURE 4 TOP-DOWN APPROACH
- FIGURE 5 MARKET SIZE ESTIMATION METHODOLOGY – APPROACH 1 (SUPPLY SIDE): REVENUE OF VENDORS IN IOT MIDDLEWARE MARKET
- FIGURE 6 BOTTOM-UP APPROACH
- FIGURE 7 BOTTOM-UP (SUPPLY SIDE) ANALYSIS: COLLECTIVE REVENUE FROM PLATFORMS OF IOT MIDDLEWARE MARKET
- FIGURE 8 IOT MIDDLEWARE MARKET, 2022–2029
- FIGURE 9 MARKET: REGIONAL SNAPSHOT
- FIGURE 10 RAPID GROWTH OF CONNECTED DEVICES ACROSS INDUSTRIES TO DRIVE MARKET
- FIGURE 11 DEVICE MANAGEMENT PLATFORM AND US TO ACCOUNT FOR LARGE SHARES IN NORTH AMERICAN IOT MIDDLEWARE MARKET IN 2024
- FIGURE 12 DEVICE MANAGEMENT PLATFORM AND CHINA TO ACCOUNT FOR LARGE SHARES IN ASIA PACIFIC IOT MIDDLEWARE MARKET IN 2024
- FIGURE 13 IOT MIDDLEWARE MARKET: DRIVERS, RESTRAINTS, OPPORTUNITIES, AND CHALLENGES
- FIGURE 14 EVOLUTION OF IOT MIDDLEWARE
- FIGURE 15 IOT MIDDLEWARE MARKET: ECOSYSTEM
- FIGURE 16 IOT MIDDLEWARE MARKET: VALUE CHAIN ANALYSIS
- FIGURE 17 LIST OF MAJOR PATENTS FOR IOT MIDDLEWARE
- FIGURE 18 AVERAGE SELLING PRICE TREND OF KEY PLAYERS FOR IOT PLATFORMS (USD)
- FIGURE 19 IOT MIDDLEWARE MARKET: PORTER’S FIVE FORCES MODEL
- FIGURE 20 TRENDS/DISRUPTIONS IMPACTING CUSTOMER BUSINESS
- FIGURE 21 INFLUENCE OF STAKEHOLDERS ON BUYING PROCESS FOR TOP THREE VERTICALS
- FIGURE 22 KEY BUYING CRITERIA FOR TOP THREE VERTICALS
- FIGURE 23 IOT MIDDLEWARE MARKET: INVESTMENT AND FUNDING SCENARIO
- FIGURE 24 USE CASES OF GENERATIVE AI IN IOT MIDDLEWARE
- FIGURE 25 CONNECTIVITY MANAGEMENT TO REGISTER HIGHEST CAGR DURING FORECAST PERIOD
- FIGURE 26 HEALTHCARE SEGMENT TO REGISTER HIGHEST CAGR DURING FORECAST PERIOD
- FIGURE 27 NORTH AMERICA: MARKET SNAPSHOT
- FIGURE 28 ASIA PACIFIC: MARKET SNAPSHOT
- FIGURE 29 REVENUE ANALYSIS FOR KEY COMPANIES IN PAST 3 YEARS
- FIGURE 30 SHARE OF LEADING COMPANIES IN IOT MIDDLEWARE MARKET, 2023
- FIGURE 31 IOT MIDDLEWARE MARKET: COMPANY EVALUATION MATRIX (KEY PLAYERS), 2023
- FIGURE 32 IOT MIDDLEWARE MARKET: COMPANY FOOTPRINT
- FIGURE 33 MARKET: COMPANY EVALUATION MATRIX (STARTUPS/SMES), 2023
- FIGURE 34 BRAND/PRODUCT COMPARISON
- FIGURE 35 FINANCIAL METRICS OF KEY IOT MIDDLEWARE MARKET VENDORS
- FIGURE 36 COMPANY VALUATION OF KEY IOT MIDDLEWARE MARKET VENDORS
- FIGURE 37 MICROSOFT: COMPANY SNAPSHOT
- FIGURE 38 IBM: COMPANY SNAPSHOT
- FIGURE 39 CISCO: COMPANY SNAPSHOT
- FIGURE 40 AMAZON WEB SERVICES: COMPANY SNAPSHOT
- FIGURE 41 PTC: COMPANY SNAPSHOT
- FIGURE 42 SAP: COMPANY SNAPSHOT
- FIGURE 43 HITACHI: COMPANY SNAPSHOT
- FIGURE 44 ORACLE: COMPANY SNAPSHOT
- FIGURE 45 GOOGLE: COMPANY SNAPSHOT
- FIGURE 46 BOSCH: COMPANY SNAPSHOT
The research study involved four major activities in estimating the IoT middleware market size. Exhaustive secondary research has been done to collect important information about the market and peer markets. The next step has been to validate these findings and assumptions and size them with the help of primary research with industry experts across the value chain. Both top-down and bottom-up approaches have been used to estimate the market size. Post which the market breakdown and data triangulation have been adopted to estimate the market sizes of segments and sub-segments.
Secondary Research
The market size of the companies offering IoT middleware solutions to various end users was arrived at based on the secondary data available through paid and unpaid sources and by analyzing the product portfolios of major companies in the ecosystem and rating the companies based on their performance and quality. In the secondary research process, various sources were referred to identify and collect information for the study. The secondary sources included annual reports, press releases, investor presentations of companies, white papers, journals, certified publications, and articles from recognized authors, directories, and databases. Several journals and associations were referred to, such as the IoT World Alliance, Global System for Mobile Communications (GSMA), and the Industry IoT Consortium (IIC).
Secondary research was mainly used to obtain critical information about industry insights, the market’s monetary chain, the overall pool of key players, market classification, and segmentation according to industry trends to the bottom-most level, regional markets, and key developments from both market- and technology-oriented perspectives.
Primary Research
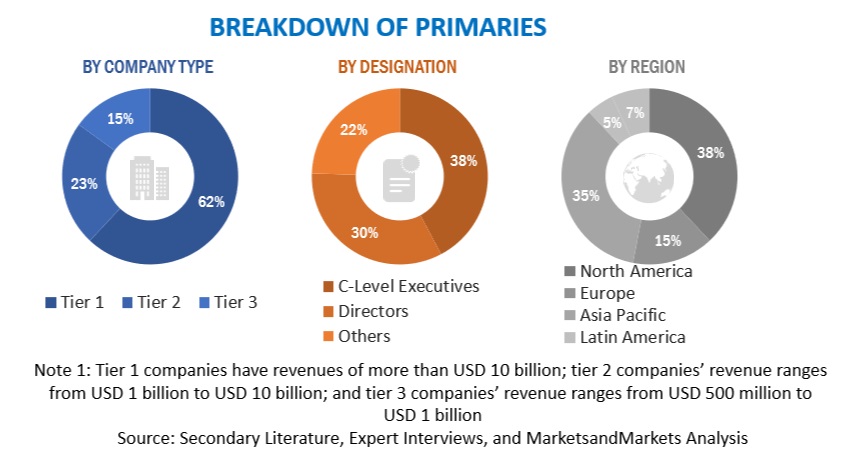
In the primary research process, various sources from the supply and demand sides were interviewed to obtain qualitative and quantitative information for the report, Such as Chief Experience Officers (CXOs), Vice Presidents (VPs), directors from business development, marketing, and product development/innovation teams, and related key executives from IoT middleware solution vendors, system integrators, professional and managed service providers, industry associations, independent consultants, and key opinion leaders.
Primary interviews were conducted to gather insights, such as market statistics, data on revenue collected from software and services, market breakups, market size estimations, market forecasts, and data triangulation. Stakeholders from the demand side, such as Chief Information Officers (CIOs), Chief Finance Officers (CFOs), Chief Strategy Officers (CSOs), and the installation team of end users who use IoT middleware, were interviewed to understand buyers’ perspectives on suppliers, products, service providers, and their current usage of IoT middleware solutions which is expected to affect the overall IoT middleware market growth.
To know about the assumptions considered for the study, download the pdf brochure
Market Size Estimation
In the market engineering process, the top-down and bottom-up approaches were used along with multiple data triangulation methods to estimate and validate the size of the IoT middleware market and other dependent submarkets. The research methodology used to estimate the market sizes includes the following:
- Initially, MarketsandMarkets focuses on top-line investments and spending in the ecosystems. Further, significant developments in the critical market area have been considered.
- Tracking the recent and upcoming developments in the IoT middleware market that include investments, R&D activities, product launches, collaborations, mergers and acquisitions, and partnerships, as well as forecasting the market size based on these developments and other critical parameters.
- Conduct multiple discussions with key opinion leaders to learn about the diverse types of authentications and brand protection offerings used and the applications for which they are used to analyze the breakdown of the scope of work carried out by major companies.
- Segmenting the market based on technology types concerning applications wherein the types are to be used and deriving the size of the global application market.
- Segmenting the overall market into various market segments
- Validating the estimates at every level through discussions with key opinion leaders, such as chief executives (CXOs), directors, and operation managers, and finally with the domain experts at MarketsandMarkets
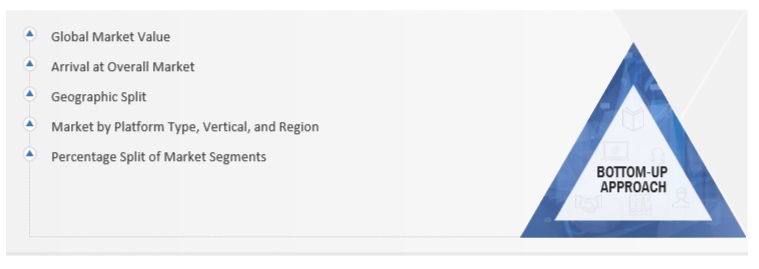
Market Size Estimation Methodology-Bottom-up approach
To know about the assumptions considered for the study, Request for Free Sample Report
Market Size Estimation Methodology-top-down approach
Data Triangulation
The IoT middleware market has been split into segments and sub-segments after the overall market size was estimated using the above estimation process. To complete the overall market engineering process and arrive at the exact statistics for all segments and sub-segments, data triangulation and market breakdown procedures have been used, wherever applicable. The data has been triangulated by studying various factors and trends from both the demand and supply sides.
The IoT middleware market size has been validated using top-down and bottom-up approaches.
Market Definition
The IoT Middleware market comprises software platforms that bridge the gap between IoT devices and applications. IoT middleware provides a standardized set of APIs, protocols, and tools that abstract the underlying complexities of hardware, operating systems, and communication protocols, allowing developers to focus on building innovative IoT applications. Key functions of IoT middleware include device management, application enablement, connectivity management, data management, security management, and the ability to integrate with legacy systems. The IoT Middleware market caters to the growing demand for interoperable, scalable, and secure IoT infrastructure across manufacturing, healthcare, transportation & logistics, energy & utilities, etc.
Stakeholders
- IoT middleware providers
- IoT platform providers
- IoT connectivity providers
- Technology providers
- Consulting and advisory firms
- Regional and global government organizations
- Independent software vendors (ISVs)
- Value-added resellers (VARs) and distributors
- System integrators
Report Objectives
- To determine and forecast the global IoT middleware market by platform type, vertical, and region from 2024 to 2029 and analyze the various macroeconomic and microeconomic factors affecting the market growth.
- To forecast the size of the market segments concerning five central regions: North America, Europe, Asia Pacific (APAC), Middle East & Africa (MEA), and Latin America.
- To provide detailed information about the major factors (drivers, restraints, opportunities, and challenges) influencing the growth of the IoT middleware market.
- Analyze each submarket concerning individual growth trends, prospects, and contributions to the overall IoT middleware market.
- To analyze the opportunities in the market for stakeholders by identifying the high-growth segments of the IoT middleware market.
- To profile the key market players; provide a comparative analysis based on business overviews, regional presence, product offerings, business strategies, and key financials; and illustrate the market’s competitive landscape.
- Track and analyze competitive developments in the market, such as mergers and acquisitions, product developments, partnerships and collaborations, and Research and Development (R&D) activities.
Available Customizations
With the given market data, MarketsandMarkets offers customizations per the company’s specific needs. The following customization options are available for the report:
Geographic Analysis
- Further break-up of the Asia Pacific market into countries contributing 75% to the regional market size
- Further break-up of the North American market into countries contributing 75% to the regional market size
- Further break-up of the Latin American market into countries contributing 75% to the regional market size
- Further break-up of the Middle East African market into countries contributing 75% to the regional market size
- Further break-up of the European market into countries contributing 75% to the regional market size
Company Information
- Detailed analysis and profiling of additional market players (up to 5)


Growth opportunities and latent adjacency in loT Middleware Market
Interested in middlewares market