Industrial Hydrogen Peroxide Market by Function (Bleaching, Propulsion, Oxidizing), End Use Industry (Pulp & Paper, Chemical Synthesis, Healthcare & Personal Care, Food Processing, Textile), Region - Global Forecast to 2026


The global industrial hydrogen peroxide market was valued at USD 2.38 Billion in 2015, and is projected to reach USD 4.28 Billion by 2026, at a CAGR of 5.53%, from 2016 to 2026.
The base year considered for the study is 2015, while the forecast period is from 2016 to 2026. The objectives of the report are as follows:
- To analyze and forecast the industrial hydrogen peroxide market in terms of volume and value
- To provide detailed information about the key factors (drivers, restraints, opportunities, and challenges) influencing the growth of the market
- To define, describe, and forecast the industrial hydrogen peroxide market based on function, end-use industry, and region
- To forecast the size of the market with respect to five main regions, namely, North America, Europe, Asia-Pacific, South America, and the Middle East & Africa
- To analyze the opportunities in the market for stakeholders and provide a competitive landscape for market leaders
- To analyze competitive developments such as investments & expansions, mergers & acquisitions, agreements, joint ventures & collaborations, and new product launches in the industrial hydrogen peroxide market
- To strategically profile the key players and comprehensively analyze their market shares and core competencies
Both, top-down and bottom-up approaches have been used to estimate and validate the size of the global industrial hydrogen peroxide market and to estimate the sizes of various other dependent submarkets in the overall industrial hydrogen peroxide market. The research study involved the extensive use of secondary sources, directories, and databases such as, Hoovers, Bloomberg, Chemical Weekly, Factiva, and other government and private websites to identify and collect information useful for the technical, market-oriented, and commercial study of the global industrial hydrogen peroxide market.
To know about the assumptions considered for the study, download the pdf brochure
The supply chain of the industrial hydrogen peroxide market starts with the sourcing of basic raw materials, manufacturing and supplying to intermediate product manufacturers, and ends with use in the various end-use applications. 2-ethyl anthraquinone is the main raw material for the production of hydrogen peroxide. Hydrogen peroxide is mostly produced by anthraquinone auto-oxidation process. Some of the main players in the market include, AkzoNobel N.V. (Netherlands), BASF SE (Germany), The Dow Chemical Company (U.S.), Solvay SA (Belgium), Evonik Industries AG (Germany), Ecolab Inc. (U.S.), Kemira Oyj (Finland), Arkema SA (France), Merck Group (Germany), and Mitsubishi Gas Chemical Company, Inc. (Japan).
Key Target Audience:
- Hydrogen peroxide manufacturing companies
- Traders, distributors, and retailers
- Raw material suppliers
- Commercial R&D institutes
- Research institutes, trade associations, and government agencies
Scope of the Report:
This research report categorizes the global industrial hydrogen peroxide market on the basis of function, end-use industry, and region.
On the basis of Function:
- Bleaching
- Oxidizing
- Sterilizing/Disinfecting
- Propulsion
- Others (Etching, Cleaning and Extraction)
On the basis of End-Use Industry:
- Pulp & Paper
- Chemical Synthesis
- Healthcare & Personal Care
- Food Processing
- Textile
- Water & Wastewater Treatment
- Electronics & Semiconductor
- Others (Mining and Metallurgy, Transportation, and Recycling)
On the basis of Region:
- Asia-Pacific
- North America
- South America
- Middle East & Africa
- Europe
The market is further analyzed for the key countries in each of these regions.
Available Customizations:
With the given market data, MarketsandMarkets offers customizations as per the specific needs of the companies. The following customization options are available for the report:
Country Information:
- Industrial hydrogen peroxide market analysis for additional countries
Company Information:
- Detailed analysis and profiles of additional market players (up to five)
Pricing Analysis:
- Detailed pricing analysis of each type of industrial hydrogen peroxide product
Patent Analysis:
- Detailed patent analysis in the industrial hydrogen peroxide market
The global industrial hydrogen peroxide market is projected to reach USD 4.28 Billion by 2026, at a CAGR of 5.53% from 2016 to 2026. Industrial hydrogen peroxide has functions such as, bleaching, oxidizing, sterilizing/disinfecting, propulsion, etching, cleaning and extraction. These functions drive the industrial hydrogen peroxide market globally.
Industrial hydrogen peroxide products find usage in several end-use industries such as, pulp & paper, chemical synthesis, healthcare & personal care, food processing, textile, water & wastewater treatment, electronics & semiconductor and others (mining and metallurgy, transportation and recycling).
The pulp & paper industry accounted for the largest share of the overall industrial hydrogen peroxide market and is expected to continue to do so throughout the forecast period. Industrial hydrogen peroxide is used for bleaching of pulp & paper, as it increases the brightness levels, improves brightness stability and reduces manufacturing cost. In addition to this, it is environment friendly.
Companies are investing in expansions of their production capacities to increase their market shares and cater to the increasing demand for industrial hydrogen peroxide. BASF SE, Solvay SA, and SK chemicals jointly invested in a production plant based in South Korea to build a hydrogen peroxide-to-propylene oxide facility.
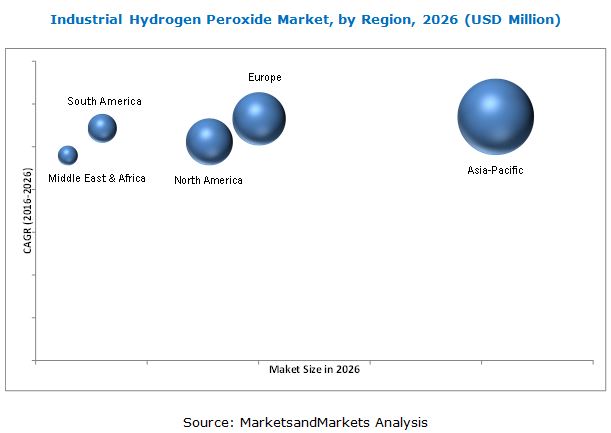
Growth in the pulp & paper and textile industries has increased the demand for industrial hydrogen peroxide. The Asia-Pacific region accounts for the largest share of the global industrial hydrogen peroxide market and is also the fastest-growing market. China is expected to account for the largest share in the Asia-Pacific region till 2026 and has registered the fastest growth rate for the forecast period. Germany is the largest market for industrial hydrogen peroxide in Europe. Major producers of industrial hydrogen peroxide such as, BASF SE (Germany), Evonik Industries AG (Germany), and Merck Group (Germany) are located in Germany.
Exposure of the eyes to concentrations of 5% or more industrial hydrogen peroxide can result in permanent loss of vision, while skin exposure causes painful blisters, burns and skin whitening. These are the restraints in the global industrial hydrogen peroxide market. However, industrial hydrogen peroxide is preferred over other chemicals, as it is environment friendly and reduces manufacturing cost, as it is the only one chemical that is required.
Companies such as, AkzoNobel N.V., BASF SE, Solvay SA, Evonik Industries AG, Kemira Oyj, The Dow Chemicals Company, and Merck Group have adopted the investments & expansions, agreements, joint ventures & collaborations and mergers & acquisitions strategies to expand their market shares and distribution networks in the global industrial hydrogen peroxide market for the forecast period, 2016 to 2026.
To speak to our analyst for a discussion on the above findings, click Speak to Analyst
 Exclusive indicates content/data unique to MarketsandMarkets and not available with any competitors.
Table of Contents
1 Introduction (Page No. - 17)
1.1 Objectives of the Study
1.2 Market Definition
1.3 Market Scope
1.3.1 Years Considered for the Study
1.4 Currency
1.5 Package Size
1.6 Stakeholders
2 Research Methodology (Page No. - 20)
2.1 Research Data
2.2 Secondary Data
2.2.1 Key Data From Secondary Sources
2.3 Primary Data
2.3.1 Key Data From Primary Sources
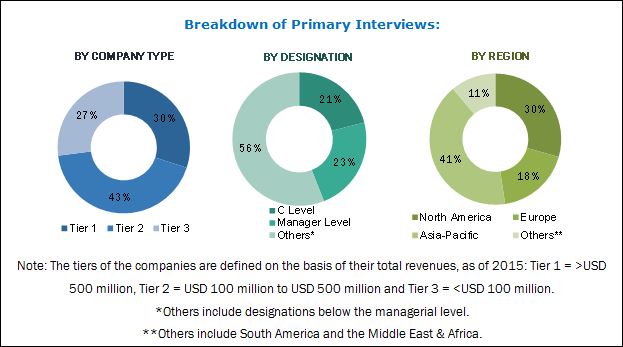
2.3.2 Breakdown of Primary Interviews
2.4 Market Size Estimation
2.5 Data Triangulation
2.6 Research Assumptions and Limitations
2.6.1 Assumptions
2.6.2 Limitations
3 Executive Summary (Page No. - 28)
4 Premium Insights (Page No. - 32)
4.1 Significant Opportunities in the Industrial Hydrogen Peroxide Market
4.2 Asia-Pacific Industrial Hydrogen Peroxide Market, By End-Use Industry and Country
4.3 Fastest-Growing Industrial Hydrogen Peroxide Market
4.4 Industrial Hydrogen Peroxide Market, By End-Use Industry
4.5 Industrial Hydrogen Peroxide Market in Pulp & Paper End-Use Industry
4.6 Industrial Hydrogen Peroxide Market, By Function
5 Market Overview (Page No. - 37)
5.1 Introduction
5.2 Market Evolution
5.3 Market Segmentation
5.3.1 By Function
5.3.2 By End-Use Industry
5.3.3 By Region
5.4 Market Dynamics
5.4.1 Drivers
5.4.1.1 Increasing Demand for Environmental-Friendly Solutions
5.4.1.2 Paradigm Shift From Chlorine to Elemental Chlorine Free (ECF) Chemicals
5.4.1.3 Rising Demand From End-Use Industries
5.4.1.3.1 Growing Use as an Oxidizing Agent in the Chemical Industry
5.4.1.3.2 Increasing Demand From the Gradually Maturing Pulp & Paper Industry
5.4.2 Restraints
5.4.2.1 Exposure of the Eyes to Concentrations of 5% Or More Could Result in Permanent Loss of Vision
5.4.3 Opportunities
5.4.3.1 Emerging Applications in the Semiconductor, Mining & Metal Extraction, and Agriculture Industries
5.4.3.2 Increase in Use of Hydrogen Peroxide for Wastewater Treatment
5.4.4 Challenges
5.4.4.1 Increasing Raw Material Prices and Operating Costs
5.4.4.2 Digitalization to Reduce the Demand for Hydrogen Peroxide From Pulp & Paper Industry
5.5 Impact Analysis
6 Industry Trends (Page No. - 50)
6.1 Introduction
6.2 Supply Chain Analysis
6.3 Porter�s Five Forces
6.3.1 Threat of Substitutes
6.3.2 Threat of New Entrants
6.3.3 Bargaining Power of Suppliers
6.3.4 Bargaining Power of Buyers
6.3.5 Intensity of Competitive Rivalry
7 Patent Analysis (Page No. - 56)
8 Macroeconomic Indicators (Page No. - 58)
8.1 GDP Growth Rate Forecast of Major Economies
8.2 Textile Industry Analysis
8.3 Pulp & Paper Industry Analysis
8.4 Chemical Industry Analysis
9 Global Industrial Hydrogen Peroxide Market, By Function (Page No. - 63)
9.1 Introduction
9.2 Bleaching
9.3 Oxidizing
9.4 Sterilizing/Disinfecting
9.5 Propulsion
9.6 Others
10 Global Industrial Hydrogen Peroxide Market, By End-Use Industry (Page No. - 75)
10.1 Introduction
10.2 Pulp & Paper
10.2.1 Chemical Pulp
10.2.2 Mechanical Pulp
10.2.3 Recycled Pulp
10.3 Chemical Synthesis
10.3.1 Inorganic Derivatives
10.3.1.1 Sodium Perborate
10.3.1.2 Sodium Percarbonate
10.3.2 Organic Derivatives
10.3.2.1 Methyl Ethyl Ketone Peroxides
10.3.2.2 Benzoyl Peroxide
10.4 Healthcare & Personal Care
10.4.1 Healthcare
10.4.2 Personal Care
10.5 Food Processing
10.5.1 Sterilization
10.5.2 Antimicrobial Agent
10.5.3 Oxidizing & Bleaching Agent
10.6 Textile
10.7 Water & Wastewater Treatment
10.8 Electronics & Semiconductor
10.9 Others
10.9.1 Mining & Metallurgy
10.9.2 Transportation
10.9.3 Recycling
11 Global Industrial Hydrogen Peroxide Market, By Region (Page No. - 95)
11.1 Introduction
11.2 Asia-Pacific
11.2.1 China
11.2.2 India
11.2.3 Japan
11.2.4 South Korea
11.2.5 Indonesia
11.2.6 Taiwan
11.2.7 Bangladesh
11.2.8 Rest of Asia-Pacific
11.3 North America
11.3.1 U.S.
11.3.2 Canada
11.3.3 Mexico
11.4 South America
11.4.1 Brazil
11.4.2 Argentina
11.4.3 Chile
11.4.4 Rest of South America
11.5 Middle-East & Africa
11.5.1 Saudi Arabia
11.5.2 UAE
11.5.3 Rest of the Middle-East & Africa
11.6 Europe
11.6.1 Germany
11.6.2 France
11.6.3 Spain
11.6.4 Italy
11.6.5 U.K.
11.6.6 Finland
11.6.7 Rest of the Europe
12 Competitive Landscape (Page No. - 146)
12.1 Overview
12.2 Market Share Analysis
12.3 Competitive Situation and Trends
12.4 Investments and Expansions the Most Popular Growth Strategy Between 2011 and 2016
12.4.1 Investments & Expansions
12.4.2 Agreements, Joint Ventures, & Collaborations
12.4.3 Mergers & Acquisitions
12.4.4 New Product Launches
13 Company Profiles (Page No. - 153)
(Overview, Financial*, Products & Services, Strategy, and Developments)
13.1 Solvay SA
13.2 Evonik Industries AG
13.3 Arkema SA
13.4 Akzonobel N.V.
13.5 BASF SE
13.6 The DOW Chemical Company
13.7 Ecolab Inc. (Nalco Company)
13.8 Kemira OYJ
13.9 Merck Group
13.10 Mitsubishi Gas Chemical Company
13.11 Other Key Market Players
13.11.1 Taekwang Industrial Co., Ltd.
13.11.2 FMC Corp
13.11.3 Thai Peroxide Co. Ltd.
13.11.4 OCI Chemical Corporation
13.11.5 Christeyns
13.11.6 National Peroxide Limited
13.11.7 Shandong Huatai Paper Co. Ltd.
13.11.8 Guangdong Zhongcheng Chemicals Inc.
13.11.9 Kingboard Chemical Holdings Ltd.
13.11.10 Khimprom
*Details Might Not Be Captured in Case of Unlisted Companies.
14 Appendix (Page No. - 179)
14.1 Insights From Industry Experts
14.2 Discussion Guide
14.3 Knowledge Store: Marketsandmarkets Subscription Portal
14.4 Introducing RT: Real Time Market Intelligence
14.5 Available Customizations
14.6 Related Reports
14.7 Author Details
List of Tables (113 Tables)
Table 1 Industrial Hydrogen Peroxide Market, By function
Table 2 Industrial Hydrogen Peroxide Market, By End-Use Industry
Table 3 Oxidation Potential of Hydrogen Peroxide in Comparison to Various Oxidizers
Table 4 Legislations for Hydrogen Peroxide in European Union and U.S.
Table 5 Population Connected to Secondary Urban Wastewater Treatment (2010�2014)
Table 6 Trends and Forecast of GDP Growth Rate, 2016�2020
Table 7 Chemical Production, 2012�2020
Table 8 Global Industrial Hydrogen Peroxide Market Size, By Function, 2014�2026 (USD Million)
Table 9 Global Industrial Hydrogen Peroxide Market Size, By Function, 2014�2026 (Kilotons)
Table 10 Global Industrial Hydrogen Peroxide Market Size in Bleaching Function, By Region, 2014�2026 (USD Million)
Table 11 Global Industrial Hydrogen Peroxide Market Size in Bleaching Function, By Region, 2014�2026 (Kilotons)
Table 12 Global Industrial Hydrogen Peroxide Market Size in Oxidizing Function, By Region, 2014�2026 (USD Million)
Table 13 Global Industrial Hydrogen Peroxide Market Size in Oxidizing Function, By Region, 2014�2026 (Kilotons)
Table 14 Global Industrial Hydrogen Peroxide Market Size in Sterilizing/Disinfecting Function, By Region, 2014�2026 (USD Million)
Table 15 Global Industrial Hydrogen Peroxide Market Size in Sterilizing/Disinfecting Function, By Region, 2014�2026 (Kilotons)
Table 16 Global Industrial Hydrogen Peroxide Market Size in Propulsion Function, By Region, 2014�2026 (USD Million)
Table 17 Global Industrial Hydrogen Peroxide Market Size in Propulsion Function, By Region, 2014�2026 (Kilotons)
Table 18 Global Industrial Hydrogen Peroxide Market Size in Other Functions, By Region, 2014�2026 (USD Million)
Table 19 Global Industrial Hydrogen Peroxide Market Size in Other Functions, By Region, 2014�2026 (Kilotons)
Table 20 Global Industrial Hydrogen Peroxide Market Size, By End-Use Industry, 2014�2026 (USD Million)
Table 21 Global Industrial Hydrogen Peroxide Market Size, By End-Use Industry, 2014�2026 (Kilotons)
Table 22 Global Industrial Hydrogen Peroxide Market Size in Pulp & Paper Industry, By Region, 2014�2026 (USD Million)
Table 23 Global Industrial Hydrogen Peroxide Market Size in Pulp & Paper Industry, By Region, 2014�2026 (Kilotons)
Table 24 Global Industrial Hydrogen Peroxide Market Size in Chemical Synthesis Industry, By Region, 2014�2026 (USD Million)
Table 25 Global Industrial Hydrogen Peroxide Market Size in Chemical Synthesis Industry, By Region, 2014�2026 (Kilotons)
Table 26 Global Industrial Hydrogen Peroxide Market Size in Healthcare & Personal Care Industry, By Region, 2014�2026 (USD Million)
Table 27 Global Industrial Hydrogen Peroxide Market Size in Healthcare & Personal Care Industry, By Region, 2014�2026 (Kilotons)
Table 28 Global Industrial Hydrogen Peroxide Market Size in Food Processing Industry, By Region, 2014�2026 (USD Million)
Table 29 Global Industrial Hydrogen Peroxide Market Size in Food Processing Industry, By Region, 2014�2026 (Kilotons)
Table 30 Global Industrial Hydrogen Peroxide Market Size in Textile Industry, By Region, 2014�2026 (USD Million)
Table 31 Global Industrial Hydrogen Peroxide Market Size in Textile Industry, By Region, 2014�2026 (Kilotons)
Table 32 Global Industrial Hydrogen Peroxide Market Size in Water & Wastewater Treatment Industry, By Region, 2014�2026 (USD Million)
Table 33 Global Industrial Hydrogen Peroxide Market Size in Water and Wastewater Treatment Industry, By Region, 2014�2026 (Kilotons)
Table 34 Global Industrial Hydrogen Peroxide Market Size in Electronics & Semiconductor Industry, By Region, 2014�2026 (USD Million)
Table 35 Glboal Industrial Hydrogen Peroxide Market Size in Electronics & Semiconductor Industry, By Region, 2014�2026 (Kilotons)
Table 36 Global Industrial Hydrogen Peroxide Market Size in Other End-Use Industries, By Region, 2014�2026 (USD Million)
Table 37 Global Industrial Hydrogen Peroxide Market Size in Other End-Use Industries, By Region, 2014�2026 (Kilotons)
Table 38 Global Industrial Hydrogen Peroxide Market Size, By Region, 2014�2026 (USD Million)
Table 39 Global Industrial Hydrogen Peroxide Market Size, By Region, 2014�2026 (Kilotons)
Table 40 Asia-Pacific: By Market Size, By Country, 2014�2026 (USD Million)
Table 41 Asia-Pacific: By Market Size, By Country, 2014�2026 (Kilotons)
Table 42 Asia-Pacific: By Market Size, By End-Use Industry, 2014�2026 (USD Million)
Table 43 Asia-Pacific: By Market Size, By End-Use Industry, 2014�2026 (Kilotons)
Table 44 China: By Market Size, By End-Use Industry, 2014�2026 (USD Million)
Table 45 China: By Market Size, By End-Use Industry, 2014�2026 (Kilotons)
Table 46 India: By Market Size, By End-Use Industry, 2014�2026 (USD Million)
Table 47 India: By Market Size, By End-Use Industry, 2014�2026 (Kilotons)
Table 48 Japan: By Market Size, By End-Use Industry, 2014�2026 (USD Million)
Table 49 Japan: By Market Size, By End-Use Industry, 2014�2026 (Kilotons)
Table 50 South Korea: By Market Size, By End-Use Industry, 2014�2026 (USD Million)
Table 51 South Korea: By Market Size, By End-Use Industry, 2014�2026 (Kilotons)
Table 52 Indonesia: By Market Size, By End-Use Industry, 2014�2026 (USD Million)
Table 53 Indonesia: By Market Size, By End-Use Industry, 2014�2026 (Kilotons)
Table 54 Taiwan: By Market Size, By End-Use Industry, 2014�2026 (USD Million)
Table 55 Taiwan: By Market Size, By End-Use Industry, 2014�2026 (Kilotons)
Table 56 Bangladesh: By Market Size, By End-Use Industry, 2014�2026 (USD Million)
Table 57 Bangladesh: By Market Size, By End-Use Industry, 2014�2026 (Kilotons)
Table 58 Rest of Asia-Pacific: By Market Size, By End-Use Industry, 2014�2026 (USD Million)
Table 59 Rest of Asia-Pacific: By Market Size, By End-Use Industry, 2014�2026 (Kilotons)
Table 60 North America: By Market Size, By Country, 2014�2026 (USD Million)
Table 61 North America: By Market Size, By Country, 2014�2026 (Kilotons)
Table 62 North America: By Market Size, By End-Use Industry, 2014�2026 (USD Million)
Table 63 North America: By Market Size, By End-Use Industry, 2014�2026 (Kilotons)
Table 64 U.S.: By Market Size, By End-Use Industry, 2014�2026 (USD Million)
Table 65 U.S.: By Market Size, By End-Use Industry, 2014�2026 (Kilotons)
Table 66 Canada: By Market Size, By End-Use Industry, 2014�2026 (USD Million)
Table 67 Canada: By Market Size, By End-Use Industry, 2014�2026 (Kilotons)
Table 68 Mexico: By Market Size, By End-Use Industry, 2014�2026 (USD Million)
Table 69 Mexico: By Market Size, By End-Use Industry, 2014�2026 (Kilotons)
Table 70 South America: By Market Size, By Country, 2014�2026 (USD Million)
Table 71 South America: By Market Size, By Country, 2014�2026 (Kilotons)
Table 72 South America: By Market Size, By End-Use Industry, 2014�2026 (USD Million)
Table 73 South America: By Market Size, By End-Use Industry, 2014�2026 (Kilotons)
Table 74 Brazil: By Market Size, By End-Use Industry, 2014�2026 (USD Million)
Table 75 Brazil: By Market Size, By End-Use Industry, 2014�2026 (Kilotons)
Table 76 Argentina: By Market Size, By End-Use Industry, 2014�2026 (USD Million)
Table 77 Argentina: By Market Size, By End-Use Industry, 2014�2026 (Kilotons)
Table 78 Chile: By Market Size, By End-Use Industry, 2014�2026 (USD Million)
Table 79 Chile: By Market Size, By End-Use Industry, 2014�2026 (Kilotons)
Table 80 Rest of the South America: By Market Size, By End-Use Industry, 2014�2026 (USD Million)
Table 81 Rest of the South America: By Market Size, By End-Use Industry, 2014�2026 (Kilotons)
Table 82 Middle-East & Africa: By Market Size, By Country, 2014�2026 (USD Million)
Table 83 Middle-East & Africa: By Market Size, By Country, 2014�2026 (Kilotons)
Table 84 Middle-East & Africa: By Market Size, By End-Use Industry, 2014�2026 (USD Million)
Table 85 Middle-East & Africa: By Market Size, By End-Use Industry, 2014�2026 (Kilotons)
Table 86 Saudi Arabia: By Market Size, By End-Use Industry, 2014�2026 (USD Million)
Table 87 Saudi Arabia: By Market Size, By End-Use Industry, 2014�2026 (Kilotons)
Table 88 UAE: By Market Size, By End-Use Industry, 2014�2026 (USD Million)
Table 89 UAE: By Market Size, By End-Use Industry, 2014�2026 (Kilotons)
Table 90 Rest of the Middle-East & Africa: By Market Size, By End-Use Industry, 2014�2026 (USD Million)
Table 91 Rest of the Middle-East & Africa: By Market Size, By End-Use Industry, 2014�2026 (Kilotons)
Table 92 Europe: By Market Size, By Country, 2014�2026 (USD Million)
Table 93 Europe: By Market Size, By Country, 2014�2026 (Kilotons)
Table 94 Europe: By Market Size, By End-Use Industry, 2014�2026 (USD Million)
Table 95 Europe: By Market Size, By End-Use Industry, 2014�2026 (Kilotons)
Table 96 Germany: By Market Size, By End-Use Industry, 2014�2026 (USD Million)
Table 97 Germany: By oxide Market Size, By End-Use Industry, 2014�2026 (Kilotons)
Table 98 France: By Market Size, By End-Use Industry, 2014�2026 (USD Million)
Table 99 France: By Market Size, By End-Use Industry, 2014�2026 (Kilotons)
Table 100 Spain: By Market Size, By End-Use Industry, 2014�2026 (USD Million)
Table 101 Spain: By Market Size, By End-Use Industry, 2014�2026 (Kilotons)
Table 102 Italy: By Market Size, By End-Use Industry, 2014�2026 (USD Million)
Table 103 Italy: By Market Size, By End-Use Industry, 2014�2026 (Kilotons)
Table 104 U.K.: By Market Size, By End-Use Industry, 2014�2026 (USD Million)
Table 105 U.K.: By Market Size, By End-Use Industry, 2014�2026 (Kilotons)
Table 106 Finland: By Market Size, By End-Use Industry, 2014�2026 (USD Million)
Table 107 Finland: By Market Size, By End-Use Industry, 2014�2026 (Kilotons)
Table 108 Rest of the Europe: By Market Size, By End-Use Industry, 2014�2026 (USD Million)
Table 109 Rest of the Europe: By Market Size, By End-Use Industry, 2014�2026 (Kilotons)
Table 110 Investments & Expansions, 2011�2015
Table 111 Agreements, Joint Ventures, & Collaborations, 2011�2016
Table 112 Mergers and Acquisitions, 2011�2016
Table 113 New Product Launches, 2011�2016
List of Figures (67 Figures)
Figure 1 Industrial Hydrogen Peroxide: Market Segmentation
Figure 2 Hydrogen Peroxide Market: Research Design
Figure 3 Market Size Estimation: Bottom-Up Approach
Figure 4 Market Size Estimation: Top-Down Approach
Figure 5 Industrial Hydrogen Peroxide: Data Triangulation
Figure 6 Pulp & Paper Industry to Lead Global Industrial Hydrogen Peroxide Market, By Volume, 2016-2021 (Kilotons)
Figure 7 Bleaching Segment to Lead Global Industrial Hydrogen Peroxide Market, By Function, 2015-2021 (USD Million)
Figure 8 Asia-Pacific Led Global Industrial Hydrogen Peroxide Market in 2016
Figure 9 Global Industrial Hydrogen Peroxide Market Size, 2016 vs 2021
Figure 10 China to Lead Asia-Pacific Industrial Hydrogen Peroxide Market, By Country
Figure 11 China to Lead Global Industrial Hydrogen Peroxide Market, By Volume, 2016-2021 (Kilotons)
Figure 12 Pulp & Paper Industry to Lead Global Industrial Hydrogen Peroxide Market, By Volume, 2016�2021 (Kilotons)
Figure 13 Asia-Pacific to Lead Market in Pulp & Paper End-Use Industry, By Volume, 2016�2021 (Kilotons)
Figure 14 Bleaching Segment Accounted for Largest Share in 2015
Figure 15 1818 Marked Discovery of Industrial Hydrogen Peroxide in France
Figure 16 Industrial Hydrogen Peroxide Market, By Region
Figure 17 Increasing Demand From End-Use Industries is Major Market Driver
Figure 18 High Demand for Chemical Pulp in China, 2015
Figure 19 Pulp Production, 1991�2015
Figure 20 Impact Analysis of Drivers and Restraints
Figure 21 Supply Chain Analysis
Figure 22 Porter�s Five Forces Analysis
Figure 23 Japan Accounted for Maximum Patents Between 2013 and 2015
Figure 24 90 Patents Registered By U.S., Europe, and Japan in 2015
Figure 25 World Textile Trade, 2005�2014
Figure 26 World Textile Exports
Figure 27 Global Paper Production, 2013
Figure 28 Global Pulp Capacity, 2014�2019
Figure 29 Country-Wise Wood Pulp Capacity, 2014�2019
Figure 30 Bleaching Accounted for Major Share of Global Industrial Hydrogen Peroxide Market, By Function, 2015 (USD Million)
Figure 31 Asia-Pacific to Lead Bleaching Segment of Global Industrial Hydrogen Peroxide Market, 2016-2021 (USD Million)
Figure 32 Asia-Pacific to Lead Oxidizing Segment of Global Industrial Hydrogen Peroxide Market, 2016-2021 (USD Million)
Figure 33 Europe to Be Second-Largest Market in Sterilizing/Disinfecting Segment, 2016-2021 (USD Million)
Figure 34 Asia-Pacific to Lead Propulsion Segment of Global Industrial Hydrogen Market, 2016-2021 (USD Million)
Figure 35 North America to Be Second-Largest Market in Others Segment, 2016-2021 (USD Million)
Figure 36 Pulp & Paper Segment Held Major Share of Global Industrial Hydrogen Peroxide Market, By End-Use Industry, 2015 (USD Million)
Figure 37 Asia-Pacific to Lead Global Industrial Hydrogen Peroxide Market in Pulp & Paper End-Use Industry, 2016-2021 (USD Million)
Figure 38 Europe to Lead Global Industrial Hydrogen Peroxide Market in Chemical Synthesis End-Use Industry, 2016-2021 (USD Million)
Figure 39 APAC to Lead Global Industrial Hydrogen Peroxide Market in Healthcare & Personal Care End-Use Industry, 2016-2021 (USD Million)
Figure 40 Asia-Pacific to Lead Global Industrial Hydrogen Peroxide Market in Food Processing End-Use Industry, 2016-2021 (USD Million)
Figure 41 North America to Be Second-Largest Global Industrial Hydrogen Peroxide Market in Textile End-Use Industry, 2016-2021 (USD Million)
Figure 42 Asia-Pacific to Lead Global Industrial Hydrogen Peroxide Market in Water & Wastewater Treatment End-Use Industry, 2016-2021 (USD Million)
Figure 43 North America to Be Second-Largest Global Industrial Hydrogen Peroxide Market in Electronics & Semiconductor End-Use Industry, 2016-2021 (USD Million)
Figure 44 North America to Lead Global Industrial Hydrogen Peroxide Market in Other End-Use Industries, 2016-2021 (USD Million)
Figure 45 Regional Snapshot: Rapidly-Growing Markets Emerging as New Strategic Locations (CAGR: 2016-2021)
Figure 46 Asia-Pacific Snapshot: China to Be the Largest-Growing Market
Figure 47 Pulp & Paper Industry Held Largest Market Share in Asia-Pacific, 2015
Figure 48 U.S. Market Snapshot, 2016 vs 2021
Figure 49 Europe Market Snapshot: Italy to Be the Fastest-Growing Market
Figure 50 Companies Adopted Investments & Expansions as Key Growth Strategy Between 2011 and 2016
Figure 51 Top 4 Players Accounted for Majority of the Market Share in 2015
Figure 52 Market Evaluation Framework: Investments & Expansions Fueled Growth Between 2011 and 2016
Figure 53 Solvay SA: Company Snapshot
Figure 54 Solvay SA: SWOT Analysis
Figure 55 Evonik Industries AG: Company Snapshot
Figure 56 Evonik Industries AG: SWOT Analysis
Figure 57 Arkema SA: Company Snapshot
Figure 58 Akzonobel N.V.: Company Snapshot
Figure 59 Akzonobel N.V.: SWOT Analysis
Figure 60 BASF SE: Company Snapshot
Figure 61 BASF SE: SWOT Analysis
Figure 62 The DOW Chemical Company: Company Snapshot
Figure 63 The DOW Chemical Company: SWOT Analysis
Figure 64 Ecolab Inc.: Company Snapshot
Figure 65 Kemira OYJ: Company Snapshot
Figure 66 Merck Group: Company Snapshot
Figure 67 Mitsubishi Gas Chemical Company: Company Snapshot


Growth opportunities and latent adjacency in Industrial Hydrogen Peroxide Market