Impact Resistant Glass Market by Interlayer (Polyvinyl Butyral, Ionoplast Polymer, Ethylene Vinyl Acetate), End-Use Industry (Construction & Infrastructure, Automotive & Transportation), and Region - Global Forecast to 2022


[123 Pages Report] Impact Resistant Glass Market size is estimated to grow from USD 18.60 Billion in 2016 to USD 29.18 Billion by 2022, at a CAGR of 7.8% during the forecast period. The base year considered for the study is 2016 and the market size is projected between 2017 and 2022. The increase in the use of impact resistant glass in the construction & infrastructural and automotive end-use industries is expected to drive the market in the coming years.
Objectives of the Study:
The report analyzes the global impact resistant glass market, in terms of volume (kilotons) and value (USD million). The report also estimates the size and growth potential of the impact resistant glass market across different segments, such as interlayers, end-use industry, and region. It forecasts the market size for 5 regions, namely, Asia Pacific, North America, Europe, Middle East & Africa, and South America. The study also covers market opportunities and competitive landscape for stakeholders and market leaders.
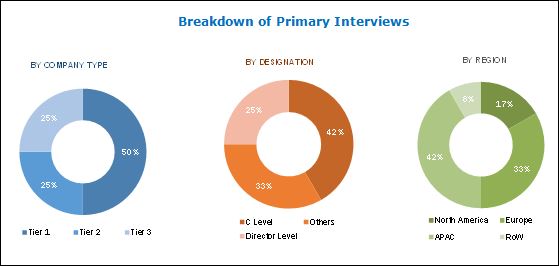
The research methodology used to estimate and forecast the impact resistant glass market begins with gathering data on key company revenues and raw material costs through secondary sources, such as Factiva, D&B Hoovers, Manta, and others. Product offerings are also taken into consideration to determine the market segmentation. The bottom-up approach was used to arrive at the overall size of the impact resistant glass market from the revenue of key players. After arriving at the total market size, the overall market was split into several segments and sub-segments, which were then verified through primary research by conducting extensive interviews with CEOs, VPs, directors, and executives. Data triangulation and market breakdown procedures were used to complete the overall market engineering process and arrive at the exact statistics for all segments and sub-segments. The breakdown of profiles of primary interviewees is shown in the figure below:
To know about the assumptions considered for the study, download the pdf brochure
Key manufacturers of impact resistant glass include Asahi Glass (Japan), Saint-Gobain (France), Nippon Sheet Glass (Japan), Guardian Industries (US), and Taiwan Glass Ind. Corp. (Taiwan).
Target Audience
- Impact Resistant Glass Manufacturers
- Raw Material Suppliers
- Distributors & Suppliers
- Industry Associations
�The study answers several questions for stakeholders, primarily which market segments to focus on in the next two to five years for prioritizing the efforts and investments�
Scope of the Report
The research report segments the impact resistant glass market into the following submarkets:
By Interlayer:
- Polyvinyl Butyral
- Ionoplast Polymer
- Ethylene Vinyl Acetate
- Others
- Cast in Place
- Polycarbonates
By End-use Industry:
- Construction & Infrastructure
- Automotive & Transportation
- Others
- Marine
- Consumer Goods
By Region:
- North America
- Europe
- Asia Pacific
- Middle East & Africa
- South America
Available Customizations
Along with the market data, MarketsandMarkets offers customizations according to the company�s specific needs. The following customization options are available for the report:
Product Analysis
- Product matrix, which gives a detailed comparison of product portfolio of each company
Regional Analysis
- Further breakdown of the North American impact resistant glass market
- Further breakdown of the European impact resistant glass market
- Further breakdown of the Asia Pacific impact resistant glass market
- Further breakdown of the Middle East & Africa impact resistant glass market
- Further breakdown of the South American impact resistant glass market
- Company information
- Detailed analysis and profiling of additional market players
The impact resistant glass market is estimated to be USD 20.08 Billion in 2017 and is projected to reach USD 29.18 Billion by 2022, at a CAGR of 7.8% during the forecast period. The growth of the market can be attributed to the high demand for impact resistant glass from the construction & infrastructure and automotive & transportation industries. The market witnessed a significant growth in the past few years, due to the increased demand for impact resistant glass from China, the US, Germany, India, Brazil, and Thailand.
The impact resistant glass market is segmented on the basis of interlayer, end-use industry, and region. Based on interlayer, the market is segmented into polyvinyl butyral, ionoplast polymer, and EVA. Polyvinyl butyral is the largest and projected to be the fastest-growing segment during the forecast period. The ionoplast polymer segment was the second largest segment in the impact resistant glass market in 2016, as applications of glass made with ionoplast polymer interlayers are growing in the construction & infrastructure industry.
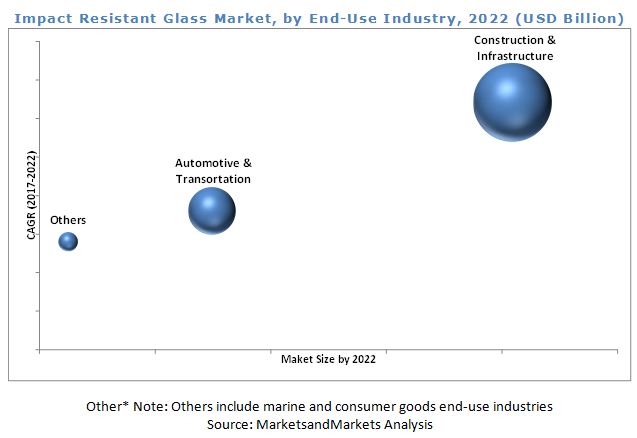
Based on end-use industry, the impact resistant glass market is segmented into construction & infrastructure, automotive & transportation, and others. Construction & infrastructure was the largest segment of the market in 2016, owing to the growing demand for impact resistant glass in residential & commercial building projects and increasing government regulations pertaining to safety & security.
Asia Pacific was the largest market for impact resistant glass in 2016. India and China are major markets for impact resistant glass due to growing construction and infrastructure development activities, increasing automotive production, and rising installations of solar panels in both countries.
The volatility of prices of raw materials and government regulations regarding CO2 emission may act as restraints for the growth of the impact resistant glass market.
Asahi Glass (Japan), Saint-Gobain (France), Nippon Sheet Glass (Japan), Guardian Industries (US), and Taiwan Glass (Taiwan) are some of the leading players in the impact resistant glass market. Asahi Glass (Japan) has been focusing on maintaining its position in the market by tapping various global markets. The company has entered strategic alliances with local distribution centers in emerging markets to increase its market share and customer base. The company adopted investments & expansions as its growth strategy in the recent years.
To speak to our analyst for a discussion on the above findings, click Speak to Analyst
 Exclusive indicates content/data unique to MarketsandMarkets and not available with any competitors.
Table of Contents
1 Introduction (Page No. - 13)
1.1 Objectives of the Study
1.2 Market Definition
1.3 Market Scope
1.3.1 Years Considered for the Study
1.4 Currency
1.5 Unit Considered
1.6 Limitations
1.7 Stakeholders
2 Research Methodology (Page No. - 16)
2.1 Research Data
2.1.1 Secondary Data
2.1.1.1 Key Data From Secondary Sources
2.1.2 Primary Data
2.1.2.1 Key Data From Primary Sources
2.1.2.2 Key Industry Insights
2.1.2.3 Breakdown of Primary Interviews
2.2 Market Size Estimation
2.2.1 Bottom-Up Approach
2.2.2 Top-Down Approach
2.3 Data Triangulation
2.4 Assumptions
3 Executive Summary (Page No. - 23)
4 Premium Insights (Page No. - 26)
4.1 Attractive Growth Opportunities in Impact Resistant Glass Market
4.2 Impact Resistant Glass Market, By End-Use Industry
4.3 Impact Resistant Glass Market, By Interlayer and Region
4.4 Impact Resistant Glass Market, By Country
5 Market Overview (Page No. - 29)
5.1 Introduction
5.2 Market Dynamics
5.2.1 Drivers
5.2.1.1 Rising Demand From Construction & Infrastructure Industry
5.2.1.2 Growing Automotive & Transportation Industry and Increasing Penetration of Impact Resistant Glass in Passenger Cars
5.2.1.3 Stringent Automobile and Building Safety Codes
5.2.2 Restraints
5.2.2.1 Government Regulations on Carbon Dioxide Emission
5.2.2.2 Lack of Logistics and Volatile Raw Material Prices Affecting Supply Chain Management
5.2.3 Opportunities
5.2.3.1 Investment in Infrastructure Projects and Automotive & Transportation Industry in Developing Economies
5.2.4 Challenges
5.2.4.1 Energy-Efficient Manufacturing Process
5.3 Porter�s Five Forces Analysis
5.3.1 Threat of New Entrants
5.3.2 Threat of Substitutes
5.3.3 Bargaining Power of Suppliers
5.3.4 Bargaining Power of Buyers
5.3.5 Intensity of Competitive Rivalry
6 Macroeconomic Overview (Page No. - 36)
6.1 Introduction
6.2 Trends and Forecast of GDP
6.3 Per Capita GDP vs Per Capita Flat Glass Demand
6.4 Trends and Forecast of Construction Industry
6.5 Trends of Automotive Industry
7 Impact Resistant Glass Market, By Interlayer (Page No. - 42)
7.1 Introduction
7.2 Polyvinyl Butyral
7.3 Ionoplast Polymer
7.4 Ethylene Vinyl Acetate
7.5 Others
8 Impact Resistant Glass Market, By End-Use Industry (Page No. - 50)
8.1 Introduction
8.2 Construction & Infrastructure
8.3 Automotive & Transportation
8.4 Others
9 Impact Resistant Glass Market, By Region (Page No. - 57)
9.1 Introduction
9.2 North America
9.2.1 US
9.2.2 Mexico
9.2.3 Canada
9.3 Europe
9.3.1 Germany
9.3.2 UK
9.3.3 France
9.3.4 Spain
9.3.5 Belgium
9.3.6 Russia
9.3.7 Italy
9.4 APAC
9.4.1 China
9.4.2 Japan
9.4.3 India
9.4.4 Thailand
9.4.5 South Korea
9.5 Middle East & Africa
9.5.1 UAE
9.5.2 Saudi Arabia
9.5.3 South Africa
9.6 South America
9.6.1 Brazil
9.6.2 Argentina
10 Competitive Landscape (Page No. - 86)
10.1 Introduction
10.2 Market Ranking Analysis
10.3 Competitive Situation and Trends
10.3.1 Agreements & Joint Ventures
10.3.2 Investments & Expansions
10.3.3 Acquisitions
11 Company Profiles (Page No. - 91)
(Business Overview, Products Offered, Recent Developments, SWOT Analysis, MnM View)*
11.1 Asahi Glass
11.2 Nippon Sheet Glass (NSG)
11.3 Saint-Gobain
11.4 Guardian Industries
11.5 Fuyao Glass Industry Group
11.6 Central Glass
11.7 Sisecam Group
11.8 Taiwan Glass
11.9 Vitro, S.A.B. De C.V.
11.10 CGS Holding Co., Ltd.
*Details on Business Overview, Products Offered, Recent Developments, SWOT Analysis, MnM View Might Not Be Captured in Case of Unlisted Companies.
11.11 Other Key Players
11.11.1 Xinyi Glass Holdings Limited
11.11.2 Cardinal Glass Industries
11.11.3 Euroglas GmbH
11.11.4 China Luoyang Float Glass Group Co., Ltd.
11.11.5 Trulite Glass & Aluminum Solutions
11.11.6 Schott AG
11.11.7 Scheuten Glass
11.11.8 Sangalli Group
11.11.9 China Specialty Glass AG
11.11.10 Syracuse Glass Company
11.11.11 Gulf Glass Industries
11.11.12 Qingdao Kangdeli Industrial & Trading Co., Ltd.
11.11.13 Jin Jing (Group) Co., Ltd.
11.11.14 Fuso Glass India Pvt. Ltd
12 Appendix (Page No. - 116)
12.1 Insights From Industry Experts
12.2 Discussion Guide
12.3 Knowledge Store: Marketsandmarkets� Subscription Portal
12.4 Introducing RT: Real Time Market Intelligence
12.5 Available Customizations
12.6 Related Reports
12.7 Author Details
List of Tables (83 Tables)
Table 1 Federal Motor Vehicle Safety Standards (Fmvss) for Automotive Glass
Table 2 Trends and Forecast of GDP, 2016�2022 (USD Billion)
Table 3 Per Capita GDP vs Per Capita Flat Glass Demand, 2016
Table 4 Trends and Forecast of Construction Industry in North America, 2015�2022 (USD Billion)
Table 5 Trends and Forecast of Construction Industry in Europe, 2015�2022 (USD Billion)
Table 6 Trends and Forecast of Construction Industry in APAC, 2015�2022 (USD Billion)
Table 7 Trends and Forecast of Construction Industry in Middle East & Africa, 2015�2022 (USD Billion)
Table 8 Trends and Forecast of Construction Industry in Latin America, 2015�2022 (USD Billion)
Table 9 Automotive Production, By Country, 2011�2016 (Million Units)
Table 10 Impact Resistant Glass Market Size, By Interlayer, 2015�2022 (Kiloton)
Table 11 Impact Resistant Glass Market Size, By Interlayer, 2015�2022 (USD Million)
Table 12 Polyvinyl Butyral Market Size, By Region, 2015�2022 (Kiloton)
Table 13 Polyvinyl Butyral Market Size, By Region, 2015�2022 (USD Million)
Table 14 Ionoplast Polymer Market Size, By Region, 2015�2022 (Kiloton)
Table 15 Ionoplast Polymer Market Size, By Region, 2015�2022 (USD Million)
Table 16 Ethylene Vinyl Acetate Market Size, By Region, 2015�2022 (Kiloton)
Table 17 Ethylene Vinyl Acetate Market Size, By Region, 2015�2022 (USD Million)
Table 18 Other Interlayers Market Size, By Region, 2015�2022 (Kiloton)
Table 19 Other Interlayers Market Size, By Region, 2015�2022 (USD Million)
Table 20 Impact Resistant Glass Market Size, By End-Use Industry, 2015�2022 (Kiloton)
Table 21 Impact Resistant Glass Market Size, By End-Use Industry, 2015�2022 (USD Million)
Table 22 Impact Resistant Glass Market Size in Construction & Infrastructure, By Region, 2015�2022 (Kiloton)
Table 23 Impact Resistant Glass Market Size in Construction & Infrastructure, By Region, 2015�2022 (USD Million)
Table 24 Impact Resistant Glass Market Size in Automotive & Transportation, By Region, 2015�2022 (Kiloton)
Table 25 Impact Resistant Glass Market Size in Automotive & Transportation, By Region, 2015�2022 (USD Million)
Table 26 Impact Resistant Glass Market Size in Other End-Use Industries, By Region, 2015�2022 (Kiloton)
Table 27 Impact Resistant Glass Market Size in Other End-Use Industries, By Region, 2015�2022 (USD Million)
Table 28 Impact Resistant Glass Market Size, By Region, 2015�2022 (Kiloton)
Table 29 Impact Resistant Glass Market Size, By Region, 2015�2022 (USD Million)
Table 30 North America: Impact Resistant Glass Market Size, By Country, 2015�2022 (Kiloton)
Table 31 North America: Impact Resistant Glass Market Size, By Country, 2015�2022 (USD Million)
Table 32 North America: Impact Resistant Glass Market Size, By End-Use Industry, 2015�2022 (Kiloton)
Table 33 North America: By Market Size, By End-Use Industry, 2015�2022 (USD Million)
Table 34 North America: By Market Size, By Interlayer, 2015�2022 (Kiloton)
Table 35 North America: By Market Size, By Interlayer, 2015�2022 (USD Million)
Table 36 US: Impact Resistant Glass Market Size, By End-Use Industry, 2015�2022 (Kiloton)
Table 37 US: By Market Size, By End-Use Industry, 2015�2022 (USD Million)
Table 38 Mexico: Impact Resistant Glass Market Size, By End-Use Industry, 2015�2022 (Kiloton)
Table 39 Mexico: By Market Size, By End-Use Industry, 2015�2022 (USD Million)
Table 40 Europe: Impact Resistant Glass Market Size, By Country, 2015�2022 (Kiloton)
Table 41 Europe: By Market Size, By Country, 2015�2022 (USD Million)
Table 42 Europe: By Market Size, By End-Use Industry, 2015�2022 (Kiloton)
Table 43 Europe: By Market Size, By End-Use Industry, 2015�2022 (USD Million)
Table 44 Europe: By Market Size, By Interlayer, 2015�2022 (Kiloton)
Table 45 Europe: By Market Size, By Interlayer, 2015�2022 (USD Million)
Table 46 Germany: Impact Resistant Glass Market Size, By End-Use Industry, 2015�2022 (Kiloton)
Table 47 Germany: By Market Size, By End-Use Industry, 2015�2022 (USD Million)
Table 48 UK: By Market Size, By End-Use Industry, 2015�2022 (Kiloton)
Table 49 UK: By Market Size, By End-Use Industry, 2015�2022 (USD Million)
Table 50 France: By Market Size, By End-Use Industry, 2015�2022 (Kiloton)
Table 51 France: By Market Size, By End-Use Industry, 2015�2022 (USD Million)
Table 52 APAC: Impact Resistant Glass Market Size, By Country, 2015�2022 (Kiloton)
Table 53 APAC: By Market Size, By Country, 2015�2022 (USD Million)
Table 54 APAC: By Market Size, By End-Use Industry, 2015�2022 (Kiloton)
Table 55 APAC: By Market Size, By End-Use Industry, 2015�2022 (USD Million)
Table 56 APAC: By Market Size, By Interlayer, 2015�2022 (Kiloton)
Table 57 APAC: By Market Size, By Interlayer, 2015�2022 (USD Million)
Table 58 China: By Market Size, By End-Use Industry, 2015�2022 (Kiloton)
Table 59 China: By Market Size, By End-Use Industry, 2015�2022 (USD Million)
Table 60 Japan: By Market Size, By End-Use Industry, 2015�2022 (Kiloton)
Table 61 Japan: By Market Size, By End-Use Industry, 2015�2022 (USD Million)
Table 62 India: By Market Size, By End-Use Industry, 2015�2022 (Kiloton)
Table 63 India: By Market Size, By End-Use Industry, 2015�2022 (USD Million)
Table 64 Middle East & Africa: Impact Resistant Glass Market Size, By Country, 2015�2022 (Kiloton)
Table 65 Middle East & Africa: By Market Size, By Country, 2015�2022 (USD Million)
Table 66 Middle East & Africa: By Market Size, By End-Use Industry, 2015�2022 (Kiloton)
Table 67 Middle East & Africa: By Market Size, By End-Use Industry, 2015�2022 (USD Million)
Table 68 Middle East & Africa: By Market Size, By Interlayer, 2015�2022 (Kiloton)
Table 69 Middle East & Africa: By Market Size, By Interlayer, 2015�2022 (USD Million)
Table 70 UAE: By Market Size, By End-Use Industry, 2015�2022 (Kiloton)
Table 71 UAE: By Market Size, By End-Use Industry, 2015�2022 (USD Million)
Table 72 South America: By Market Size, By Country, 2015�2022 (Kiloton)
Table 73 South America: By Market Size, By Country, 2015�2022 (USD Million)
Table 74 South America: By Market Size, By End-Use Industry, 2015�2022 (Kiloton)
Table 75 South America: By Market Size, By End-Use Industry, 2015�2022 (USD Million)
Table 76 South America: By Market Size, By Interlayer, 2015�2022 (Kiloton)
Table 77 South America: By Market Size, By Interlayer, 2015�2022 (USD Million)
Table 78 Brazil: By Market Size, By End-Use Industry, 2015�2022 (Kiloton)
Table 79 Brazil: By Market Size, By End-Use Industry, 2015�2022 (USD Million)
Table 80 Market Ranking of Key Players, 2016
Table 81 Agreements & Joint Ventures, 2014�2017
Table 82 Investments & Expansions, 2014�2017
Table 83 Acquisitions, 2014�2017
List of Figures (40 Figures)
Figure 1 Impact Resistant Glass: Market Segmentation
Figure 2 Impact Resistant Glass Market: Research Design
Figure 3 Market Size Estimation: Bottom-Up Approach
Figure 4 Market Size Estimation: Top-Down Approach
Figure 5 Impact Resistant Glass Market: Data Triangulation
Figure 6 Polyvinyl Butyral Interlayer to Dominate the Market During the Forecast Period
Figure 7 Construction & Infrastructure End-Use Industry to Dominate the Market During the Forecast Period
Figure 8 APAC to Register the Highest CAGR Between 2017 and 2022
Figure 9 Rising Demand for Residential & Commercial Buildings to Drive the Market, 2017�2022
Figure 10 Construction & Infrastructure to Be the Fastest-Growing End-Use Industry Between 2017 and 2022
Figure 11 Polyvinyl Butyral Interlayer Dominated the Impact Resistant Glass Market in 2016
Figure 12 China to Be the Fastest-Growing Market During the Forecast Period
Figure 13 Factors Governing the Impact Resistant Glass Market
Figure 14 Impact Resistant Glass Market: Porter�s Five Forces Analysis
Figure 15 Per Capita GDP vs Per Capita Flat Glass Demand
Figure 16 Trends and Forecast of Construction Industry in Europe, 2017 vs 2022
Figure 17 Trends and Forecast of Construction Industry in APAC, 2017 vs 2022
Figure 18 Polyvinyl Butyral Interlayer is Expected to Dominate the Market During the Forecast Period
Figure 19 APAC to Be the Largest Polyvinyl Butyral Market Between 2017 and 2022
Figure 20 North America to Be Second-Largest Ionoplast Polymer Market Between 2017 and 2022
Figure 21 Europe to Be the Second-Largest Ethylene Vinyl Acetate Market Between 2017 and 2022
Figure 22 APAC to Be the Largest Other Interlayers Market Between 2017 and 2022
Figure 23 Construction & Infrastructure to Be the Fastest-Growing End-Use Industry During the Forecast Period
Figure 24 APAC to Lead the Market in Construction & Infrastructure End-Use Industry During the Forecast Period
Figure 25 APAC to Lead the Market in Automotive & Transportation End-Use Industry During the Forecast Period
Figure 26 APAC to Lead the Market in Other End-Use Industries During the Forecast Period
Figure 27 Regional Snapshot: China to Register the Highest CAGR During the Forecast Period
Figure 28 North America Market Snapshot: US Dominated the Impact Resistant Glass Market in 2016
Figure 29 Europe Market Snapshot: Germany is Expected to Lead the Impact Resistant Glass Market
Figure 30 APAC Market Snapshot: China Dominated the Impact Resistant Glass Market in 2016
Figure 31 Companies Adopted Investment and Expansion as the Key Growth Strategies Between 2014 and 2017
Figure 32 Asahi Glass: Company Snapshot
Figure 33 Nippon Sheet Glass: Company Snapshot
Figure 34 Saint-Gobain: Company Snapshot
Figure 35 Fuyao Glass Industry Group: Company Snapshot
Figure 36 Central Glass: Company Snapshot
Figure 37 Sisecam Group: Company Snapshot
Figure 38 Taiwan Glass: Company Snapshot
Figure 39 Vitro, S.A.B. De C.V.: Company Snapshot
Figure 40 CGS Holding Co., Ltd.: Company Snapshot


Growth opportunities and latent adjacency in Impact Resistant Glass Market