Hydrogen Energy Storage Market by Form (Gas, Liquid, Solid), Technology (Compression, Liquefaction, Material Based), Application (Stationary Power, Transportation), End User (Electric Utilities, Industrial, Commercial) Region - Global Forecast to 2028
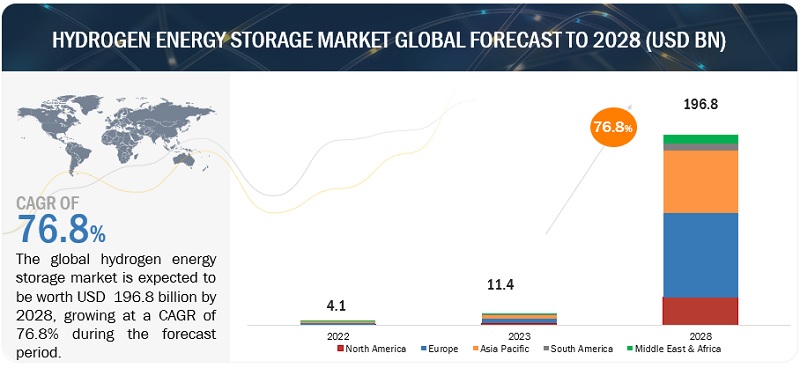
The global hydrogen energy storage market is estimated to grow from USD 11.4 billion in 2023 to USD 196.8 billion by 2028; it is expected to record a CAGR of 76.8% during the forecast period. Increasing global efforts to reduce greenhouse gas emissions and combat climate change play a pivotal role. Governments and organizations are incentivizing the transition to cleaner energy sources, making hydrogen an attractive option due to its potential for zero-emission energy storage and transportation. Additionally, the integration of hydrogen energy storage with renewable energy sources such as wind and solar power addresses the intermittency challenge, making it a reliable and sustainable solution for grid stabilization.
To know about the assumptions considered for the study, Request for Free Sample Report
To know about the assumptions considered for the study, download the pdf brochure
Hydrogen Energy Storage Market Dynamics
Driver: Renewable energy integration with electricity grid
The world confronts the complex challenges posed by climate change and endeavors to curtail greenhouse gas emissions, renewable energy sources like wind and solar power have gained significant prominence within the global energy landscape. However, these sources exhibit an inherent intermittency, generating electricity solely when the wind blows or the sun shines, thus lacking the capability to provide a consistent power supply. This intermittent nature poses a critical challenge to the stability and dependability of the electricity grid. When surplus electricity is generated from renewable sources during periods of low demand, hydrogen energy can be harnessed for the process of electrolysis, which involves the conversion of water into hydrogen gas. This hydrogen can then be securely stored for future use. In instances where electricity demand surpasses supply, particularly during peak consumption times or when renewables are unable to generate power, the stored hydrogen can be efficiently converted back into electricity through the utilization of fuel cells or alternative technologies. This process ensures a reliable source of clean and sustainable energy. The capacity to store surplus renewable energy and release it when necessary, significantly augments the grid's flexibility and reliability. It empowers utility companies and grid operators to effectively manage the fluctuating nature of renewable energy sources, thereby guaranteeing a steady and uninterrupted power delivery. Furthermore, it facilitates the seamless integration of additional renewable energy into the grid, as surplus energy can be captured and preserved for utilization during periods of diminished renewable energy generation
Restraint: Low energy density as compared to conventional fuels
Low energy density is a substantial restraint for the hydrogen energy storage market. Energy density refers to the amount of energy stored in a given volume or mass of a substance. Hydrogen, while a promising energy carrier due to its clean-burning properties and versatility, has a relatively low energy density when considered by volume. This characteristic limit the amount of energy that can be stored in a given space, making it less efficient compared to other energy storage solutions like lithium-ion batteries.
Practical limitations are posed by hydrogen's low energy density, especially in applications where space is limited, such automobiles or small energy storage systems. To store the same amount of energy as a smaller and lighter lithium-ion battery, hydrogen storage tanks or containers need to be bigger or heavier. This can make it difficult to develop and incorporate hydrogen storage systems into a variety of uses, such as portable electronics and transportation. Furthermore, the transportation and distribution of hydrogen are impacted by the reduced energy density. It frequently needs to be compressed or liquefied to be transported efficiently, which uses energy and complicates the infrastructure. Hydrogen is less economically competitive compared to other fuels due to higher costs involved with storage and distribution due to bigger storage and transit volumes.
Opportunities: Development of hydrogen infrastructure across various countries
The development of a robust hydrogen infrastructure represents a significant opportunity for the hydrogen energy storage market. This infrastructure encompasses the entire hydrogen supply chain, from production and transportation to storage and distribution. A comprehensive hydrogen infrastructure facilitates the integration of renewable energy sources into the energy mix. Hydrogen produced using renewable energy (green hydrogen) becomes more accessible when there are efficient and expansive distribution networks in place. This synergy between renewable energy and hydrogen production further accentuates the need for hydrogen energy storage. Additionally, an extensive hydrogen infrastructure fosters collaboration between various stakeholders, including governments, industries, and research institutions. These collaborations can result in the development of supportive policies, standards, and incentives, which can drive investments in hydrogen energy storage technologies. Governments may incentivize the adoption of hydrogen storage market solutions as part of their decarbonization strategies, further propelling market growth.
Challenges: Increasing investments in battery storage technologies
Battery storage prices are going down on account of technological advancements and the rising demand for electric vehicles, as battery storage is cheaper than hydrogen energy storage. Major players in Asia Pacific, Europe, and North America are focusing on increasing investments in manufacturing lithium-ion batteries to cater to the need of electric vehicles and other power applications. According to the Energy Information Administration (EIA), solar, wind, and other non-hydroelectric renewables would be the fastest growing areas of the energy portfolio for the next two years. This is expected to trigger further interest in energy storage technologies, particularly lithium-ion batteries, which are evenly poised to be more than just a player in the grid.
Hydrogen Energy Storage Market Ecosystem
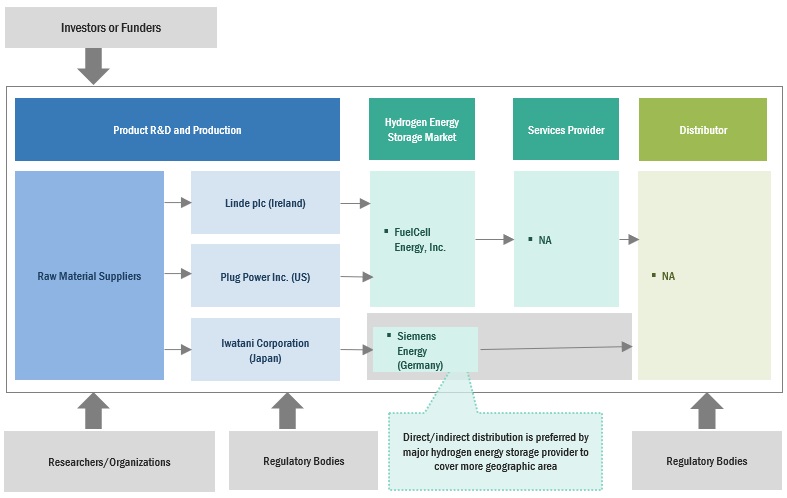
The hydrogen energy storage market ecosystem is a complex and dynamic network of interconnected players and technologies working in unison to harness the potential of hydrogen as a clean and versatile energy carrier. Hydrogen production is complemented by advanced storage and transportation solutions, encompassing high-pressure tanks, pipelines, and even liquefaction processes for efficient handling and distribution of hydrogen Industries and end-users, including power generation, transportation, and industrial sectors, form the market's demand side, driving the adoption of hydrogen-based energy solutions. Moreover, government bodies, research institutions, and private entity. Prominent companies in this market include Linde plc (Ireland), Plug Power Inc. (US), ENGIE (France), Iwatani Corporation (Japan), and FuelCell Energy, Inc. (US).
The gas segment, by storage form, is expected to be the largest market during the forecast period.
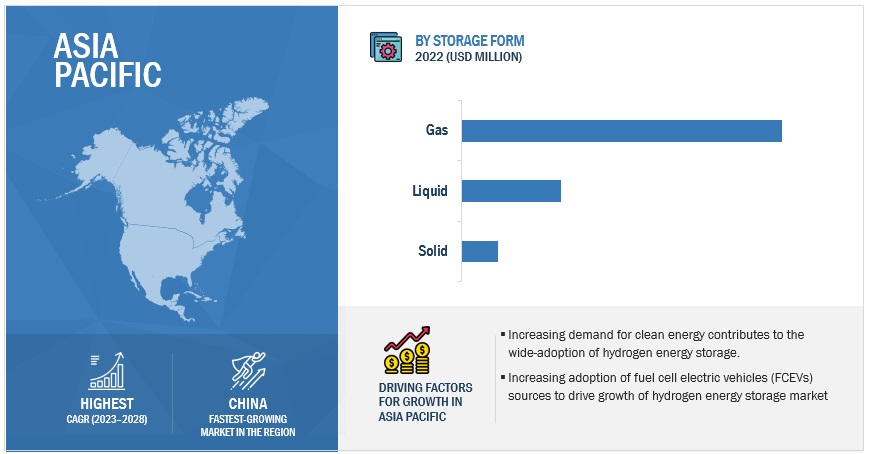
This report segments the hydrogen energy storage market based on storage form into three different forms: gas, liquid, and solid. The gas storage form segment is expected to hold the largest share during the forecast period. Gaseous hydrogen storage systems tend to be comparatively lightweight and compact, rendering suitable for a diverse array of applications, encompassing both transportation and stationary energy storage.
By application, stationary power is expected to be the fastest growing during the forecast period.
This report segments the hydrogen energy storage market based on application into two segments: stationary power and transportation. The stationary power segment is expected to be the fastest growing during the forecast period. Hydrogen serves as an ideal medium for storing and supplying power in stationary settings, offering a range of advantages. One primary application of hydrogen energy storage in stationary power is as a backup or grid-balancing solution. Hydrogen can be produced during periods of excess renewable energy generation. This surplus energy can be used to electrolyze water and generate hydrogen through a process known as power-to-gas. The stored hydrogen can then be readily converted back to electricity when renewable energy generation is insufficient, providing a reliable backup power source and helping to stabilize the grid.
“Asia Pacific: The second largest region in the hydrogen energy storage market.”
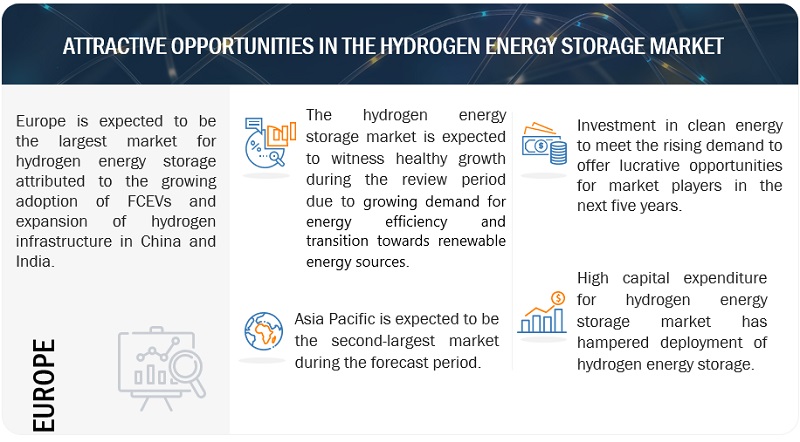
Asia Pacific is expected to be the second largest region in the hydrogen energy storage market between 2023–2028, followed by North America. The Asia Pacific region is emerging as a key player in the development and deployment of hydrogen energy storage systems. Several factors contribute to this growing interest in hydrogen-based energy solutions. First, Asia Pacific countries are facing increasing energy demand, rapid urbanization, and a pressing need to reduce greenhouse gas emissions. Hydrogen energy storage offers a promising avenue to address these challenges, particularly in sectors such as transportation, where fuel cell electric vehicles (FCEVs) are gaining traction. Additionally, the region's abundant renewable energy resources, including solar and wind power, create opportunities for green hydrogen production through electrolysis. Countries like Japan and South Korea have already made substantial investments in hydrogen infrastructure and are driving innovation in the field. Collaborative efforts, government incentives, and international partnerships are further propelling the growth of the hydrogen energy storage system market in the Asia Pacific, positioning it as a pivotal player in the global transition towards a sustainable energy landscape.
Key Market Players
The hydrogen energy storage market is dominated by a few major players that have a wide regional presence. The major players in the hydrogen energy storage companies include Linde plc (Ireland), Plug Power Inc. (US), ENGIE (France), Iwatani Corporation (Japan), and FuelCell Energy, Inc. (US). Between 2018 and 2023, Strategies such as new product launches, contracts, agreements, acquisitions, and expansions are followed by these companies to capture a larger share of the hydrogen energy storage market.
Scope of the Report
|
Report Metric |
Details |
|
Market size available for years |
2016–2028 |
|
Base year considered |
2022 |
|
Forecast period |
2023–2028 |
|
Forecast units |
Value (USD Million/Billion) |
|
Segments Covered |
Hydrogen Energy Storage Market by Storage Form, Technology, Application, End-User, and Region. |
|
Geographies covered |
Asia Pacific, North America, Europe, South America, and Middle East & Africa. |
|
Companies covered |
Linde plc (Ireland), ENGIE (France), Plug Power Inc. (US), Fuelcell Energy, Inc. (US), Iwatani Corporation (Japan), Hydro X (Israel), LAVO System (Australia), HYDROGEN IN MOTION (Canada), Mahytec (France), GKN Hydrogen (Italy), HPS Home Power Solutions AG (Germany), HDF ENERGY (France), Energy Vault, Inc. (Switzerland), BALU FORGE INDUSTRIES LIMITED (India), storelectric LTD (UK), H2GO Power (UK), Powertech Labs Inc. (Canada), Beijing SinoHy Energy Co., Ltd. (China), Hydrogenious LOHC Technologies (Germany), Ergenics Corp. (US), Power to hydrogen (US) |
This research report categorizes the hydrogen energy storage market based on storage form, technology, application, end-user and region.
On the basis of storage form:
- Solid
- Liquid
- Gas
On the basis of technology:
- Compression
- Liquefaction
- Material based
On the basis of application:
- Stationary Power
- Transportation
On the basis of end-user:
- Utilities
- Industrial
- Commercial
On the basis of region:
- North America
- Europe
- Asia Pacific
- South America
- Middle East & Africa
Recent Developments
- In April 2023, Linde plc signed an MOU with Snam to develop clean hydrogen projects and related infrastructure in Europe. Linde and Snam will work in the areas of production, distribution, compression, and storage.
- In November 2021, Iwatani Corporation of America, a wholly owned subsidiary of Iwatani Corporation, and ITM Power, the energy storage and clean fuel company, partnered to deploy multi-megawatt electrolyzer-based hydrogen energy systems in North America.
- In October 2021, Plug Power Inc. acquired Applied Cryo Technologies, Inc. (ACT). The acquisition of ACT adds significant capabilities, expertise, and technologies to Plug Power Inc. that will help the company expand the green hydrogen ecosystem.
- In August 2021, Linde plc inked a long-term agreement with Infineon Technologies for the on-site production and storage of high-purity green hydrogen.
- In January 2021, ENGIE and Total signed a cooperation agreement to build to develop, build, and operate the Masshylia project, France’s largest renewable hydrogen production site at Châteauneuf-les-Martigues in the South region. A cutting-edge management approach will be put into practice to oversee the production and storage of hydrogen.
Frequently Asked Questions (FAQ):
What is the current size of the hydrogen energy storage market?
The current market size of the hydrogen energy storage market is USD 4.1 billion in 2022.
What are the major drivers for the hydrogen energy storage market?
Growing demand of clean fuel and transition towards sustainable energy has emerged as some of major drivers for the hydrogen energy storage market.
Which is the largest region during the forecasted period in the hydrogen energy storage market?
Europe is expected to dominate the hydrogen energy storage market between 2023–2028, followed by Asia Pacific and North America.
Which is the largest segment, by technology, during the forecasted period in the hydrogen energy storage market market?
The compression segment is expected to be the largest market during the forecast period. Cast Resin Technology can assist lower transformer noise levels due to winding encapsulation, making it ideal for noise-sensitive areas.
Which is the fastest growing segment, by application, during the forecasted period in the hydrogen energy storage market?
Stationary application is expected to be the fastest growing market during the forecast period. The widespread adoption of hydrogen in power back up applications is expected to drive the stationary application segment in the forecasted period.
To speak to our analyst for a discussion on the above findings, click Speak to Analyst


- 5.1 INTRODUCTION
-
5.2 MARKET DYNAMICSDRIVERS- Integration of renewable energy into electricity grids- Rising focus on reducing greenhouse gas emissionsRESTRAINTS- High costs of hydrogen energy storage systems- Lower energy density of hydrogen fuels than conventional fuelsOPPORTUNITIES- Increasing incentives for fuel cell electric vehicle programs- Government initiatives to reach net-zero carbon emission targetsCHALLENGES- Rising investments in lithium-ion batteries for EVs
-
5.3 TRENDS/DISRUPTIONS IMPACTING CUSTOMERS’ BUSINESSESREVENUE SHIFTS AND NEW REVENUE POCKETS FOR PLAYERS IN HYDROGEN ENERGY STORAGE MARKET
- 5.4 MARKET MAPPING
-
5.5 VALUE CHAIN ANALYSISRAW MATERIAL SUPPLIERSHYDROGEN ENERGY STORAGE SYSTEM PROVIDERSDISTRIBUTORSEND USERS
-
5.6 TECHNOLOGY ANALYSISCOMPRESSION-BASED TECHNOLOGIESLIQUEFACTION-BASED TECHNOLOGIESMATERIAL-BASED TECHNOLOGIES
-
5.7 TARIFFS AND REGULATORY LANDSCAPEREGULATORY BODIES, GOVERNMENT AGENCIES, AND OTHER ORGANIZATIONSREGULATORY FRAMEWORKS
-
5.8 CASE STUDY ANALYSISNREL AND ELECTRIC HYDROGEN COLLABORATE TO DEVELOP HIGH-PERFORMANCE ELECTROLYZER COMPONENTSSAMSUNG HEAVY INDUSTRIES JOINS FORCES WITH BLOOM ENERGY TO DEVELOP ECO-FRIENDLY SHIPSBLOOM ENERGY PROVIDES BIOGAS FUEL CELLS TO POWER IKEA’S STORES BASED IN US AND EUROPE
-
5.9 TRADE ANALYSISEXPORT SCENARIOIMPORT SCENARIO
- 5.10 KEY CONFERENCES AND EVENTS, 2023–2024
-
5.11 PATENT ANALYSISLIST OF MAJOR PATENTS
-
5.12 PRICING ANALYSISINDICATIVE PRICING ANALYSIS, BY TECHNOLOGYINDICATIVE PRICING ANALYSIS, BY STORAGE FORM
-
5.13 PORTER’S FIVE FORCES ANALYSISTHREAT OF NEW ENTRANTSBARGAINING POWER OF SUPPLIERSBARGAINING POWER OF BUYERSTHREAT OF SUBSTITUTESINTENSITY OF COMPETITIVE RIVALRY
-
5.14 KEY STAKEHOLDERS AND BUYING CRITERIAKEY STAKEHOLDERS IN BUYING PROCESSBUYING CRITERIA
- 6.1 INTRODUCTION
-
6.2 GASINSTALLATION OF LIGHTWEIGHT GASEOUS HYDROGEN ENERGY STORAGE SYSTEMS TO DRIVE SEGMENTAL GROWTH
-
6.3 LIQUIDADOPTION OF HIGH-DENSITY LIQUID HYDROGEN TO CONTRIBUTE TO MARKET GROWTH
-
6.4 SOLIDSTORAGE OF LARGE QUANTITIES OF HYDROGEN IN LOW PRESSURE TO BOOST ADOPTION OF SOLID HYDROGEN STORAGE SYSTEMS
- 7.1 INTRODUCTION
-
7.2 COMPRESSIONEMERGENCE OF COMPRESSION AS IDEAL HYDROGEN STORAGE TECHNOLOGY TO FUEL SEGMENTAL GROWTH
-
7.3 LIQUEFACTIONHIGH VOLUMETRIC STORAGE CAPACITY OF LIQUEFACTION STORAGE TECHNOLOGY TO PROPEL MARKET
-
7.4 MATERIAL-BASEDSTORAGE OF MATERIAL-BASED HYDROGEN ENERGY SYSTEMS AT VARIED TEMPERATURES AND PRESSURES TO DRIVE MARKET- Metal hydrides- Carbon absorption
- 8.1 INTRODUCTION
-
8.2 STATIONARY POWERADOPTION OF STATIONARY ENERGY STORAGE SYSTEMS IN REMOTE AREAS TO CONTRIBUTE TO SEGMENTAL GROWTH
-
8.3 TRANSPORTATIONPREFERENCE FOR HYDROGEN-POWERED VEHICLES TO CURB GREENHOUSE GAS EMISSIONS TO DRIVE MARKET
- 9.1 INTRODUCTION
-
9.2 ELECTRIC UTILITIESRELIANCE ON RENEWABLE POWER SOURCES TO ACCELERATE SEGMENTAL GROWTH
-
9.3 INDUSTRIALUTILIZATION OF SUSTAINABLE ENERGY STORAGE SYSTEMS IN INDUSTRIAL SECTOR TO PROPEL MARKET
-
9.4 COMMERCIALPREFERENCE FOR FUEL CELL-POWERED VEHICLES OVER BATTERY ELECTRIC VEHICLES TO SUPPORT MARKET GROWTH
- 10.1 INTRODUCTION
-
10.2 EUROPERECESSION IMPACT ON MARKET IN EUROPE- Germany- UK- France- Italy- Netherlands- Rest of Europe
-
10.3 ASIA PACIFICRECESSION IMPACT ON MARKET IN ASIA PACIFIC- China- India- Australia- Japan- South Korea- Rest of Asia Pacific
-
10.4 NORTH AMERICARECESSION IMPACT ON MARKET IN NORTH AMERICA- US- Canada- Mexico
-
10.5 MIDDLE EAST & AFRICARECESSION IMPACT ON MARKET IN MIDDLE EAST & AFRICA- South Africa- Saudi Arabia- Rest of Middle East & Africa
-
10.6 SOUTH AMERICARECESSION IMPACT ON MARKET IN SOUTH AMERICA- Brazil- Argentina- Rest of South America

- 11.1 OVERVIEW
- 11.2 STRATEGIES ADOPTED BY KEY PLAYERS, 2018–2023
- 11.3 MARKET SHARE ANALYSIS, 2022
- 11.4 MARKET EVALUATION FRAMEWORK, 2018–2023
- 11.5 SEGMENTAL REVENUE ANALYSIS OF KEY PLAYERS, 2018–2023
-
11.6 COMPETITIVE SCENARIOS AND TRENDSDEALSOTHERS
-
11.7 EVALUATION MATRIX OF KEY PLAYERS, 2022STARSEMERGING LEADERSPERVASIVE PLAYERSPARTICIPANTS
-
11.8 EVALUATION MATRIX OF START-UPS/SMALL- AND MEDIUM-SIZED ENTERPRISES (SMES), 2022PROGRESSIVE COMPANIESRESPONSIVE COMPANIESDYNAMIC COMPANIESSTARTING BLOCKS
- 11.9 COMPETITIVE BENCHMARKING
-
12.1 KEY PLAYERSLINDE PLC- Business overview- Products/Services/Solutions offered- Recent developments- MnM viewENGIE- Business overview- Products/Services/Solutions offered- Recent developments- MnM viewPLUG POWER INC.- Business overview- Products/Services/Solutions offered- Recent developments- MnM viewFUELCELL ENERGY, INC.- Business overview- Products/Services/Solutions offered- Recent developments- MnM viewIWATANI CORPORATION- Business overview- Products/Services/Solutions offered- Recent developments- MnM viewSTORELECTRIC LTD- Business overview- Products/Services/Solutions offeredENERGY VAULT, INC.- Products/Services/Solutions offered- Recent developmentsBEIJING SINOHY ENERGY CO., LTD.- Business overview- Products/Services/Solutions offered- Recent developmentsPOWER TO HYDROGEN- Business overview- Products/Services/Solutions offered- Recent developmentsMAHYTEC- Business overview- Products/Services/Solutions offered- Recent developmentsHYDROGEN IN MOTION- Business overview- Products/Services/Solutions offered- Recent developmentsLAVO SYSTEM- Business overview- Products/Services/Solutions offered- Recent developmentsHPS HOME POWER SOLUTIONS AG- Business overview- Products/Services/Solutions offered- Recent developmentsHDF ENERGY- Business overview- Products/Services/Solutions offered- Recent developmentsGKN HYDROGEN- Business overview- Products/Services/Solutions offered- Recent developments
-
12.2 OTHER KEY PLAYERSH2GO POWERERGENICS CORP.POWERTECH LABS INC.HYDROGENIOUS LOHC TECHNOLOGIESHYDRO XBALU FORGE INDUSTRIES LIMITED
- 13.1 INSIGHTS FROM INDUSTRY EXPERTS
- 13.2 DISCUSSION GUIDE
- 13.3 KNOWLEDGESTORE: MARKETSANDMARKETS’ SUBSCRIPTION PORTAL
- 13.4 CUSTOMIZATION OPTIONS
- 13.5 RELATED REPORTS
- 13.6 AUTHOR DETAILS
- TABLE 1 HYDROGEN ENERGY STORAGE MARKET: INCLUSIONS AND EXCLUSIONS, BY STORAGE FORM
- TABLE 2 MARKET: INCLUSIONS AND EXCLUSIONS, BY TECHNOLOGY
- TABLE 3 MARKET: INCLUSIONS AND EXCLUSIONS, BY APPLICATION
- TABLE 4 MARKET: INCLUSIONS AND EXCLUSIONS, BY END USER
- TABLE 5 MARKET: INCLUSIONS AND EXCLUSIONS, BY REGION
- TABLE 6 MARKET SNAPSHOT
- TABLE 7 EMISSION REGULATIONS TO STIMULATE HYDROGEN DEMAND IN MAJOR ECONOMIES
- TABLE 8 NORTH AMERICA: LIST OF REGULATORY BODIES, GOVERNMENT AGENCIES, AND OTHER ORGANIZATIONS
- TABLE 9 EUROPE: LIST OF REGULATORY BODIES, GOVERNMENT AGENCIES, AND OTHER ORGANIZATIONS
- TABLE 10 ASIA PACIFIC: LIST OF REGULATORY BODIES, GOVERNMENT AGENCIES, AND OTHER ORGANIZATIONS
- TABLE 11 MIDDLE EAST & AFRICA: LIST OF REGULATORY BODIES, GOVERNMENT AGENCIES, AND OTHER ORGANIZATIONS
- TABLE 12 SOUTH AMERICA: LIST OF REGULATORY BODIES, GOVERNMENT AGENCIES, AND OTHER ORGANIZATIONS
- TABLE 13 MARKET: REGULATORY FRAMEWORKS
- TABLE 14 EXPORT DATA FOR HS CODE: 280410, BY COUNTRY, 2020–2022 (USD THOUSAND)
- TABLE 15 IMPORT DATA FOR HS CODE: 280410, BY COUNTRY, 2020–2022 (USD THOUSAND)
- TABLE 16 MARKET: LIST OF CONFERENCES AND EVENTS, 2023–2024
- TABLE 17 MARKET: INNOVATIONS AND PATENT REGISTRATIONS
- TABLE 18 INDICATIVE PRICE OF HYDROGEN ENERGY STORAGE SYSTEMS, BY TECHNOLOGY
- TABLE 19 INDICATIVE PRICE OF HYDROGEN ENERGY STORAGE SYSTEMS, BY STORAGE FORM
- TABLE 20 MARKET: PORTER’S FIVE FORCES ANALYSIS
- TABLE 21 INFLUENCE OF STAKEHOLDERS ON BUYING PROCESS FOR TOP 3 END USERS (%)
- TABLE 22 KEY BUYING CRITERIA FOR TOP 3 END USERS
- TABLE 23 MARKET, BY STORAGE FORM, 2016–2021 (USD MILLION)
- TABLE 24 MARKET, BY STORAGE FORM, 2022–2028 (USD MILLION)
- TABLE 25 MARKET, BY TECHNOLOGY, 2016–2021 (USD MILLION)
- TABLE 26 MARKET, BY TECHNOLOGY, 2022–2028 (USD MILLION)
- TABLE 27 COMPRESSION: MARKET, BY REGION, 2016–2021 (USD MILLION)
- TABLE 28 COMPRESSION: MARKET, BY REGION, 2022–2028 (USD MILLION)
- TABLE 29 LIQUEFACTION: MARKET, BY REGION, 2016–2021 (USD MILLION)
- TABLE 30 LIQUEFACTION: MARKET, BY REGION, 2022–2028 (USD MILLION)
- TABLE 31 MATERIAL-BASED: MARKET, BY REGION, 2016–2021 (USD MILLION)
- TABLE 32 MATERIAL-BASED: MARKET, BY REGION, 2022–2028 (USD MILLION)
- TABLE 33 MARKET, BY APPLICATION, 2016–2021 (USD MILLION)
- TABLE 34 MARKET, BY TECHNOLOGY, 2022–2028 (USD MILLION)
- TABLE 35 STATIONARY POWER: MARKET, BY REGION, 2016–2021 (USD MILLION)
- TABLE 36 STATIONARY POWER: MARKET, BY REGION, 2022–2028 (USD MILLION)
- TABLE 37 TRANSPORTATION: MARKET, BY REGION, 2016–2021 (USD MILLION)
- TABLE 38 TRANSPORTATION: MARKET, BY REGION, 2022–2028 (USD MILLION)
- TABLE 39 MARKET, BY END USER, 2016–2021 (USD MILLION)
- TABLE 40 MARKET, BY END USER, 2022–2028 (USD MILLION)
- TABLE 41 ELECTRIC UTILITIES: MARKET, BY REGION, 2016–2021 (USD MILLION)
- TABLE 42 ELECTRIC UTILITIES: MARKET, BY REGION, 2022–2028 (USD MILLION)
- TABLE 43 INDUSTRIAL: MARKET, BY REGION, 2016–2021 (USD MILLION)
- TABLE 44 INDUSTRIAL: MARKET, BY REGION, 2022–2028 (USD MILLION)
- TABLE 45 COMMERCIAL: MARKET, BY REGION, 2016–2021 (USD MILLION)
- TABLE 46 COMMERCIAL: MARKET, BY REGION, 2022–2028 (USD MILLION)
- TABLE 47 MARKET, BY REGION, 2016–2021 (USD MILLION)
- TABLE 48 MARKET, BY REGION, 2022–2028 (USD MILLION)
- TABLE 49 EUROPE: MARKET, BY TECHNOLOGY, 2016–2021 (USD MILLION)
- TABLE 50 EUROPE: MARKET, BY TECHNOLOGY, 2022–2028 (USD MILLION)
- TABLE 51 EUROPE: MARKET, BY APPLICATION, 2016–2021 (USD MILLION)
- TABLE 52 EUROPE: MARKET, BY APPLICATION, 2022–2028 (USD MILLION)
- TABLE 53 EUROPE: MARKET, BY END USER, 2016–2021 (USD MILLION)
- TABLE 54 EUROPE: MARKET, BY END USER, 2022–2028 (USD MILLION)
- TABLE 55 EUROPE: MARKET, BY COUNTRY, 2016–2021 (USD MILLION)
- TABLE 56 EUROPE: MARKET, BY COUNTRY, 2022–2028 (USD MILLION)
- TABLE 57 GERMANY: MARKET, BY TECHNOLOGY, 2016–2021 (USD MILLION)
- TABLE 58 GERMANY: MARKET, BY TECHNOLOGY, 2022–2028 (USD MILLION)
- TABLE 59 GERMANY: MARKET, BY END USER, 2016–2021 (USD MILLION)
- TABLE 60 GERMANY: MARKET, BY END USER, 2022–2028 (USD MILLION)
- TABLE 61 UK: MARKET, BY TECHNOLOGY, 2016–2021 (USD MILLION)
- TABLE 62 UK: MARKET, BY TECHNOLOGY, 2022–2028 (USD MILLION)
- TABLE 63 UK: MARKET, BY END USER, 2016–2021 (USD MILLION)
- TABLE 64 UK: MARKET, BY END USER, 2022–2028 (USD MILLION)
- TABLE 65 FRANCE: MARKET, BY TECHNOLOGY, 2016–2021 (USD MILLION)
- TABLE 66 FRANCE: MARKET, BY TECHNOLOGY, 2022–2028 (USD MILLION)
- TABLE 67 FRANCE: MARKET, BY END USER, 2016–2021 (USD MILLION)
- TABLE 68 FRANCE: MARKET, BY END USER, 2022–2028 (USD MILLION)
- TABLE 69 ITALY: MARKET, BY TECHNOLOGY, 2016–2021 (USD MILLION)
- TABLE 70 ITALY: MARKET, BY TECHNOLOGY, 2022–2028 (USD MILLION)
- TABLE 71 ITALY: MARKET, BY END USER, 2016–2021 (USD MILLION)
- TABLE 72 ITALY: MARKET, BY END USER, 2022–2028 (USD MILLION)
- TABLE 73 NETHERLANDS: MARKET, BY TECHNOLOGY, 2016–2021 (USD MILLION)
- TABLE 74 NETHERLANDS: MARKET, BY TECHNOLOGY, 2022–2028 (USD MILLION)
- TABLE 75 NETHERLANDS: MARKET, BY END USER, 2016–2021 (USD MILLION)
- TABLE 76 NETHERLANDS: MARKET, BY END USER, 2022–2028 (USD MILLION)
- TABLE 77 REST OF EUROPE: MARKET, BY TECHNOLOGY, 2016–2021 (USD MILLION)
- TABLE 78 REST OF EUROPE: MARKET, BY TECHNOLOGY, 2022–2028 (USD MILLION)
- TABLE 79 REST OF EUROPE: MARKET, BY END USER, 2016–2021 (USD MILLION)
- TABLE 80 REST OF EUROPE: MARKET, BY END USER, 2022–2028 (USD MILLION)
- TABLE 81 ASIA PACIFIC: MARKET, BY TECHNOLOGY, 2016–2021 (USD MILLION)
- TABLE 82 ASIA PACIFIC: MARKET, BY TECHNOLOGY, 2022–2028 (USD MILLION)
- TABLE 83 ASIA PACIFIC: MARKET, BY APPLICATION, 2016–2021 (USD MILLION)
- TABLE 84 ASIA PACIFIC: MARKET, BY APPLICATION, 2022–2028 (USD MILLION)
- TABLE 85 ASIA PACIFIC: MARKET, BY END USER, 2016–2021 (USD MILLION)
- TABLE 86 ASIA PACIFIC: MARKET, BY END USER, 2022–2028 (USD MILLION)
- TABLE 87 ASIA PACIFIC: MARKET, BY COUNTRY, 2016–2021 (USD MILLION)
- TABLE 88 ASIA PACIFIC: MARKET, BY COUNTRY, 2022–2028 (USD MILLION)
- TABLE 89 CHINA: MARKET, BY TECHNOLOGY, 2016–2021 (USD MILLION)
- TABLE 90 CHINA: MARKET, BY TECHNOLOGY, 2022–2028 (USD MILLION)
- TABLE 91 CHINA: MARKET, BY END USER, 2016–2021 (USD MILLION)
- TABLE 92 CHINA: MARKET, BY END USER, 2022–2028 (USD MILLION)
- TABLE 93 INDIA: MARKET, BY TECHNOLOGY, 2016–2021 (USD MILLION)
- TABLE 94 INDIA: MARKET, BY TECHNOLOGY, 2022–2028 (USD MILLION)
- TABLE 95 INDIA: MARKET, BY END USER, 2016–2021 (USD MILLION)
- TABLE 96 INDIA: MARKET, BY END USER, 2022–2028 (USD MILLION)
- TABLE 97 AUSTRALIA: MARKET, BY TECHNOLOGY, 2016–2021 (USD MILLION)
- TABLE 98 AUSTRALIA: MARKET, BY TECHNOLOGY, 2022–2028 (USD MILLION)
- TABLE 99 AUSTRALIA: MARKET, BY END USER, 2016–2021 (USD MILLION)
- TABLE 100 AUSTRALIA: MARKET, BY END USER, 2022–2028 (USD MILLION)
- TABLE 101 JAPAN: MARKET, BY TECHNOLOGY, 2016–2021 (USD MILLION)
- TABLE 102 JAPAN: MARKET, BY TECHNOLOGY, 2022–2028 (USD MILLION)
- TABLE 103 JAPAN: MARKET, BY END USER, 2016–2021 (USD MILLION)
- TABLE 104 JAPAN: MARKET, BY END USER, 2022–2028 (USD MILLION)
- TABLE 105 SOUTH KOREA: MARKET, BY TECHNOLOGY, 2016–2021 (USD MILLION)
- TABLE 106 SOUTH KOREA: MARKET, BY TECHNOLOGY, 2022–2028 (USD MILLION)
- TABLE 107 SOUTH KOREA: MARKET, BY END USER, 2016–2021 (USD MILLION)
- TABLE 108 SOUTH KOREA: MARKET, BY END USER, 2022–2028 (USD MILLION)
- TABLE 109 REST OF ASIA PACIFIC: MARKET, BY TECHNOLOGY, 2016–2021 (USD MILLION)
- TABLE 110 REST OF ASIA PACIFIC: MARKET, BY TECHNOLOGY, 2022–2028 (USD MILLION)
- TABLE 111 REST OF ASIA PACIFIC: MARKET, BY END USER, 2016–2021 (USD MILLION)
- TABLE 112 REST OF ASIA PACIFIC: MARKET, BY END USER, 2022–2028 (USD MILLION)
- TABLE 113 NORTH AMERICA: MARKET, BY TECHNOLOGY, 2016–2021 (USD MILLION)
- TABLE 114 NORTH AMERICA: MARKET, BY TECHNOLOGY, 2022–2028 (USD MILLION)
- TABLE 115 NORTH AMERICA: MARKET, BY APPLICATION, 2016–2021 (USD MILLION)
- TABLE 116 NORTH AMERICA: MARKET, BY APPLICATION, 2022–2028 (USD MILLION)
- TABLE 117 NORTH AMERICA: MARKET, BY END USER, 2016–2021 (USD MILLION)
- TABLE 118 NORTH AMERICA: MARKET, BY END USER, 2022–2028 (USD MILLION)
- TABLE 119 NORTH AMERICA: MARKET, BY COUNTRY, 2016–2021 (USD MILLION)
- TABLE 120 NORTH AMERICA: MARKET, BY COUNTRY, 2022–2028 (USD MILLION)
- TABLE 121 US: MARKET, BY TECHNOLOGY, 2016–2021 (USD MILLION)
- TABLE 122 US: MARKET, BY TECHNOLOGY, 2022–2028 (USD MILLION)
- TABLE 123 US: MARKET, BY END USER, 2016–2021 (USD MILLION)
- TABLE 124 US: MARKET, BY END USER, 2022–2028 (USD MILLION)
- TABLE 125 CANADA: MARKET, BY TECHNOLOGY, 2016–2021 (USD MILLION)
- TABLE 126 CANADA: MARKET, BY TECHNOLOGY, 2022–2028 (USD MILLION)
- TABLE 127 CANADA: MARKET, BY END USER, 2016–2021 (USD MILLION)
- TABLE 128 CANADA: MARKET, BY END USER, 2022–2028 (USD MILLION)
- TABLE 129 MEXICO: MARKET, BY TECHNOLOGY, 2016–2021 (USD MILLION)
- TABLE 130 MEXICO: MARKET, BY TECHNOLOGY, 2022–2028 (USD MILLION)
- TABLE 131 MEXICO: MARKET, BY END USER, 2016–2021 (USD MILLION)
- TABLE 132 MEXICO: MARKET, BY END USER, 2022–2028 (USD MILLION)
- TABLE 133 MIDDLE EAST & AFRICA: MARKET, BY TECHNOLOGY, 2016–2021 (USD MILLION)
- TABLE 134 MIDDLE EAST & AFRICA: MARKET, BY TECHNOLOGY, 2022–2028 (USD MILLION)
- TABLE 135 MIDDLE EAST & AFRICA: MARKET, BY APPLICATION, 2016–2021 (USD MILLION)
- TABLE 136 MIDDLE EAST & AFRICA: MARKET, BY APPLICATION, 2022–2028 (USD MILLION)
- TABLE 137 MIDDLE EAST & AFRICA: MARKET, BY END USER, 2016–2021 (USD MILLION)
- TABLE 138 MIDDLE EAST & AFRICA: MARKET, BY END USER, 2022–2028 (USD MILLION)
- TABLE 139 MIDDLE EAST & AFRICA: MARKET, BY COUNTRY, 2016–2021 (USD MILLION)
- TABLE 140 MIDDLE EAST & AFRICA: MARKET, BY COUNTRY, 2022–2028 (USD MILLION)
- TABLE 141 SOUTH AFRICA: MARKET, BY TECHNOLOGY, 2016–2021 (USD MILLION)
- TABLE 142 SOUTH AFRICA: MARKET, BY TECHNOLOGY, 2022–2028 (USD MILLION)
- TABLE 143 SOUTH AFRICA: MARKET, BY END USER, 2016–2021 (USD MILLION)
- TABLE 144 SOUTH AFRICA: MARKET, BY END USER, 2022–2028 (USD MILLION)
- TABLE 145 SAUDI ARABIA: MARKET, BY TECHNOLOGY, 2016–2021 (USD MILLION)
- TABLE 146 SAUDI ARABIA: MARKET, BY TECHNOLOGY, 2022–2028 (USD MILLION)
- TABLE 147 SAUDI ARABIA: MARKET, BY END USER, 2016–2021 (USD MILLION)
- TABLE 148 SAUDI ARABIA: MARKET, BY END USER, 2022–2028 (USD MILLION)
- TABLE 149 REST OF MIDDLE EAST & AFRICA: MARKET, BY TECHNOLOGY, 2016–2021 (USD MILLION)
- TABLE 150 REST OF MIDDLE EAST & AFRICA: MARKET, BY TECHNOLOGY, 2022–2028 (USD MILLION)
- TABLE 151 REST OF MIDDLE EAST & AFRICA: MARKET, BY END USER, 2016–2021 (USD MILLION)
- TABLE 152 REST OF MIDDLE EAST & AFRICA: MARKET, BY END USER, 2022–2028 (USD MILLION)
- TABLE 153 SOUTH AMERICA: MARKET, BY TECHNOLOGY, 2016–2021 (USD MILLION)
- TABLE 154 SOUTH AMERICA: MARKET, BY TECHNOLOGY, 2022–2028 (USD MILLION)
- TABLE 155 SOUTH AMERICA: MARKET, BY APPLICATION, 2016–2021 (USD MILLION)
- TABLE 156 SOUTH AMERICA: MARKET, BY APPLICATION, 2022–2028 (USD MILLION)
- TABLE 157 SOUTH AMERICA: MARKET, BY END USER, 2016–2021 (USD MILLION)
- TABLE 158 SOUTH AMERICA: MARKET, BY END USER, 2022–2028 (USD MILLION)
- TABLE 159 SOUTH AMERICA: MARKET, BY COUNTRY, 2016–2021 (USD MILLION)
- TABLE 160 SOUTH AMERICA: MARKET, BY COUNTRY, 2022–2028 (USD MILLION)
- TABLE 161 BRAZIL: MARKET, BY TECHNOLOGY, 2016–2021 (USD MILLION)
- TABLE 162 BRAZIL: MARKET, BY TECHNOLOGY, 2022–2028 (USD MILLION)
- TABLE 163 BRAZIL: MARKET, BY END USER, 2016–2021 (USD MILLION)
- TABLE 164 BRAZIL: MARKET, BY END USER, 2022–2028 (USD MILLION)
- TABLE 165 ARGENTINA: MARKET, BY TECHNOLOGY, 2016–2021 (USD MILLION)
- TABLE 166 ARGENTINA: MARKET, BY TECHNOLOGY, 2022–2028 (USD MILLION)
- TABLE 167 ARGENTINA: MARKET, BY END USER, 2016–2021 (USD MILLION)
- TABLE 168 ARGENTINA: MARKET, BY END USER, 2022–2028 (USD MILLION)
- TABLE 169 REST OF SOUTH AMERICA: MARKET, BY TECHNOLOGY, 2016–2021 (USD MILLION)
- TABLE 170 REST OF SOUTH AMERICA: MARKET, BY TECHNOLOGY, 2022–2028 (USD MILLION)
- TABLE 171 REST OF SOUTH AMERICA: MARKET, BY END USER, 2016–2021 (USD MILLION)
- TABLE 172 REST OF SOUTH AMERICA: MARKET, BY END USER, 2022–2028 (USD MILLION)
- TABLE 173 MARKET: MARKET SHARE ANALYSIS
- TABLE 174 MARKET EVALUATION FRAMEWORK, 2018–2023
- TABLE 175 MARKET: DEALS, 2018–2023
- TABLE 176 MARKET: OTHERS, 2018–2023
- TABLE 177 COMPANY STORAGE FORM FOOTPRINT
- TABLE 178 COMPANY TECHNOLOGY FOOTPRINT
- TABLE 179 COMPANY APPLICATION FOOTPRINT
- TABLE 180 COMPANY END USER FOOTPRINT
- TABLE 181 COMPANY REGIONAL FOOTPRINT
- TABLE 182 COMPANY OVERALL FOOTPRINT
- TABLE 183 MARKET: LIST OF KEY START-UPS/SMES
- TABLE 184 START-UPS/SMES STORAGE FORM FOOTPRINT
- TABLE 185 START-UPS/SMES COMPONENT FOOTPRINT
- TABLE 186 START-UPS/SMES APPLICATION FOOTPRINT
- TABLE 187 START-UPS/SMES END USER FOOTPRINT
- TABLE 188 START-UPS/SMES REGIONAL FOOTPRINT
- TABLE 189 LINDE PLC: COMPANY OVERVIEW
- TABLE 190 LINDE PLC: PRODUCTS/SERVICES/SOLUTIONS OFFERED
- TABLE 191 LINDE PLC: DEALS
- TABLE 192 LINDE PLC: OTHERS
- TABLE 193 ENGIE: COMPANY OVERVIEW
- TABLE 194 ENGIE: PRODUCTS/SERVICES/SOLUTIONS OFFERED
- TABLE 195 ENGIE: DEALS
- TABLE 196 PLUG POWER INC.: COMPANY OVERVIEW
- TABLE 197 PLUG POWER INC.: PRODUCTS/SERVICES/SOLUTIONS OFFERED
- TABLE 198 PLUG POWER INC.: DEALS
- TABLE 199 FUELCELL ENERGY, INC.: COMPANY OVERVIEW
- TABLE 200 FUELCELL ENERGY, INC.: PRODUCTS/SERVICES/SOLUTIONS OFFERED
- TABLE 201 FUELCELL ENERGY, INC.: DEALS
- TABLE 202 IWATANI CORPORATION: COMPANY OVERVIEW
- TABLE 203 IWATANI CORPORATION: PRODUCTS/SERVICES/SOLUTIONS OFFERED
- TABLE 204 IWATANI CORPORATION: DEALS
- TABLE 205 IWATANI CORPORATION: OTHERS
- TABLE 206 STORELECTRIC LTD: COMPANY OVERVIEW
- TABLE 207 STORELECTRIC LTD: PRODUCTS/SERVICES/SOLUTIONS OFFERED
- TABLE 208 ENERGY VAULT, INC.: COMPANY OVERVIEW
- TABLE 209 ENERGY VAULT, INC.: PRODUCTS/SERVICES/SOLUTIONS OFFERED
- TABLE 210 ENERGY VAULT, INC.: DEALS
- TABLE 211 BEIJING SINOHY ENERGY CO., LTD.: COMPANY OVERVIEW
- TABLE 212 BEIJING SINOHY ENERGY CO., LTD.: PRODUCTS/SERVICES/SOLUTIONS OFFERED
- TABLE 213 BEIJING SINOHY ENERGY CO., LTD.: DEALS
- TABLE 214 POWER TO HYDROGEN: COMPANY OVERVIEW
- TABLE 215 POWER TO HYDROGEN: PRODUCTS/SERVICES/SOLUTIONS OFFERED
- TABLE 216 POWER TO HYDROGEN: DEALS
- TABLE 217 MAHYTEC: COMPANY OVERVIEW
- TABLE 218 MAHYTEC: PRODUCTS/SERVICES/SOLUTIONS OFFERED
- TABLE 219 MAHYTEC: DEALS
- TABLE 220 HYDROGEN IN MOTION: COMPANY OVERVIEW
- TABLE 221 HYDROGEN IN MOTION: PRODUCTS/SERVICES/SOLUTIONS OFFERED
- TABLE 222 HYDROGEN IN MOTION: DEALS
- TABLE 223 LAVO SYSTEM: COMPANY OVERVIEW
- TABLE 224 LAVO SYSTEM: PRODUCTS/SERVICES/SOLUTIONS OFFERED
- TABLE 225 LAVO SYSTEMS: DEALS
- TABLE 226 LAVO SYSTEM: OTHERS
- TABLE 227 HPS HOME POWER SOLUTIONS AG: COMPANY OVERVIEW
- TABLE 228 HPS HOME POWER SOLUTIONS AG: PRODUCTS/SERVICES/SOLUTIONS OFFERED
- TABLE 229 HPS HOME POWER SOLUTIONS AG: DEALS
- TABLE 230 HPS HOME POWER SOLUTIONS AG: PRODUCT LAUNCHES
- TABLE 231 HDF ENERGY: COMPANY OVERVIEW
- TABLE 232 HDF ENERGY: PRODUCTS/SERVICES/SOLUTIONS OFFERED
- TABLE 233 HDF ENERGY: DEALS
- TABLE 234 GKN HYDROGEN: COMPANY OVERVIEW
- TABLE 235 GKN HYDROGEN: PRODUCTS/SERVICES/SOLUTIONS OFFERED
- TABLE 236 GKN HYDROGEN: DEALS
- TABLE 237 GKN HYDROGEN: OTHERS
- TABLE 238 H2GO POWER: COMPANY OVERVIEW
- TABLE 239 ERGENICS CORP.: COMPANY OVERVIEW
- TABLE 240 POWERTECH LABS INC.: COMPANY OVERVIEW
- TABLE 241 HYDROGENIOUS LOHC TECHNOLOGIES: COMPANY OVERVIEW
- TABLE 242 HYDRO X: COMPANY OVERVIEW
- TABLE 243 BALU FORGE INDUSTRIES LIMITED: COMPANY OVERVIEW
- FIGURE 1 MARKET SEGMENTATION
- FIGURE 2 MARKET: RESEARCH DESIGN
- FIGURE 3 MARKET: BREAKDOWN OF PRIMARIES
- FIGURE 4 MARKET: DATA TRIANGULATION METHODOLOGY
- FIGURE 5 MARKET: BOTTOM-UP APPROACH
- FIGURE 6 MARKET: TOP-DOWN APPROACH
- FIGURE 7 KEY METRICS CONSIDERED TO ANALYZE DEMAND FOR HYDROGEN ENERGY STORAGE SYSTEMS
- FIGURE 8 KEY METRICS CONSIDERED TO ANALYZE SUPPLY OF HYDROGEN ENERGY STORAGE SYSTEMS
- FIGURE 9 MARKET: MARKET SHARE ANALYSIS, 2022
- FIGURE 10 COMPRESSION SEGMENT TO DOMINATE MARKET DURING FORECAST PERIOD
- FIGURE 11 STATIONARY POWER SEGMENT TO HOLD LARGER SHARE OF MARKET IN 2028
- FIGURE 12 INDUSTRIAL SEGMENT TO ACCOUNT FOR LARGEST MARKET SHARE IN 2023
- FIGURE 13 EUROPE TO DEPICT HIGHEST CAGR IN MARKET FROM 2023 TO 2028
- FIGURE 14 RISING FOCUS ON ACHIEVING NET-ZERO CARBON EMISSION TARGETS TO CONTRIBUTE TO MARKET GROWTH
- FIGURE 15 EUROPEAN MARKET TO EXHIBIT HIGHEST CAGR BETWEEN 2023 AND 2028
- FIGURE 16 COMPRESSION SEGMENT TO ACCOUNT FOR LARGER MARKET SHARE IN 2028
- FIGURE 17 STATIONARY POWER SEGMENT TO ACCOUNT FOR LARGER MARKET SHARE IN 2028
- FIGURE 18 INDUSTRIAL SEGMENT TO HOLD LARGEST SHARE OF MARKET IN 2028
- FIGURE 19 COMPRESSION SEGMENT AND GERMANY HELD LARGEST SHARE OF EUROPEAN MARKET IN 2022
- FIGURE 20 MARKET: DRIVERS, RESTRAINTS, OPPORTUNITIES, AND CHALLENGES
- FIGURE 21 REVENUE SHIFTS AND NEW REVENUE POCKETS FOR PLAYERS IN MARKET
- FIGURE 22 MARKET MAPPING
- FIGURE 23 MARKET: VALUE CHAIN ANALYSIS
- FIGURE 24 ELEMENTS OF HYDROGEN ENERGY STORAGE SYSTEMS
- FIGURE 25 EXPORT DATA FOR HS CODE: 280410, BY COUNTRY, 2020–2022 (USD THOUSAND)
- FIGURE 26 IMPORT DATA FOR HS CODE: 280410, BY COUNTRY, 2020–2022 (USD THOUSAND)
- FIGURE 27 INNOVATIONS AND PATENT REGISTRATIONS PERTAINING TO HYDROGEN ENERGY STORAGE SYSTEMS, 2018–2022
- FIGURE 28 MARKET: PORTER’S FIVE FORCES ANALYSIS
- FIGURE 29 INFLUENCE OF STAKEHOLDERS ON BUYING PROCESS FOR TOP 3 END USERS
- FIGURE 30 KEY BUYING CRITERIA FOR TOP 3 END USERS
- FIGURE 31 MARKET, BY STORAGE FORM, 2022 (%)
- FIGURE 32 MARKET, BY TECHNOLOGY, 2022 (%)
- FIGURE 33 MARKET, BY APPLICATION, 2022 (%)
- FIGURE 34 MARKET, BY END USER, 2022 (%)
- FIGURE 35 EUROPE TO EXHIBIT HIGHEST CAGR IN MARKET DURING FORECAST PERIOD
- FIGURE 36 HYDROGEN ENERGY STORAGE MARKET SHARE, BY REGION, 2022
- FIGURE 37 EUROPE: HYDROGEN ENERGY STORAGE MARKET SNAPSHOT
- FIGURE 38 ASIA PACIFIC: HYDROGEN ENERGY STORAGE MARKET SNAPSHOT
- FIGURE 39 HYDROGEN ENEGRY STORAGE MARKET SHARE ANALYSIS OF KEY PLAYERS, 2022
- FIGURE 40 SEGMENTAL REVENUE ANALYSIS, 2018–2022
- FIGURE 41 HYDROGEN STORAGE ENERGY MARKET: EVALUATION MATRIX OF KEY COMPANIES, 2022
- FIGURE 42 HYDROGEN ENERGY STORAGE MARKET: EVALUATION MATRIX OF START-UPS/SMES, 2022
- FIGURE 43 LINDE PLC: COMPANY SNAPSHOT
- FIGURE 44 ENGIE: COMPANY SNAPSHOT
- FIGURE 45 PLUG POWER INC.: COMPANY SNAPSHOT
- FIGURE 46 FUELCELL ENERGY, INC.: COMPANY SNAPSHOT
- FIGURE 47 IWATANI CORPORATION: COMPANY SNAPSHOT
- FIGURE 48 ENERGY VAULT, INC.: COMPANY SNAPSHOT
- FIGURE 49 HDF ENERGY: COMPANY SNAPSHOT
The study involved major activities in estimating the current size of the hydrogen energy storage market. Exhaustive secondary research was done to collect information on the peer and parent markets. The next step was to validate these findings, assumptions, and sizing with industry experts across the value chain through primary research. Both top-down and bottom-up approaches were employed to estimate the total market size. Thereafter, market breakdown and data triangulation were used to estimate the market size of the segments and subsegments.
Secondary Research
This research study on the hydrogen energy storage market involved the use of extensive secondary sources, directories, and databases, such as Hoover’s, Bloomberg, Factiva, IRENA, International Energy Agency, and Statista Industry Journal, to collect and identify information useful for a technical, market-oriented, and commercial study of the hydrogen energy storage market. The other secondary sources included annual reports, press releases & investor presentations of companies, white papers, certified publications, articles by recognized authors, manufacturer associations, trade directories, and databases.
Primary Research
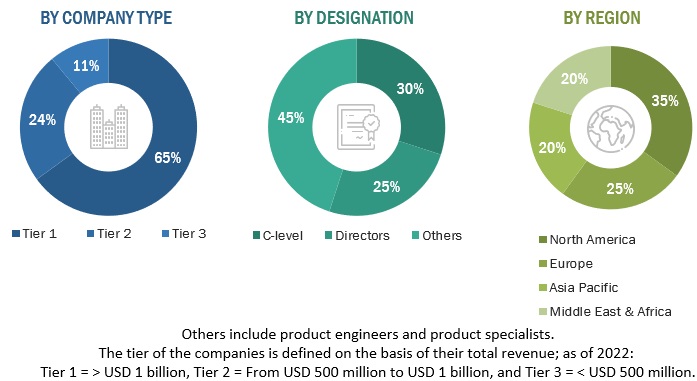
The hydrogen energy storage market comprises several stakeholders, such as hydrogen energy storage manufacturers, technology providers, and technical support providers in the supply chain. The demand side of this market is characterized by the rising demand for hydrogen energy storage in various applications such as utilities, industrial, and commercial. The supply side is characterized by rising demand for contracts from the industrial sector and mergers & acquisitions among big players. Various primary sources from both the supply and demand sides of the market were interviewed to obtain qualitative and quantitative information. Following is the breakdown of primary respondents:
To know about the assumptions considered for the study, download the pdf brochure
Market Size Estimation
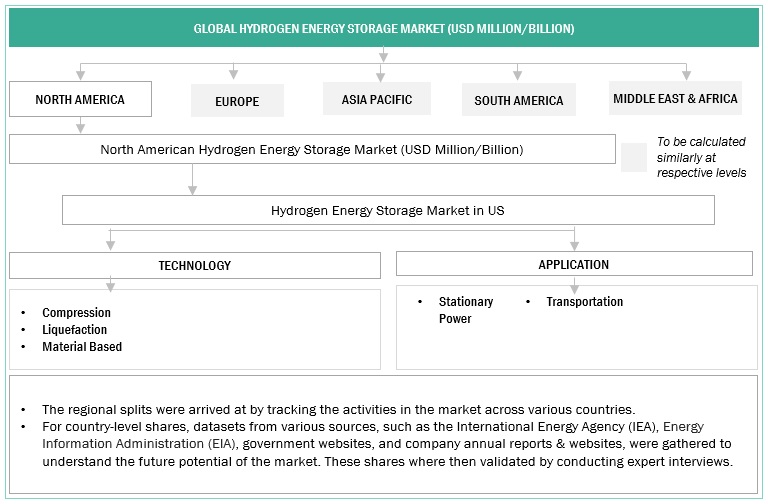
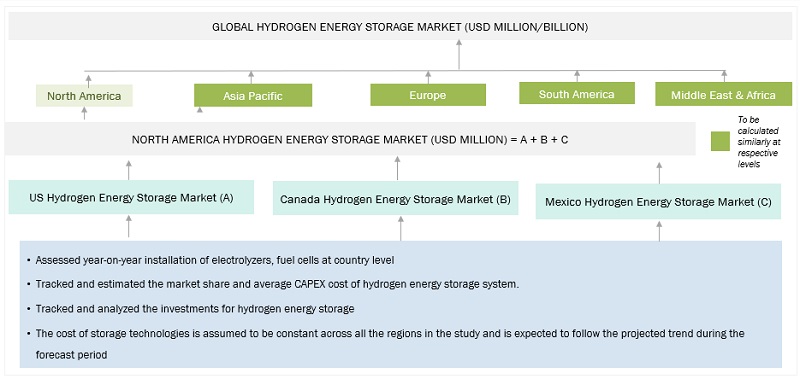
Both top-down and bottom-up approaches were used to estimate and validate the total size of the hydrogen energy storage market. These methods were also used extensively to estimate the size of various subsegments in the market. The research methodology used to estimate the market size includes the following:
- The key players in the industry and market have been identified through extensive secondary research, and their market share has been determined through primary and secondary research.
- The industry’s value chain and market size, in terms of value, have been determined through both primary and secondary research processes.
- All percentage shares, splits, and breakdowns have been determined using secondary sources and verified through primary sources.
Hydrogen Energy Storage Market Size: Top-Down Approach
To know about the assumptions considered for the study, Request for Free Sample Report
Hydrogen Energy Storage Market Size: Bottom-Up Approach
Data Triangulation
After arriving at the overall market size from the above estimation process, the total market has been split into several segments and subsegments. Data triangulation and market breakdown processes have been employed to complete the overall market engineering process and arrive at the exact statistics for all the segments and sub-segments, wherever applicable. The data has been triangulated by studying various factors and trends from both the demand- and supply sides. Along with this, the market has been validated using both the top-down and bottom-up approaches.
Market Definition
Hydrogen energy storage involves the conversion of electrical energy into hydrogen using electrolysis. This hydrogen can then be utilized as fuel in combustion engines or fuel cells. Hydrogen storage can take three primary forms: high-pressure tanks as compressed gas, dewars as a cryogenic liquid at -253°C, or in a chemical form through reactions, adsorption, or absorption with chemicals or metal compounds. These stored hydrogen reserves can be retrieved when energy supplies are needed, and unlike batteries, hydrogen storage does not degrade over time, making it suitable for longer-term storage.
Key Stakeholders
- Energy Regulators
- Consulting companies in the energy and power sector
- Distributors of hydrogen energy storage solutions
- Governments and research organizations
- Power equipment and garden tool manufacturers
- Hydrogen energy storage providers
- Spare parts and component suppliers
Objectives of the Study
- To define, describe, and forecast the hydrogen energy storage market based on storage form, technology, application, and end user in terms of value
- To define, describe, and forecast the market across five key regions, namely, North America, Europe, Asia Pacific, Middle East & Africa, and South America, along with the country-level market analyses in terms of value
- To provide detailed information about industry-specific key drivers, restraints, opportunities, and challenges influencing the growth of the hydrogen energy storage market
- To strategically analyze the hydrogen energy storage market with respect to individual growth trends, prospects, and contributions of each segment to the market
- To provide information pertaining to the supply chain, trends/disruptions impacting customers’ businesses, market mapping, pricing of hydrogen energy storage, and regulatory landscape pertaining to the hydrogen energy storage market
- To strategically analyze the micromarkets1 with respect to individual growth trends, upcoming expansions, and their contributions to the overall market
- To analyze opportunities for stakeholders in the hydrogen energy storage market and draw a competitive landscape for market players
- To benchmark players within the market using the company evaluation matrix, which analyzes market players on various parameters within the broad categories of business and product strategies
- To compare key market players with respect to the market share, product specifications, and applications
- To strategically profile key players and comprehensively analyze their market ranking and core competencies2
- To track and analyze competitive developments in the hydrogen energy storage market, such as expansions, product launches, partnerships, and acquisitions.
Available Customizations:
With the given market data, MarketsandMarkets offers customizations according to the specific requirements of companies. The following customization options are available for the report:
Product Analysis
- Product Matrix, which provides a detailed comparison of the product portfolio of each company
Company Information
- Detailed analyses and profiling of additional market players


 Generating Response ...



Growth opportunities and latent adjacency in Hydrogen Energy Storage Market
Interested in the crucial market acquisition strategies and the subsegments with respect to individual growth trends applied by the companies of the global hydrogen energy storage market for the period of 2022-2030
Hydrogen Energy Storage Market report is primarily a demand-based coverage that states the Historic, Current and Future revenues of SMR at a regional and country level for which we had contacted several primary respondents from supply and demand side of the business to obtain the qualitative and quantitative information. We have forecasted the market size in terms of Value (USD Billion); Volume (Units) till year 2027, which is broken down by State, Technologies, Application, End-User, Region
Our report on Hydrogen Energy Storage was updated last month June 2022, and it covers the market trends and growth factors with respect to Hydrogen Energy Storage Market. It also covered the Market estimations of Hydrogen Energy Storage in terms of Value by State/ Technology/ Application/ End User at regional and country level for the period 2016-2027. The report also covers the detail competitive landscape with key players Market Share Analysis, Developments of Key Market Players Like There Contracts & Agreements, Investments & Expansions, Joint Venture, Partnerships, And Collaborations and their Business Overview, Products/solutions/services Offered, Recent Developments, SWOT Analysis.