Humectants Market by Type (Sugar Alcohol, Glycerol, Alpha Hydroxy Acid & Polysaccharides, Glycols), Application (Food & Beverages, Oral & Personal Care, Pharmaceuticals, Animal Feed), Source (Synthetic, Natural), and Region - Global Forecast to 2022


[153 Pages Report] The humectants market is projected to reach USD 26.27 Billion by 2022, at a CAGR of 7.0% from 2017, in terms of value. In terms of volume, the market is projected to reach 14,741.6 KT by 2022, at a CAGR of 3.9% from 2017.
In terms of source, synthetic humectants dominated the global market in 2016, owing to their extensive usage in major end-use applications such as food & beverages, cosmetics, and oral & personal care products. Whereas, natural humectants are projected to grow at a higher CAGR during the forecast period.
Humectants are majorly used in the food & beverages segment, which accounted for the largest share in 2016 in terms of value. Various factors such as extending the product's shelf-life, increasing the product’s efficacy, and retaining moisture, are propelling the demand for humectants in the food & beverages segment.
The objectives of this study are to define, segment, and project the size of the humectants market based on source, type, application, and region.
- To provide detailed information about the key factors influencing the growth of the market (drivers, restraints, opportunities, and industry-specific challenges)
- To analyze the opportunities in the market for stakeholders and provide details of the competitive landscape for the market leaders
- To project the size of the market, in terms of value & volume, with respect to the four regions (along with their respective key countries): North America, Europe, Asia-Pacific, and the Rest of the World (RoW)
- To strategically profile the key players in the humectants market and comprehensively analyze their market share and core competencies
- To analyze competitive developments such as expansions & investments, mergers & acquisitions, and new product launches in the humectants market
The years considered for the study are:
- Base year – 2016
- Estimated year – 2017
- Projected year – 2022
- Forecast period – 2017 to 2022
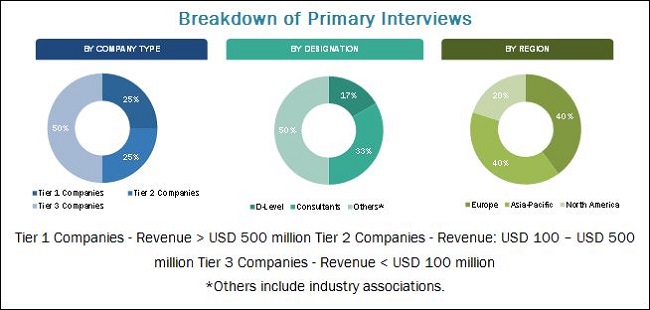
This report includes the estimation of the market size for value (USD million), and volume (KT). Both, top-down and bottom-up approaches have been used to estimate and validate the size of the humectants market and to estimate the size of various other dependent submarkets in the overall market. Key players in the market have been identified through secondary research (the FAO, Bloomberg Businessweek, Factiva, and companies’ annual reports), and their market share has been determined through primary and secondary research. All percentage shares, splits, and breakdowns have been determined using secondary sources and verified through primary sources.
To know about the assumptions considered for the study, download the pdf brochure
Market Ecosystem
The various contributors involved in the value chain of humectants include manufacturers, suppliers, distributors, intermediaries, and customers; food ingredient manufacturers such as Cargill (U.S.), The Dow Chemical Company (U.S.), Archer Daniels Midland Company (ADM) (U.S.), E. I. du Pont de Nemours and Company (U.S.), Roquette Frères (France), Ingredion Incorporated (U.S.), and BASF SE (Germany); government bodies & regulatory associations such as the Food and Drug Administration (FDA), the Food and Agriculture Organization (FAO), and Food Safety Australia and New Zealand (FSANZ).
Target Audience
- Humectant manufacturers
- Government bodies and research organizations
-
Regulatory bodies
- Organizations such as the FDA, the EFSA, the USDA, and FSANZ
- Other local & regional government agencies
-
Intermediary suppliers
- Traders
- Wholesalers
- Dealers
- Consumers
- Manufacturers/Suppliers of food & beverage products
- Manufacturers/Suppliers of animal feed products
- Manufacturers/Suppliers of cosmetic & personal care products
- Manufacturers/Suppliers of pharmaceutical products
“The study answers several questions for stakeholders, primarily which market segments to focus on in the next two to five years for prioritizing efforts and investments.”
Scope of the Report
The humectants market is segmented as follows:
On the basis of Source
- Synthetic
-
Natural
- Plant-based
- Animal-based
On the basis of Type
- Sugar alcohol
- Glycerol
- Alpha hydroxy acids & polysaccharides
- Glycols
- Others (sodium metaphosphate, sodium lactate, polydextrose, triacetin, sodium PCA, and panthenol)
On the basis of Application
-
Food & beverage
- Bakery & confectionery products
- Beverages
- Functional & nutritional food
- Others (meat & meat products and pet foods)
- Oral & personal care
- Pharmaceuticals
- Animal feed
- Others (tobacco, plastics, and tanneries)
On the basis of Region
- North America
- Europe
- Asia-Pacific
- RoW
Available Customizations
With the given market data, MarketsandMarkets offers customizations according to the client-specific needs.
The following customization options are available for the report:
Product Analysis
- Product matrix, which gives a detailed comparison of the product portfolio of each company
Application Analysis
- Application analysis, which gives a detailed analysis of other applications of humectants
Regional Analysis
- Further breakdown of the Rest of World humectants market into South American countries
- Further breakdown of the Rest of Asia-Pacific humectants market into key contributing countries
Company Information
- Detailed analysis and profiling of additional market players (up to five)
The humectants market is projected to reach USD 26.27 Billion by 2022, at a CAGR of 7.0% from 2017, in terms of value. In terms of volume, the market is projected to reach 14,741.6 KT by 2022, at a CAGR of 3.9% from 2017. The global market is growing in accordance with the advancement of bakery & confectionery products, and functional & nutritional food & beverage industry. The consumption of humectants is high in the food & beverage, cosmetics & personal care products, animal feed, and pharmaceutical industries.
Europe was the largest market for humectants in 2016. It is one the major humectants consuming regions; the availability and affordability of these humectants, and increasing awareness about the functionalities & applications of humectants will drive the growth of this market. However, at the same time, the market is expected to grow at a moderate rate.
The food & beverage segment, by application, dominated the humectants market in 2016. Factors such as rise in health-conscious consumers, growth in aging population, increase in consumer awareness regarding nutritious diet, and rise in consumer health concerns related to the consumption of high-calorie foods are expected to drive the humectants market in food & beverage segment. The oral & personal care products segment is projected to grow at the second-highest CAGR during the forecast period, followed by the pharmaceuticals segment.
The sugar alcohols segment dominated the market in 2016, by type, owing to its better nutritional profile as humectants and its dominant usage in major end-use applications such as bakery and confectionery products, fruits & vegetables, fruit & vegetable juices, oral & personal care products, pharmaceuticals, tobacco, plastics, and tanneries.
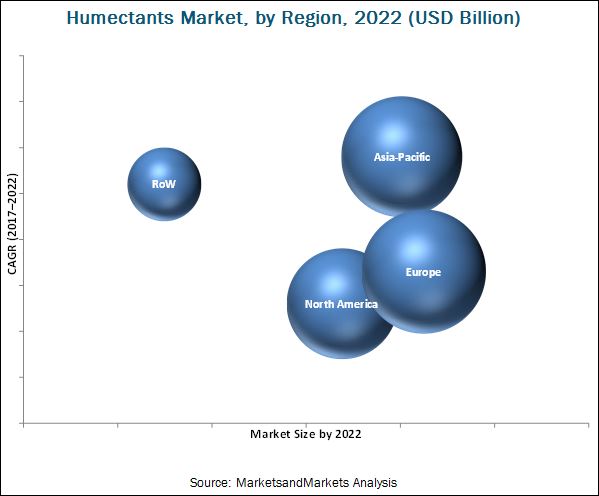
The Asia-Pacific region is projected to grow at the highest CAGR from 2017 to 2022, India being the fastest-growing market in the region. In India, diabetes and obesity are mostly associated with unhealthy food consumption habits. Awareness among sugar consumers in the country regarding its health risks has fueled the growth of low- or zero-calorie foods that are manufactured using polyols such as sorbitol, mannitol, maltitol, and xylitol. Due to the rapid development of cosmetics and personal care industries, use of glycerin is growing at a higher pace. The other drivers fueling the growth of glycerin are in the rising standards of living, rapidly changing economies, and demand for refined glycerin for personal care & pharmaceutical products.
The humectants market is concentrated, with leading companies driving market growth. The report provides qualitative analysis of the prominent market players and their preferred development strategies. Key players such as Cargill (U.S.), The Dow Chemical Company (U.S.), Archer Daniels Midland Company (U.S.), E. I. du Pont de Nemours and Company (U.S.), and Roquette Frères (France) have been profiled in the report. These leading players have adopted various strategies such as expansions & investments, mergers & acquisitions, and new product launches to explore new and untapped markets, expanding in local areas of emerging markets, and developing a new customer base for long-term client relationships. This has not only enabled the key players to expand their geographical reach, but has also reinforced their market position by gaining a larger share in terms of revenues and product portfolios.
Small-scale players also adopted these strategies to expand their businesses, globally, by investing in the establishment of manufacturing facilities and technical service centers in various regions. This inorganic growth strategy enables them to improve their technical expertise through intensive R&D infrastructure offered by large players.
To speak to our analyst for a discussion on the above findings, click Speak to Analyst
 Exclusive indicates content/data unique to MarketsandMarkets and not available with any competitors.
Table of Contents
1 Introduction (Page No. - 14)
1.1 Objectives of the Study
1.2 Market Definition
1.3 Market Scope
1.4 Periodization Considered
1.5 Currency Considered
1.6 Units Considered
1.7 Stakeholders
2 Research Methodology (Page No. - 18)
2.1 Research Data
2.2 Secondary Data
2.2.1 Key Data From Secondary Sources
2.3 Primary Data
2.3.1 Key Data From Primary Sources
2.3.2 Breakdown of Primaries By Company Type, Designation, and Region
2.4 Market Size Estimation
2.5 Market Breakdown & Data Triangulation
2.6 Research Assumptions & Limitations
3 Executive Summary (Page No. - 27)
4 Premium Insights (Page No. - 31)
4.1 Attractive Opportunities in this Market
4.2 Market, By Region
4.3 Asia-Pacific Humectants Market, By Country & By Type
4.4 Humectants Market: Major Countries
4.5 Asia-Pacific Humectants Market, By Application
5 Market Overview (Page No. - 36)
5.1 Introduction
5.2 Market Dynamics
5.2.1 Drivers
5.2.1.1 Growth in Demand From Various End-Use Industries
5.2.1.2 Changing Consumer Lifestyles and Growing Consumption of Bakery and Confectionery Products
5.2.1.3 Rise in Consumer Demand for Low-Calorie and Healthier Food & Beverage Products
5.2.1.3.1 Increase in Health Concerns Related to Sugar Consumption
5.2.1.4 Growth in the Biodiesel Industry & Fluctuation in the Price and Supply of Sugar Creating Opportunities for Substitutes
5.2.2 Restraints
5.2.2.1 Stringent Regulations and International Quality Standards for Humectants
5.2.3 Opportunities
5.2.3.1 Increase in Demand for Natural Ingredients Due to Growth in Consumer Awareness
5.2.3.2 Multi-Functionality Providing Opportunities
5.2.3.3 Blends of Sugar Alcohols With Functional Food Ingredients
5.2.4 Challenges
5.2.4.1 Ambiguity Related to Side-Effects of Humectants Among the Consumers
5.3 Value Chain Analysis
6 Humectants Market, By Source (Page No. - 43)
6.1 Introduction
6.2 Synthetic
6.3 Natural
6.3.1 Plant-Based
6.3.2 Animal-Based
7 Humectants Market, By Type (Page No. - 49)
7.1 Introduction
7.2 Sugar Alcohols
7.3 Glycerol
7.4 Glycols
7.5 Alpha Hydroxy Acids (AHAS) & Polysaccharides
7.6 Others
8 Humectants Market, By Application (Page No. - 59)
8.1 Introduction
8.2 Food & Beverages
8.2.1 Bakery & Confectionery Products
8.2.2 Beverages
8.2.3 Functional & Nutritional Foods
8.2.4 Others Food & Beverages
8.3 Oral & Personal Care Products
8.4 Animal Feed
8.5 Pharmaceuticals
8.6 Others
9 Humectants Market, By Region (Page No. - 73)
9.1 Introduction
9.2 North America
9.2.1 U.S.
9.2.2 Canada
9.2.3 Mexico
9.3 Europe
9.3.1 Germany
9.3.2 France
9.3.3 U.K.
9.3.4 Italy
9.3.5 Spain
9.3.6 Rest of Europe
9.4 Asia-Pacific
9.4.1 China
9.4.2 Japan
9.4.3 India
9.4.4 Australia & New Zealand
9.4.5 Rest of Asia-Pacific
9.5 Rest of the World (RoW)
9.5.1 Brazil & Argentina
9.5.2 Middle East & Africa
10 Competitive Landscape (Page No. - 105)
10.1 Introduction
10.2 Humectants Market (Global) Competitive Leadership Mapping, 2017
10.2.1 Visionary Leaders
10.2.2 Dynamic Differentiators
10.2.3 Innovators
10.2.4 Emerging Companies
10.3 Competitive Benchmarking
10.3.1 Strength of Product Portfolio
10.3.2 Business Strategy Excellence
*Top 25 Companies Analyzed for This Study are – Cargill (U.S.), BASF SE (Germany), Archer Daniels Midland Company (U.S.), E. I. Du Pont De Nemours and Company (U.S.), Roquette Frères (France), Ingredion Incorporated (U.S.), the DOW Chemical Company (U.S.), Brenntag AG (Germany), Barentz (Netherlands), Ashland Global Holdings Inc. (U.S.), Batory Foods (U.S.), Corbion (Netherlands), Aic, Inc. (American International Chemical) (U.S.), B Food Science Co., Ltd. (Japan), Tereos (France), the Ransdal Corporation (U.S.), Sweeteners Plus Inc. (U.S.), Vmp Chemiekontor GmbH (Germany), Lianyungang Dongtai Food Ingredients Co., Ltd (China), Galactic S.A. (Belgium), Penta Manufacturer (U.S.), Acme-Hardesty Company (U.S.), Wuhan Sanjiang Space Good Biotech Co., Ltd. (China), Fooding Group Limited (China), Nutra Food Ingredients LLC (U.S.)
10.4 Market Ranking Analysis
11 Company Profiles (Page No. - 110)
(Business Overview, Strength of Product Portfolio, Business Strategy Excellence, Recent Developments)*
11.1 Introduction
11.2 Cargill (U.S.)
11.3 BASF SE (Germany)
11.4 Archer Daniels Midland Company (U.S.)
11.5 E. I. Du Pont De Nemours and Company (U.S.)
11.6 Roquette Frères (France)
11.7 Ingredion Incorporated (U.S.)
11.8 The DOW Chemical Company (U.S.)
11.9 Brenntag AG (Germany)
11.10 Barentz (The Netherlands)
11.11 Ashland Global Holdings Inc. (U.S.)
11.12 Batory Foods (U.S.)
11.13 Corbion N.V. (The Netherlands)
*Details on Business Overview, Strength of Product Portfolio, Business Strategy Excellence, Recent Developments Might Not Be Captured in Case of Unlisted Companies.
12 Appendix (Page No. - 145)
12.1 Discussion Guide
12.2 Knowledge Store: Marketsandmarkets’ Subscription Portal
12.3 Introducing RT: Real-Time Market Intelligence
12.4 Available Customizations
12.5 Related Reports
12.6 Author Details
List of Tables (95 Tables)
Table 1 Global Prevalence of Diabetes in 2015 & 2040, Population (Million)
Table 2 Humectants Market Size, By Source, 2015–2022 (USD Million)
Table 3 Market Size, By Source, 2015–2022 (KT)
Table 4 Synthetic Humectants Market Size, By Region, 2015–2022 (USD Million)
Table 5 Synthetic Humectants Market Size, By Region, 2015–2022 (KT)
Table 6 Natural Humectants Market Size, By Region, 2015–2022 (USD Million)
Table 7 Natural Humectants Market Size, By Region, 2015–2022 (KT)
Table 8 Humectants Market Size, By Type, 2015–2022 (USD Million)
Table 9 Market Size, By Type, 2015–2022 (KT)
Table 10 Sugar Alcohols Market Size, By Region, 2015–2022 (USD Million)
Table 11 Sugar Alcohols Market Size, By Region, 2015–2022 (KT)
Table 12 Glycerol Market Size, By Region, 2015–2022 (USD Million)
Table 13 Glycerol Market Size, By Region, 2015–2022 (KT)
Table 14 Glycols Market Size, By Region, 2015–2022 (USD Million)
Table 15 Glycols Market Size, By Region, 2015–2022 (KT)
Table 16 Alpha Hydroxy Acids & Polysaccharides Market Size, By Region, 2015–2022 (USD Million)
Table 17 Alpha Hydroxy Acids & Polysaccharides Market Size, By Region, 2015–2022 (KT)
Table 18 Others Market Size, By Region, 2015–2022 (USD Million)
Table 19 Others Market Size, By Region, 2015–2022 (KT)
Table 20 Humectants Market Size, By Application, 2015–2022 (USD Million)
Table 21 Humectants Market Size in Food & Beverages, By Sub-Application, 2015–2022 (USD Million)
Table 22 Market Size for Humectants, By Application, 2015–2022 (KT)
Table 23 Humectants Market Size in Food & Beverages, By Sub-Application, 2015–2022 (KT)
Table 24 Market Size in Food & Beverages, By Region, 2015–2022 (USD Million)
Table 25 Humectants Market Size in Food & Beverages, By Region, 2015–2022 (KT)
Table 26 Humectants Market Size in Bakery & Confectionery, By Region, 2015–2022 (USD Million)
Table 27 Market Size in Bakery & Confectionery, By Region, 2015–2022 (KT)
Table 28 Humectants Market Size in Beverages, By Region, 2015–2022 (USD Million)
Table 29 Market Size in Beverages, By Region, 2015–2022 (KT)
Table 30 Humectants Market Size in Functional & Nutritional Foods, By Region, 2015–2022 (USD Million)
Table 31 Market Size in Functional & Nutritional Foods, By Region, 2015–2022 (KT)
Table 32 Humectants Market Size in Other Food & Beverage Application, By Region, 2015–2022 (USD Million)
Table 33 Market Size in Other Food & Beverage Applications, By Region, 2015–2022 (KT)
Table 34 Humectants Market Size in Oral & Personal Care Products, By Region, 2015–2022 (USD Million)
Table 35 Market Size in Oral & Personal Care Products, By Region, 2015–2022 (KT)
Table 36 Humectants Market Size in Animal Feed, By Region, 2015–2022 (USD Million)
Table 37 Market Size in Animal Feed, By Region, 2015–2022 (KT)
Table 38 Humectants Market Size in Pharmaceuticals, By Region, 2015–2022 (USD Million)
Table 39 Market Size in Pharmaceuticals, By Region, 2015–2022 (KT)
Table 40 Humectants Market Size in Other Applications, By Region, 2015–2022 (USD Million)
Table 41 Market Size in Other Applications, By Region, 2015–2022 (KT)
Table 42 Humectants Market Size, By Region, 2015–2022 (USD Million)
Table 43 Market Size, By Region, 2015–2022 (KT)
Table 44 North America: Humectants Market Size, By Country, 2015–2022 (USD Million)
Table 45 North America: Market Size, By Country, 2015–2022 (KT)
Table 46 North America: Market Size, By Type, 2015–2022 (USD Million)
Table 47 North America: Market Size, By Type, 2015–2022 (KT)
Table 48 North America: Market Size, By Application, 2015–2022 (USD Million)
Table 49 North America: Market Size, By Application, 2015–2022 (KT)
Table 50 North America: Humectants Market Size in Food & Beverages, By Sub-Application, 2015–2022 (USD Million)
Table 51 North America: Market Size in Food & Beverages, By Sub-Application, 2015–2022 (KT)
Table 52 North America: Market Size, By Source, 2015–2022 (USD Million)
Table 53 North America: Market Size, By Source, 2015–2022 (KT)
Table 54 Europe: Humectants Market Size, By Country, 2015-2022 (USD Million)
Table 55 Europe: Market Size, By Country, 2015-2022 (KT)
Table 56 Europe: Market Size, By Type, 2015-2022 (USD Million)
Table 57 Europe: Market Size, By Type, 2015-2022 (KT)
Table 58 Europe: Market Size, By Application, 2015-2022 (USD Million)
Table 59 Europe: Market Size, By Application, 2015-2022 (KT)
Table 60 Europe: Food & Beverages Market Size, By Sub-Application, 2015-2022 (USD Million)
Table 61 Europe: Food & Beverages Market Size, By Sub-Application, 2015-2022 (KT)
Table 62 Europe: Humectants Market Size, By Source, 2015-2022 (USD Million)
Table 63 Europe: Market Size, By Source, 2015-2022 (KT)
Table 64 Asia-Pacific: Humectants Market Size, By Country, 2015-2022 (USD Million)
Table 65 Asia-Pacific: Market Size, By Country, 2015-2022 (KT)
Table 66 Asia-Pacific: Market Size, By Type, 2015-2022 (USD Million)
Table 67 Asia-Pacific: Market Size, By Type, 2015-2022 (KT)
Table 68 Asia-Pacific: Humectants Market Size, By Application, 2015-2022 (USD Million)
Table 69 Asia-Pacific: Market Size, By Application, 2015-2022 (KT)
Table 70 Asia-Pacific: Food & Beverages Market Size, By Subapplication, 2015-2022 (USD Million)
Table 71 Asia-Pacific: Food & Beverages Market Size, By Subapplication, 2015-2022 (KT)
Table 72 Asia-Pacific: Humectants Market Size, By Source, 2015-2022 (USD Million)
Table 73 Asia-Pacific: Market Size, By Source, 2015-2022 (KT)
Table 74 RoW: Humectants Market Size, By Country/Region, 2015–2022 (USD Million)
Table 75 RoW: Market Size, By Country/Region, 2015–2022 (KT)
Table 76 RoW: Market Size, By Type, 2015–2022 (USD Million)
Table 77 RoW: Humectants Market Size, By Type, 2015–2022 (KT)
Table 78 RoW: Market Size for Humectants, By Application, 2015–2022 (USD Million)
Table 79 RoW: Market Size for Humectants, By Application, 2015–2022 (KT)
Table 80 RoW: Market Size in Food & Beverages, By Sub-Application, 2015–2022 (USD Million)
Table 81 RoW: Humectants Market Size in Food & Beverages, By Sub-Application, 2015–2022 (KT)
Table 82 RoW: Market Size, By Source, 2015–2022 (USD Million)
Table 83 RoW: Market Size for Humectants, By Source, 2015–2022 (KT)
Table 84 Cargill: Products Offered
Table 85 BASF SE: Products Offered
Table 86 Archer Daniels Midland: Products Offered
Table 87 Dupont: Products Offered
Table 88 Roquette Frères: Products Offered
Table 89 Ingredion Incorporated: Products Offered
Table 90 The DOW Chemical Company: Products Offered
Table 91 Brenntag AG: Products Offered
Table 92 Barentz: Products Offered
Table 93 Ashland Global Holdings Inc.: Products Offered
Table 94 Batory Foods: Products Offered
Table 95 Corbion: Products Offered
List of Figures (39 Figures)
Figure 1 Market Segmentation
Figure 2 Humectant Geographic Segmentation
Figure 3 Humectants Market: Research Design
Figure 4 Market Size Estimation Methodology: Bottom-Up Approach
Figure 5 Market Size Estimation Methodology: Top-Down Approach
Figure 6 Data Triangulation Methodology
Figure 7 Assumptions of the Research Study
Figure 8 Limitations of the Research Study
Figure 9 Humectants Market Snapshot (2017 vs 2022): Sugar Alcohols to Dominate the Market Throughout the Forecast Period
Figure 10 Humectants Market, By Application (2017 vs 2022)
Figure 11 Market Size for Humectants, By Source, 2017 Vs.2022 (USD Billion)
Figure 12 Europe: Largest Humectants Market in 2016
Figure 13 Emerging Economies Offer Attractive Opportunities in this Market
Figure 14 Asia-Pacific Projected to Grow at the Highest Rate, in Terms of Volume
Figure 15 China Was the Largest Market for Humectants in the Asia-Pacific Region in 2016
Figure 16 India is Projected to Be the Fastest-Growing Country-Level Market for Humectants From 2017 to 2022
Figure 17 Food & Beverages Segment is Projected to Dominate the Asia-Pacific Market During the Forecast Period
Figure 18 Demand for Food Products to Drive the Humectants Industry
Figure 19 Value Chain Analysis: Major Value is Added During Manufacturing and Quality Control
Figure 20 Humectants Market Size, By Source, 2017 vs 2022 (USD Million)
Figure 21 Sugar Alcohols Segment to Dominate the Global Market Through 2022 (USD Million)
Figure 22 Europe to Dominate the Humectant Market Through 2022 (USD Million)
Figure 23 Geographic Snapshot (2017–2022): the Markets in North America are Projected to Register Moderate Growth
Figure 24 North America Market Snapshot
Figure 25 Europe Market Snapshot
Figure 26 Germany to Lead the Humectants Market in Europe Through 2022 (USD Million)
Figure 27 Asia-Pacific Market Snapshot
Figure 28 China to Lead the Humectants Market in the Asia-Pacific Between 2017 and 2022 (USD Million)
Figure 29 Brazil to Lead the Humectants Market in RoW Through 2022 (USD Million)
Figure 30 Competitive Leadership Mapping
Figure 31 Cargill: Company Snapshot
Figure 32 BASF SE: Company Snapshot
Figure 33 Archer Daniels Midland: Company Snapshot
Figure 34 Dupont: Company Snapshot
Figure 35 Ingredion Incorporated: Company Snapshot
Figure 36 The DOW Chemical Company: Company Snapshot
Figure 37 Brenntag AG: Company Snapshot
Figure 38 Ashland Global Holdings Inc.: Company Snapshot
Figure 39 Corbion: Company Snapshot


Growth opportunities and latent adjacency in Humectants Market