Heat Interface Unit Market by Component (Heat Exchangers, Controllers, Pumps, Sensors, and Valves), Product (Indirect and Direct), Application (Residential, Commercial, and Industrial), and Geography - Global Forecast to 2023


[131 Pages Report] The heat interface unit market is expected to witness high growth during the forecast period. The overall market is expected to grow from USD 342.3 Million in 2016 to USD 591.3 Million by 2023, at a CAGR of 7.9% between 2017 and 2023. The base year considered for the study is 2016, and the forecast period considered is between 2017 and 2023. The objective of the report is to provide a detailed analysis of the market based on component, product, application, and geography; information regarding the major factors influencing the growth of the market (drivers, restraints, opportunities, and industry-specific challenges); and a detailed value chain analysis. Moreover, the objective of this report is to strategically profile the key players and competitive landscape for market players, and provide information on product launches, acquisitions, partnerships, agreements, contracts, and collaborations in the heat interface unit market.
The heat interface unit (HIU) market is expected to grow from USD 374.7 Million in 2017 to USD 591.3 Million by 2023, at a CAGR of 7.9% between 2017 and 2023. The major factors driving the growth of this market include the increasing supportive regulatory and legislative framework, growing use of district heating (DH) solutions, and rising adoption of smart homes in developing nations.
This report segments the heat interface unit market on the basis of component, product, application, and geography. The heat interface unit market for commercial applications is expected to witness a significant growth during the forecast period owing to the increasing installation of heat interface units in commercial buildings and institutes.
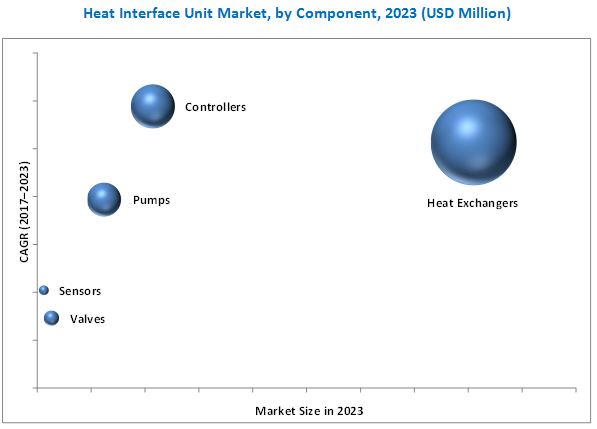
Heat exchangers accounted for the largest share of the heat interface unit market in 2016. This growth can be attributed to the growing demand for indirect HIUs for residential, commercial, and industrial applications.
The heat interface unit market for indirect HIUs is expected to grow at the highest CAGR between 2017 and 2023. This high market growth rate can be attributed to the rapidly growing adoption of heat interface units in smart homes and multi-housing apartments in developing nations.
Europe accounted for the largest share of the overall heat interface unit market in 2016 since HIUs are highly in demand in the European region than other regions.
Unawareness about HIUs in key economies such as the Americas and APAC is one of the challenging factors impeding the growth of the heat interface unit market. In countries such as the US, Canada, México, China, India, and Japan, industry players/construction contractors are yet unaware of the long-term benefits of heat interface units. In some countries, construction contractors/industry players have started to prefer district heating solutions with combined heat and power (CHP) systems, but they are not keen on using HIUs in each flat/apartment. As a result, the market size for HIUs in the Americas and APAC is smaller compared to the European market. Strong marketing and promotional activities will promote the use of HIUs in these regions.
The key players in this market are Armstrong Fluid Technology (Canada), Bosch (UK), Dutypoint (UK), Honeywell (Switzerland), Kingspan (Ireland), GIACOMINI (Italy), Docherty (UK), Caleffi (Italy), ALFA LAVAL (Sweden), Danfoss (Denmark), Rhico , Thermal Integration , Reliance Worldwide Corporation (UK) , and Intatec (UK).
To speak to our analyst for a discussion on the above findings, click Speak to Analyst
 Exclusive indicates content/data unique to MarketsandMarkets and not available with any competitors.
Table of Contents
1 Introduction (Page No. - 14)
1.1 Objectives of the Study
1.2 Market Definition
1.3 Market Scope
1.3.1 Markets Covered
1.3.2 Geographic Scope
1.3.3 Years Considered for the Study
1.4 Currency
1.5 Package Size
1.6 Limitations
1.7 Market Stakeholders
2 Research Methodology (Page No. - 18)
2.1 Research Data
2.1.1 Secondary Data
2.1.1.1 Secondary Sources
2.1.2 Primary Data
2.1.2.1 Primary Sources
2.1.2.2 Key Industry Insights
2.1.2.3 Breakdown of Primaries
2.2 Market Size Estimation
2.2.1 Bottom-Up Approach
2.2.2 Top-Down Approach
2.3 Market Breakdown and Data Triangulation
2.4 Research Assumptions
3 Executive Summary (Page No. - 27)
4 Premium Insights (Page No. - 31)
4.1 Attractive Market Opportunities in the Heat Interface Units Market
4.2 Heat Interface Units Market, By Component
4.3 Heat Interface Units Market, By Application and Region
4.4 Region Analysis of the Heat Interface Units Market
4.5 Heat Interface Units Market, By Region
4.6 Heat Interface Units Market, By Product Type
5 Market Overview (Page No. - 35)
5.1 Introduction
5.2 Market Dynamics
5.2.1 Drivers
5.2.1.1 Formulation of Supportive Regulatory and Legislative Frameworks for the Adoption of Heat Interface Units in Residential Applications
5.2.1.2 Increased Adoption of District Heating (DH) Solutions in Apartments, Commercial Buildings, Institutes, and Industrial Plants
5.2.1.3 Rise in the Number of Smart Homes in Emerging Economies
5.2.2 Restraints
5.2.2.1 Additional Expenses Incurred in Retrofitting the Existing Systems With Heat Interface Units
5.2.2.2 High Initial Costs Associated With the Deployment of District Heating Solutions
5.2.3 Opportunities
5.2.3.1 Introduction of the Internet of Things (IoT) Enabled Heat Interface Units
5.2.3.2 Increased Use of Waste/Surplus Heat Generated From Various Sources for District Heating
5.2.4 Challenges
5.2.4.1 Lack of Awareness in the Americas and Asia Pacific About Benefits Offered By Heat Interface Units
6 Industry Trends (Page No. - 40)
6.1 Introduction
6.2 Value Chain Analysis
7 Heat Interface Units Market, By Component (Page No. - 42)
7.1 Introduction
7.2 Controllers
7.3 Heat Exchangers
7.4 Pumps
7.5 Sensors
7.6 Valves
8 Heat Interface Units Market, By Product Type (Page No. - 47)
8.1 Introduction
8.2 Direct HIUs
8.3 Indirect HIUs
9 Heat Interface Units Market, By Application (Page No. - 55)
9.1 Introduction
9.2 Commercial
9.3 Industrial
9.4 Residential
10 Geographic Analysis (Page No. - 64)
10.1 Introduction
10.2 Americas
10.2.1 US
10.2.2 Canada
10.2.3 South America
10.3 Europe
10.3.1 Estonia
10.3.2 France
10.3.3 Germany
10.3.4 Latvia
10.3.5 Lithuania
10.3.6 Poland
10.3.7 Scandinavian Countries
10.3.8 UK
10.3.9 Rest of Europe
10.4 Asia Pacific (APAC)
10.4.1 China
10.4.2 Japan
10.4.3 South Korea
10.4.4 Rest of APAC
11 Competitive Landscape (Page No. - 85)
11.1 Introduction
11.2 Overview
11.3 Market Rank Analysis, 2016
11.4 Competitive Scenario
11.4.1 Most Recent New Product Launches
11.4.2 Most Recent Expansions/Acquisitions/Others
12 Company Profiles (Page No. - 88)
(Business Overview, Products Offered & Services Strategies, Key Insights, Recent Developments, MnM View)*
12.1 Key Players
12.1.1 Kingspan
12.1.2 Danfoss
12.1.3 Alfa Laval
12.1.4 Honeywell
12.1.5 Docherty
12.1.6 Dutypoint
12.1.7 Armstrong
12.1.8 Caleffi
12.1.9 Bosch
12.1.10 Giacomini
12.2 Key Innovators
12.2.1 Intatec
12.2.2 Rhico
12.2.3 Thermal Integration
12.2.4 Reliance Worldwide Corporation (UK)
12.3 Other Companies
12.3.1 Elson
12.3.2 Evinox Energy
12.3.3 Johnson & Starley
12.3.4 Elco Heating Solutions
12.3.5 Stokvis Boilers
12.3.6 Kamo Systemtechnik
12.3.7 Essco Controls
12.3.8 Heatrae Sadia
12.3.9 Kvm-Conheat
12.3.10 Comap International
12.3.11 Emmeti
*Details on Business Overview, Products Offered & Services Strategies, Key Insights, Recent Developments, MnM View Might Not Be Captured in Case of Unlisted Companies.
13 Appendix (Page No. - 122)
13.1 Insights of Industry Experts
13.2 Discussion Guide
13.3 Knowledge Store: Marketsandmarkets’ Subscription Portal
13.4 Introducing RT: Real-Time Market Intelligence
13.5 Available Customizations
13.6 Related Reports
13.7 Author Details
List of Tables (62 Tables)
Table 1 Heat Interface Units Market, By Component, 2015–2023 (USD Million)
Table 2 Controllers Market for Heat Interface Units, By Product Type, 2015–2023 (USD Million)
Table 3 Heat Exchangers Market for Heat Interface Units, By Product Type, 2015–2023 (USD Million)
Table 4 Pumps Market for Heat Interface Units, By Product Type, 2015–2023 (USD Million)
Table 5 Sensors Market for Heat Interface Units, By Product Type, 2015–2023 (USD Million)
Table 6 Valves Market for Heat Interface Units, By Product Type, 2015–2023 (USD Thousand)
Table 7 Heat Interface Units Market, By Product Type, 2015–2023 (USD Million)
Table 8 Heat Interface Units Market, By Product Type, 2015–2023 (Thousand Units)
Table 9 Direct Heat Interface Units Market, By Application, 2015–2023 (USD Million)
Table 10 Direct Heat Interface Units Market, By Application, 2015–2023 (Thousand Units)
Table 11 Direct Heat Interface Units Market, By Commercial Application, 2015–2023 (USD Million)
Table 12 Direct Heat Interface Units Market, By Commercial Application, 2015–2023 (Thousand Units)
Table 13 Direct Heat Interface Units Market, By Residential Application, 2015–2023 (USD Million)
Table 14 Direct Heat Interface Units Market, By Residential Application, 2015–2023 (Thousand Units)
Table 15 Direct Heat Interface Units Market, By Component, 2015–2023 (USD Thousand)
Table 16 Indirect Heat Interface Units Market, By Application, 2015–2023 (USD Million)
Table 17 Indirect Heat Interface Units Market, By Application, 2015–2023 (Thousand Units)
Table 18 Indirect Heat Interface Units Market, By Commercial Application, 2015–2023 (USD Million)
Table 19 Indirect Heat Interface Units Market, By Commercial Application, 2015–2023 (Thousand Units)
Table 20 Indirect Heat Interface Units Market, By Residential Application, 2015–2023 (USD Million)
Table 21 Indirect Heat Interface Units Market, By Residential Application, 2015–2023 (Thousand Units)
Table 22 Indirect Heat Interface Units Market, By Component, 2015–2023 (USD Million)
Table 23 Heat Interface Units Market, By Application, 2015–2023 (USD Million)
Table 24 Heat Interface Units Market, By Commercial Buildings Application, 2015–2023 (USD Million)
Table 25 Heat Interface Units Market in Commercial Buildings Application, By Product Type, 2015–2023 (USD Million)
Table 26 Heat Interface Units Market in Commercial Buildings Application, By Geography, 2015–2023 (USD Thousand)
Table 27 Heat Interface Units Market in Commercial Buildings Application, By Product Type, 2015–2023 (USD Million)
Table 28 Heat Interface Units Market in Commercial Buildings Application, By Geography, 2015–2023 (USD Thousand)
Table 29 Heat Interface Units Market in Institutes Application, By Product Type, 2015–2023 (USD Million)
Table 30 Heat Interface Units Market for Institutes Application, By Geography, 2015–2023 (USD Thousand)
Table 31 Heat Interface Units Market for Industrial Application, By Product Type, 2015–2023 (USD Million)
Table 32 Heat Interface Units Market for Industrial Application, By Geography, 2015–2023 (USD Million)
Table 33 Heat Interface Units Market By Residential Application, 2015–2023 (USD Million)
Table 34 Heat Interface Units Market for Residential Application, By Product Type, 2015–2023 (USD Million)
Table 35 Heat Interface Units Market in Residential Application, By Geography, 2015–2023 (USD Million)
Table 36 Heat Interface Units Market in Apartments, By Product Type, 2015–2023 (USD Million)
Table 37 Heat Interface Units Market in Apartments, By Geography, 2015–2023 (USD Million)
Table 38 Heat Interface Units Market in Single-Family Houses Application, By Product Type, 2015–2023 (USD Million)
Table 39 Heat Interface Units Market in Single-Family Houses Application, By Geography, 2015–2023 (USD Thousand)
Table 40 Heat Interface Units Market, By Region, 2015–2023 (USD Million)
Table 41 Heat Interface Units Market in Americas, By Country, 2015–2023 (USD Million)
Table 42 Heat Interface Units Market in Americas, By Application, 2015–2023 (USD Million)
Table 43 Heat Interface Units Market in US, By Application, 2015–2023 (USD Million)
Table 44 Heat Interface Units Market in Canada, By Application, 2015–2023 (USD Thousand)
Table 45 Heat Interface Units Market in Europe, By Country, 2015–2023 (USD Million)
Table 46 Heat Interface Units Market in Europe, By Application, 2015–2023 (USD Million)
Table 47 Heat Interface Units Market in Estonia, By Application, 2015–2023 (USD Thousand)
Table 48 Heat Interface Units Market in France, By Application, 2015–2023 (USD Thousand)
Table 49 Heat Interface Units Market in Germany, By Application, 2015–2023 (USD Million)
Table 50 Heat Interface Units Market in Latvia, By Application, 2015–2023 (USD Thousand)
Table 51 Heat Interface Units Market in Lithuania, By Application, 2015–2023 (USD Thousand)
Table 52 Heat Interface Units Market in Poland, By Application, 2015–2023 (USD Million)
Table 53 Heat Interface Units Market in Scandinavian Countries, By Application, 2015–2023 (USD Million)
Table 54 Heat Interface Units Market in UK, By Application, 2015–2023 (USD Thousand)
Table 55 Heat Interface Units Market in Rest of Europe, By Application, 2015–2023 (USD Thousand)
Table 56 Heat Interface Units Market in APAC, By Country, 2015–2023 (USD Thousand)
Table 57 Heat Interface Units Market in APAC, By Application, 2015–2023 (USD Million)
Table 58 Heat Interface Units Market in China, By Application, 2015–2023 (USD Thousand)
Table 59 Heat Interface Units Market in Japan, By Application, 2015–2023 (USD Thousand)
Table 60 Heat Interface Units Market in South Korea, By Application, 2015–2023 (USD Thousand)
Table 61 Heat Interface Units Market in Rest of APAC, By Application, 2015–2023 (USD Thousand)
Table 62 Major Heat Interface Units Manufacturers
List of Figures (37 Figures)
Figure 1 Heat Interface Units Market Segmentation
Figure 2 Research Design
Figure 3 Research Flow of Market Size Estimation
Figure 4 Market Size Estimation Methodology: Bottom-Up Approach
Figure 5 Market Size Estimation Methodology: Top-Down Approach
Figure 6 Data Triangulation
Figure 7 Indirect HIUs to Account for A Larger Share of the Heat Interface Units Market By 2023 as Compared to Direct HIUs
Figure 8 Heat Exchangers to Lead the Heat Interface Units Market During the Forecast Period
Figure 9 Residential Application to Lead the Heat Interface Units Market During the Forecast Period
Figure 10 Americas is Expected to Be the Fastest-Growing Market for Heat Interface Units Between 2017 and 2023
Figure 11 Growing Adoption of District Heating Solutions to Increase the Demand for Heat Interface Units During the Forecast Period
Figure 12 Heat Exchangers to Lead the Heat Interface Units Market During the Forecast Period
Figure 13 Residential Application to Account for the Largest Share of the Heat Interface Units Market in 2023
Figure 14 The US is Expected to Account for the Largest Share of the Heat Interface Units Market in 2017
Figure 15 Heat Interface Units Market in Americas is Expected to Grow at the Highest CAGR During the Forecast Period
Figure 16 Indirect HIUs to Lead the Heat Interface Units Market During the Forecast Period
Figure 17 Major Value Added to Heat Interface Units During the Raw Material and Component Suppliers and Original Equipment Manufacturers (OEM) Stages
Figure 18 Market for Controllers Projected to Grow at the Highest Rate During the Forecast Period
Figure 19 Indirect HIUs Expected to Lead the Heat Interface Units Market During the Forecast Period
Figure 20 Global Energy Consumption of Heating, By Application (Twh), 2016
Figure 21 Residential Application Expected to Lead the Heat Interface Units Market During the Forecast Period
Figure 22 Global Commercial Construction Outlook, 2016
Figure 23 Heat Interface Units Market: Region Snapshot, 2017-2023
Figure 24 The Americas: Heat Interface Units Market Snapshot
Figure 25 Trend of Investments Made in the Construction Industry in the Us
Figure 26 Investments Made in the Construction Industry in Canada, 2016
Figure 27 Regional Adoption of District Heating, 2016
Figure 28 Europe: Heat Interface Units Market Snapshot
Figure 29 Energy Sources Used to Satisfy the Country’s Heat Demand, 2016
Figure 30 Energy Sources Used to Satisfy the Country’s Heat Demand, 2016
Figure 31 Energy Source Used to Satisfy the Country’s Heat Demand, 2016
Figure 32 Asia Pacific: Heat Interface Units Market Snapshot
Figure 33 Companies Adopted New Product Launches as A Key Growth Strategy Between May 2013 and June 2017
Figure 34 Kingspan Group PLC: Company Snapshot
Figure 35 Danfoss Group: Company Snapshot
Figure 36 Alfa Laval: Company Snapshot
Figure 37 Honeywell: Company Snapshot
The research methodology used to estimate and forecast the size of the heat interface unit market begins with obtaining the data on key vendor revenues through secondary research. Some of the secondary sources used in this research include information from various journals and databases such as IEEE journals, Factiva, Hoover’s, and OneSource. The vendor offerings have also been taken into consideration to determine the market segmentation. The bottom-up procedure has been employed to arrive at the overall market size for heat interface unit from the revenue of the key players. This data triangulation and market breakdown procedures have been employed to complete the overall market engineering process and arrive at the exact statistics for all segments and subsegments. The analysis of the heat interface unit market includes extensive primary research to gather information, verify, and validate critical conclusions arrived at after an extensive secondary research.
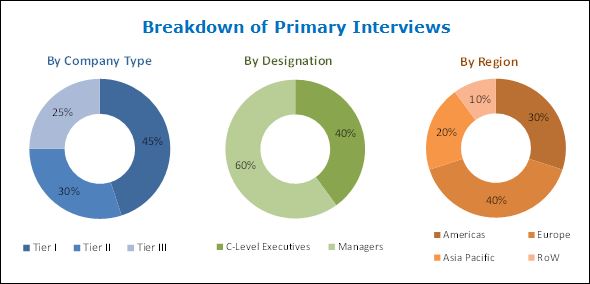
After arriving at the overall market size, the total market has been split into several segments and subsegments. The following illustration shows the breakdown of primaries conducted during the research study on the basis of company type, designation, and region.
To know about the assumptions considered for the study, download the pdf brochure
The ecosystem for heat interface unit comprises manufacturers such as Armstrong Fluid Technology (Canada), Bosch (UK), Dutypoint (UK), Honeywell (Switzerland), Kingspan (Ireland), GIACOMINI (Italy), Docherty (UK), Caleffi (Italy), ALFA LAVAL (Sweden), Danfoss (Denmark), Rhico , Thermal Integration , Reliance Worldwide Corporation (UK) , and Intatec (UK).
The target audience for the report includes:
- Heat interface unit manufacturers
- Heat interface design developers
- District heating solution providers
- Distributors and traders
- Research organizations
- Organizations, forums, alliances, and associations related to heat interface units
“The study answers several questions raised by the stakeholders, primarily which market segments to focus on in the next 2 to 6 years for prioritizing efforts and investments.”
The market covered under this report has been segmented as follows:
- Heat interface unit market, by component:
- Heat exchangers
- Controllers
- Pumps
- Sensors
- Valves
Heat interface unit market, by Product:
- Indirect
- Direct
Heat interface unit market, by Application:
- Commercial
- Industrial
- Residential
Heat interface unit market, by Region:
- Americas
- Europe
- APAC
Available Customizations:
With the given market data, MarketsandMarkets offers customizations according to the company’s specific needs. The following customization options are available for the report:
Company Information
- Detailed analysis and profiling of additional market players on the basis of various blocks of the value chain
Application Analysis
- Further breakdown of the application segment, by region


Growth opportunities and latent adjacency in Heat Interface Unit Market
I am looking for information on the market for Heat Interface units for 2018. I want market size forecast till 2025, is it possible? As I can see your forecast is till 2023.
I am only interested in the UK market and would be interested in buying the UK market element of this report. I would like to see sample of the report. also, I would like to know research methodology for the market.