Hazardous Area Equipment Market

Hazardous Area Equipment Market Size, Share, Statistics and Industry Growth Analysis by Product (Cable Glands & Accessories, Measurement Devices, Control Products, Alarm Systems, Motors, Lighting Products), Industry (Oil & Gas, Chemical & Pharmaceutical, Food & Beverage), Region - Global Forecast to 2028

Report Code: SE 5205 Dec, 2022, by marketsandmarkets.com

Updated on : April 15, 2024

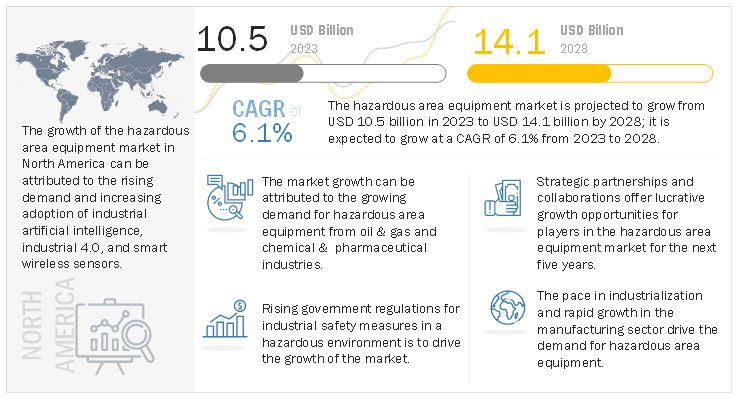
[195 Pages Report] The global hazardous area equipment market size is projected to grow from USD 10.5 billion in 2023 to USD 14.1 billion by 2028; it is expected to grow at a Compound Annual Growth Rate (CAGR) of 6.1% from 2023 to 2028.

Hazardous area equipment offers several advantages such as intrinsic safety, reduced risk of a fire or explosion, protection of circuits in an explosive environment, minimize surface temperature, and lighting products for signaling- all of which are essential to achieving higher safety and efficiency in an organization. The adoption of advanced LED light fixtures over conventional lighting solutions in hazardous area is driving the growth of the market.

The objective of the report is to define, describe, and forecast the hazardous area equipment industry based on product, industry, and region.
Hazardous Area Equipment Market

Hazardous Area Equipment Market Forecast to 2028

To know about the assumptions considered for the study, Request for Free Sample Report

Hazardous Area Equipment Market Dynamics

Rising government regulations for industrial safety measures in a hazardous environment is to drive the hazardous area equipment market growth

Globally, every process industry such as, oil and gas, chemical and pharmaceutical, food & beverage, mining, energy and power, and so on required to follow safety measures. These measures need to be taken by installing effective and efficient hazardous area equipment such as cable glands & accessories, measurement devices, control products, motors, lighting products, alarm systems, etc. that maintain safety standards and allow the smooth functioning of processes in the above-mentioned industries.

Several standards have been introduced for hazardous area equipment such as NFPA 497 and NFPA 499, ATEX, NEMA, IECEx, and UL that defines the requirements for their installation, testing, and the quality of products to be considered.

Rapid transition from traditional lighting systems to connected lighting solutions is to create high growth opportunities for the market

In recent years, there has been a rapid shift in the adoption of connected lighting solutions from traditional lighting systems due to various advantages offered by connected lighting solutions, such as increased energy efficiency, improved luminance, and cost savings in the long run. Connected lighting enables users to remotely regulate the lights according to their requirements and hence, minimize energy costs. The embedded sensors and automated control functions give users updates on the light usage patterns for an enhanced lighting experience. As industries rely on cost optimization, the demand for connected lighting solutions is expected to create high growth opportunities for the market.

The high initial cost associated with the deployment of hazardous area equipment is restraining the growth of market

The hazardous equipment used in the hazardous area is basically contained in a heavy protective enclosure, these equipment are made up of die-cast steel, occasionally plastic. In case any heat or spark ignites from the faulty equipment, the enclosure prevents it from the explosion. Furthermore, country wise different methods are used to protect the equipment used in hazardous areas. This equipment provides benefits but by paying the high cost and becomes extremely heavy. That’s why the high initial cost associated with the deployment of hazardous area equipment is restraining the growth of market.

The lack of common standards for hazardous area equipment is a challenge to the growth of the market

To avoid workplace disasters, manufacturers and end users of hazardous area equipment need to follow common standards. Globally, there are two major organizations that provide hazardous area standards International Electrotechnical Commission (IEC) and National Electrical Code (NEC) published by National Fire Protection Association (NFPA). Despite the fact that basic explosion protection principles are similar all over the world but there is some difference in the particular regulations followed in North America, Asia Pacific, and Europe. The unavailability of common open standards is creating confusion in the industry.

Control Products to grow at a higher CAGR in hazardous area market between 2023 and 2028

The control products segment is projected to register the highest CAGR of 7.2% between 2023 and 2028. Process industries are required to follow safety measures that include the installation of hazardous area-certified control products. With the growing installation of new plants and the expansion of existing ones, process industries such as oil & gas and chemical & pharmaceutical are likely to demand efficient control products, such as relays, enclosures, and signal conditioners with certifications, for enabling safe operations.

The market for hazardous area equipment in  oil & gas industry to record for largest market share throughout the forecast period

There is an increased application of hazardous area equipment such as measurement devices, control products, motors, alarm systems, and lighting products for the exploration and extraction of shale gas and oil, owing to which the oil & gas segment is expected to retain its market-leading position till 2028. Critical industries such as oil & gas and chemical & pharmaceutical are bound to have effective EHS (environment, health, and safety) to ensure the implementation and operation of appropriate equipment in hazardous areas.

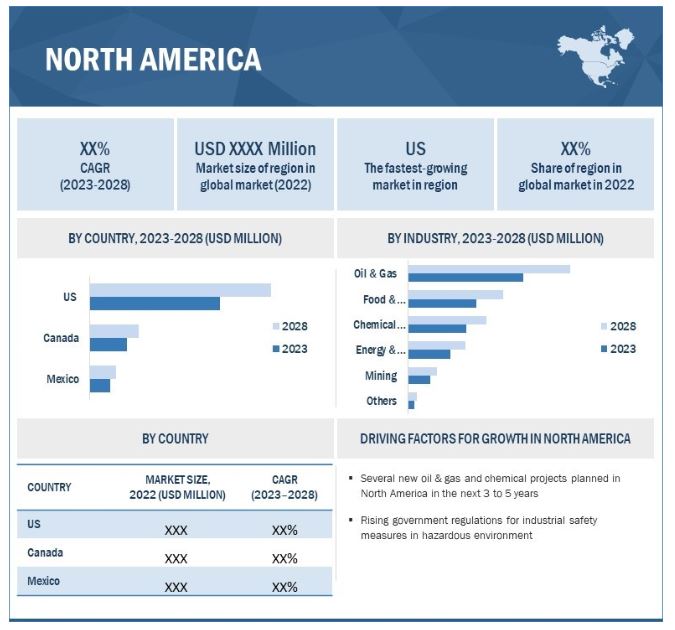
Market in North America to grow with the highest compound annual growth rate during the forecast period

The demand for hazardous area equipment in North America is expected to grow primarily because this region has emerged as a global focal point for large investments and business expansion opportunities. The fastest growth of the hazardous area equipment market in North America can be attributed to the presence of leading market players such as Rockwell (US), Honeywell (US), and Emerson (US), Also, many companies are focusing on the exploration and production of oil & gas assets in the region.
Hazardous Area Equipment Market Size, and Share

Hazardous Area Equipment Market by Region

To know about the assumptions considered for the study, download the pdf brochure

Top Hazardous Area Equipment Companies - Key Market Players:

The Hazardous Area Equipment companies such as ABB Ltd. (Switzerland), Siemens AG (Germany), Eaton Corporation (Ireland), Rockwell Automation (US), Honeywell International Inc. (US), Emerson Electric Co. (US), Patlite Corporation (Japan), R. STAHL AG (Germany).

Hazardous Area Equipment Market Report Scope :

Report Metric

Details

Estimated Market Size USD 10.5 Billion in 2023
Projected Market Size USD 14.1 Billion by 2028
Growth Rate CAGR of 6.1%

Market size available for years

2019—2028

Base year

2022

Forecast period

2023—2028

Units

Value (USD Billion)

Segments Covered

  • By Product,
  • By  Industry,
  • ByGgeography.

Geographic regions covered

  • North America,
  • Europe,
  • Asia Pacific, and
  • RoW

Companies covered

ABB Ltd. (Switzerland), Siemens AG (Germany), Eaton Corporation (Ireland), Rockwell Automation (US), Honeywell International Inc. (US), Emerson Electric Co. (US), Patlite Corporation (Japan), R. STAHL AG (Germany) are the major players in the market.
A total of 25 players are profiled in the report.

Hazardous Area Equipment Market Highlights

This report categorizes the hazardous area equipment market based on product, industry, geography.

Aspect

Details

Hazardous Area Equipment Market, by product:

  • Cable glands & accessories
  • Measurement devices
  • Control products
  • Alarm systems
    • Strobe beacon
    • Bells & horns
    • Call points
    • Speakers & tone generators
    • Visual & audible combination units
  • Motors
  • Lighting Product

Hazardous Area Equipment Market, by industry:

  • Oil & gas
  • Chemical & Pharmaceuticals
  • Food & beverages
  • Energy & power
  • Mining
  • Others
    • Pulp & paper
    • Water & wastewater treatment
    • Transportation

Hazardous Area Equipment Market, by region:

  • North America
    • US
    • Canada
    • Mexico
  • Europe
    • UK
    • Germany
    • Russia
    • Rest of Europe
  • Asia Pacific
    • China
    • Japan
    • South Korea
    • India
    • Rest of APAC
  • RoW
    • MEA
    • South Americ


Recent Developments in Hazardous Area Equipment Industry : 

  • In March 2021, Basler AG launched Embedded vision processing kit that includes various interfaces for image processing and allows the connection of different camera types. The kit includes the reliable pylon Camera Software Suite, which provides certified drivers for all types of camera interfaces, simple programming interfaces, and a comprehensive set of tools for camera setup.
  • In September 2021, KEYANCE launched High-resolution Camera, CV-X/XG-X Series of ultra-high resolution cameras, 64 mp camera significantly improves accuracy in conventional inspection. And the camera built-in angle sensor makes camera installation significantly easier and quickly detect camera misalignment during operation.

Frequently Asked Questions (FAQs):

To speak to our analyst for a discussion on the above findings, click Speak to Analyst

Exclusive indicates content/data unique to MarketsandMarkets and not available with any competitors.

 
TABLE OF CONTENTS
 
1 INTRODUCTION (Page No. - 28)
    1.1 STUDY OBJECTIVES 
    1.2 MARKET DEFINITION AND SCOPE 
           1.2.1 INCLUSIONS AND EXCLUSIONS
    1.3 STUDY SCOPE 
           1.3.1 MARKETS COVERED
                    FIGURE 1 HAZARDOUS AREA EQUIPMENT MARKET: SEGMENTATION
           1.3.2 GEOGRAPHIC SCOPE
                    FIGURE 2 MARKET: GEOGRAPHIC SEGMENTATION
           1.3.3 YEARS CONSIDERED
    1.4 CURRENCY CONSIDERED 
    1.5 UNITS CONSIDERED 
    1.6 LIMITATIONS 
    1.7 STAKEHOLDERS 
    1.8 SUMMARY OF CHANGES 
 
2 RESEARCH METHODOLOGY (Page No. - 33)
    2.1 RESEARCH DATA 
           FIGURE 3 HAZARDOUS AREA EQUIPMENT MARKET: RESEARCH DESIGN
           2.1.1 SECONDARY AND PRIMARY RESEARCH
           2.1.2 SECONDARY DATA
                    2.1.2.1 List of key secondary sources
                    2.1.2.2 Secondary sources
           2.1.3 PRIMARY DATA
                    2.1.3.1 Primary interviews with experts
                    2.1.3.2 List of key primary interview participants
                    2.1.3.3 Breakdown of primaries
                    2.1.3.4 Key data from primary sources
                    2.1.3.5 Key industry insights
    2.2 MARKET SIZE ESTIMATION 
           2.2.1 BOTTOM-UP APPROACH
                    2.2.1.1 Approach for arriving at market share by bottom-up analysis (demand side)
                               FIGURE 4 HAZARDOUS AREA EQUIPMENT MARKET: BOTTOM-UP APPROACH
           2.2.2 TOP-DOWN APPROACH
                    2.2.2.1 Approach for capturing market share by top-down analysis (supply side)
                               FIGURE 5 MARKET: TOP-DOWN APPROACH
                               FIGURE 6 MARKET: SUPPLY-SIDE ANALYSIS
    2.3 MARKET BREAKDOWN AND DATA TRIANGULATION 
           FIGURE 7 DATA TRIANGULATION
    2.4 RESEARCH ASSUMPTIONS 
 
3 EXECUTIVE SUMMARY (Page No. - 41)
    FIGURE 8 BY PRODUCT, CONTROL PRODUCTS SEGMENT TO REGISTER HIGHEST CAGR DURING FORECAST PERIOD
    FIGURE 9 BY INDUSTRY, OIL & GAS SEGMENT TO OFFER SIGNIFICANT GROWTH OPPORTUNITIES FROM 2023 TO 2028
    FIGURE 10 NORTH AMERICA ESTIMATED TO ACCOUNT FOR LARGEST MARKET SHARE IN 2022
 
4 PREMIUM INSIGHTS (Page No. - 44)
    4.1 ATTRACTIVE GROWTH OPPORTUNITIES FOR PLAYERS IN HAZARDOUS AREA EQUIPMENT MARKET 
           FIGURE 11 RISING GOVERNMENT REGULATIONS FOR SAFETY IN HAZARDOUS ENVIRONMENTS OF CRITICAL INDUSTRIES TO BOOST MARKET GROWTH
    4.2 MARKET, BY PRODUCT 
           FIGURE 12 CABLE GLANDS & ACCESSORIES SEGMENT TO HOLD LARGEST MARKET SIZE DURING FORECAST PERIOD
    4.3 HAZARDOUS AREA MARKET IN NORTH AMERICA, BY INDUSTRY AND COUNTRY 
           FIGURE 13 OIL & GAS AND US TO ACCOUNT FOR LARGEST MARKET SHARES IN NORTH AMERICA IN 2028
    4.4 MARKET, BY COUNTRY 
           FIGURE 14 US TO HOLD LARGEST SIZE OF  MARKET IN 2028
 
5 MARKET OVERVIEW (Page No. - 47)
    5.1 INTRODUCTION 
    5.2 MARKET DYNAMICS 
           FIGURE 15 HAZARDOUS AREA EQUIPMENT MARKET: DRIVERS, RESTRAINTS, OPPORTUNITIES, AND CHALLENGES
           5.2.1 DRIVERS
                    5.2.1.1 Rapid growth in industrialization and manufacturing sector
                    5.2.1.2 Rising government regulations for implementing safety measures in hazardous industrial environments
                    5.2.1.3 Adoption of technologically advanced LED light fixtures over conventional lighting solutions in hazardous areas
                               TABLE 1 FACTORS SUPPORTING ADOPTION OF LED LIGHTING SOLUTIONS
                                          FIGURE 16 MARKET DRIVERS: IMPACT ANALYSIS
           5.2.2 RESTRAINTS
                    5.2.2.1 High initial cost associated with deployment of hazardous area equipment
                    5.2.2.2 Poor classification of hazardous areas leads to time-consuming and expensive inspection and maintenance
                                    FIGURE 17 MARKET RESTRAINTS: IMPACT ANALYSIS
           5.2.3 OPPORTUNITIES
                    5.2.3.1 Rapid transition from traditional lighting systems to connected lighting solutions
                    5.2.3.2 Increasing demand for low-cost and high light-output-per-watt lighting solutions
                               FIGURE 18 MARKET OPPORTUNITIES: IMPACT ANALYSIS
           5.2.4 CHALLENGES
                    5.2.4.1 Lack of common standards
                               FIGURE 19 MARKET CHALLENGES: IMPACT ANALYSIS
    5.3 VALUE CHAIN ANALYSIS 
           FIGURE 20 VALUE CHAIN ANALYSIS OF MARKET
    5.4 ECOSYSTEM 
           FIGURE 21 HAZARDOUS AREA EQUIPMENT MARKET ECOSYSTEM
           TABLE 2 ROLE OF COMPANIES IN ECOSYSTEM/VALUE CHAIN
    5.5 PRICING ANALYSIS 
           TABLE 3 INDICATIVE PRICES OF HAZARDOUS AREA EQUIPMENT
           5.5.1 AVERAGE SELLING PRICES OF HAZARDOUS AREA EQUIPMENT OFFERED BY KEY PLAYERS
                    FIGURE 22 AVERAGE SELLING PRICES OF TYPES OF HAZARDOUS AREA EQUIPMENT OFFERED BY KEY PLAYERS
                    TABLE 4 AVERAGE SELLING PRICES OF DIFFERENT TYPES OF HAZARDOUS AREA EQUIPMENT OFFERED BY KEY PLAYERS (USD)
    5.6 TRENDS AND DISRUPTIONS IMPACTING CUSTOMER BUSINESS 
           FIGURE 23 REVENUE SHIFT IN MARKET
    5.7 TECHNOLOGY ANALYSIS 
           5.7.1 INDUSTRIAL INTERNET OF THINGS AND AI
           5.7.2 SMART WIRELESS SENSORS
    5.8 PORTER’S FIVE FORCES ANALYSIS 
           TABLE 5 PORTER’S FIVE FORCES ANALYSIS (2022)
           5.8.1 INTENSITY OF COMPETITIVE RIVALRY
           5.8.2 THREAT OF NEW ENTRANTS
           5.8.3 BARGAINING POWER OF SUPPLIERS
           5.8.4 BARGAINING POWER OF BUYERS
           5.8.5 THREAT OF SUBSTITUTES
    5.9 KEY STAKEHOLDERS AND BUYING CRITERIA 
           5.9.1 KEY STAKEHOLDERS IN BUYING PROCESS
                    FIGURE 24 INFLUENCE OF STAKEHOLDERS IN BUYING PROCESS FOR TOP THREE END-USE INDUSTRIES
                    TABLE 6 INFLUENCE OF STAKEHOLDERS IN BUYING PROCESS FOR TOP THREE END-USE INDUSTRIES (%)
           5.9.2 BUYING CRITERIA
                    FIGURE 25 KEY BUYING CRITERIA FOR TOP THREE END-USE INDUSTRIES
                    TABLE 7 KEY BUYING CRITERIA FOR TOP THREE END-USE INDUSTRIES
    5.10 USE CASES 
           5.10.1 MONITORING CORROSION UNDER INSULATION IN ATEX/IECEX HAZARDOUS AREA
           5.10.2 INTELLIGENT AND SECURE PROCESS VISUALIZATION IN POTENTIALLY EXPLOSIVE ATMOSPHERE
           5.10.3 GORGON OIL & GAS PROJECT – WESTERN AUSTRALIA: FLUORESCENT LIGHT FITTING FOR ZONE 1 & ZONE 2
           5.10.4 ROBINSON MINE IN NEVADA NOW EQUIPPED WITH VAPORGARD LED LUMINARIES
    5.11 TRADE ANALYSIS 
           FIGURE 26 EXPORT DATA FOR HS CODE 8531, 2017–2021 (USD MILLION)
           FIGURE 27 IMPORT DATA FOR HS CODE 8531, 2017–2021 (USD MILLION)
    5.12 PATENT ANALYSIS 
           FIGURE 28 NUMBER OF PATENTS GRANTED FROM 2012 TO 2021
           FIGURE 29 TOP 10 PATENT APPLICANTS
           TABLE 8 TOP 20 PATENT OWNERS IN LAST 10 YEARS
           TABLE 9 IMPORTANT PATENTS RELATED TO HAZARDOUS AREA EQUIPMENT MARKET
    5.13 KEY CONFERENCES AND EVENTS, 2023–2024 
           TABLE 10 HAZARDOUS AREA EQUIPMENT MARKET: CONFERENCES AND EVENTS, 2023–2024
    5.14 REGULATIONS AND STANDARDS 
           5.14.1 STANDARDS
                    TABLE 11 STANDARDS FOR MARKET
           5.14.2 REGULATORY BODIES, GOVERNMENT AGENCIES, AND OTHER ORGANIZATIONS
                    TABLE 12 NORTH AMERICA: REGULATORY BODIES, GOVERNMENT AGENCIES, AND OTHER ORGANIZATIONS
                    TABLE 13 EUROPE: REGULATORY BODIES, GOVERNMENT AGENCIES, AND OTHER ORGANIZATIONS
                    TABLE 14 ASIA PACIFIC: LIST OF REGULATORY BODIES, GOVERNMENT AGENCIES, AND OTHER ORGANIZATIONS
 
6 HAZARDOUS AREA EQUIPMENT MARKET, BY PRODUCT (Page No. - 72)
    6.1 INTRODUCTION 
           FIGURE 30 CONTROL PRODUCTS SEGMENT TO WITNESS HIGHEST CAGR FROM 2023 TO 2028
           TABLE 15 MARKET, BY PRODUCT, 2019–2022 (USD MILLION)
           TABLE 16 MARKET, BY PRODUCT, 2023–2028 (USD MILLION)
    6.2 CABLE GLANDS & ACCESSORIES 
           6.2.1 INCREASING NEED FOR MECHANICAL RETENTION, STRAIN RELIEF, AND EARTH CONTINUITY TO DRIVE DEMAND FOR HAZARDOUS AREA CABLE GLANDS & ACCESSORIES
                    TABLE 17 HAZARDOUS AREA CABLE GLANDS & ACCESSORIES MARKET, BY INDUSTRY, 2019–2022 (USD MILLION)
                    TABLE 18 HAZARDOUS AREA CABLE GLANDS & ACCESSORIES MARKET, BY INDUSTRY, 2023–2028 (USD MILLION)
    6.3 MEASUREMENT DEVICES 
           6.3.1 MEASUREMENT DEVICES GAINING IMPORTANCE DUE TO DEMAND FOR CONSISTENT PRODUCT QUALITY, SAFETY, PROCESS OPTIMIZATION, AND ENVIRONMENTAL PROTECTION
           6.3.2 VALVES
           6.3.3 PRESSURE TRANSMITTERS
           6.3.4 TEMPERATURE TRANSMITTERS
           6.3.5 LEVEL TRANSMITTERS
           6.3.6 FLOW METERS
           6.3.7 SENSORS
                    TABLE 19 HAZARDOUS AREA MEASUREMENT DEVICES MARKET, BY INDUSTRY, 2019–2022 (USD MILLION)
                    TABLE 20 HAZARDOUS AREA MEASUREMENT DEVICES MARKET, BY INDUSTRY, 2023–2028 (USD MILLION)
    6.4 CONTROL PRODUCTS 
           6.4.1 NEED FOR EFFECTIVE CONTROL OF PROCESSES IN HAZARDOUS APPLICATIONS IN SEVERAL INDUSTRIES TO FUEL DEMAND
           6.4.2 SOLID-STATE RELAYS
           6.4.3 SURGE PROTECTORS
           6.4.4 ENCLOSURES
           6.4.5 SIGNAL CONDITIONERS
           6.4.6 POWER SUPPLIES
                    TABLE 21 HAZARDOUS AREA CONTROL PRODUCTS MARKET, BY INDUSTRY, 2019–2022 (USD MILLION)
                    TABLE 22 HAZARDOUS AREA CONTROL PRODUCTS MARKET, BY INDUSTRY, 2023–2028 (USD MILLION)
    6.5 ALARM SYSTEMS 
           6.5.1 STROBE BEACONS
           6.5.2 BELLS & HORNS
           6.5.3 CALL POINTS
           6.5.4 SPEAKERS & TONE GENERATORS
           6.5.5 VISUAL & AUDIBLE COMBINATION UNITS
                    TABLE 23 HAZARDOUS AREA ALARM SYSTEMS MARKET, BY PRODUCT, 2019–2022 (USD MILLION)
                    TABLE 24 HAZARDOUS AREA ALARM SYSTEMS MARKET, BY PRODUCT, 2023–2028 (USD MILLION)
                    TABLE 25 HAZARDOUS AREA ALARM SYSTEMS MARKET, BY INDUSTRY, 2019–2022 (USD MILLION)
                    TABLE 26 HAZARDOUS AREA ALARM SYSTEMS MARKET, BY INDUSTRY, 2023–2028 (USD MILLION)
    6.6 MOTORS 
           TABLE 27 HAZARDOUS AREA MOTORS MARKET, BY INDUSTRY, 2019–2022 (USD MILLION)
           TABLE 28 HAZARDOUS AREA MOTORS MARKET, BY INDUSTRY, 2023–2028 (USD MILLION)
    6.7 LIGHTING PRODUCTS 
           TABLE 29 HAZARDOUS AREA LIGHTING PRODUCTS MARKET, BY INDUSTRY, 2019–2022 (USD MILLION)
           TABLE 30 HAZARDOUS AREA LIGHTING PRODUCTS MARKET, BY INDUSTRY, 2023–2028 (USD MILLION)
 
7 HAZARDOUS ZONE CLASSIFICATION (Page No. - 85)
    7.1 INTRODUCTION 
    7.2 ZONE 0 
    7.3 ZONE 1 
    7.4 ZONE 2 
    7.5 ZONE 20 
    7.6 ZONE 21 
    7.7 ZONE 22 
 
8 CONNECTIVITY SERVICES IN HAZARDOUS AREAS (Page No. - 87)
    8.1 INTRODUCTION 
    8.2 WIRED CONNECTIVITY SERVICE 
    8.3 WIRELESS CONNECTIVITY SERVICE 
 
9 HAZARDOUS AREA EQUIPMENT MARKET, BY INDUSTRY (Page No. - 88)
    9.1 INTRODUCTION 
           FIGURE 31 BY INDUSTRY, OIL & GAS SEGMENT TO LEAD MARKET DURING FORECAST PERIOD
           TABLE 31 HAZARDOUS AREA EQUIPMENT MARKET, BY INDUSTRY, 2019–2022 (USD MILLION)
           TABLE 32 MARKET, BY INDUSTRY, 2023–2028 (USD MILLION)
    9.2 OIL & GAS 
           9.2.1 CERTIFIED EQUIPMENT REQUIRED FOR CRITICAL PROCESSES IN HAZARDOUS AREAS IN OIL & GAS INDUSTRY
                    TABLE 33 MARKET FOR OIL & GAS INDUSTRY, BY PRODUCT, 2019–2022 (USD MILLION)
                    TABLE 34 MARKET FOR OIL & GAS INDUSTRY, BY PRODUCT, 2023–2028 (USD MILLION)
                    TABLE 35 MARKET FOR OIL & GAS INDUSTRY, BY REGION, 2019–2022 (USD MILLION)
                    TABLE 36 MARKET FOR OIL & GAS INDUSTRY, BY REGION, 2023–2028 (USD MILLION)
                    TABLE 37 NORTH AMERICA: MARKET FOR OIL & GAS INDUSTRY, BY COUNTRY, 2019–2022 (USD MILLION)
                    TABLE 38 NORTH AMERICA: MARKET FOR OIL & GAS INDUSTRY, BY COUNTRY, 2023–2028 (USD MILLION)
                    TABLE 39 EUROPE: MARKET FOR OIL & GAS INDUSTRY, BY COUNTRY, 2019–2022 (USD MILLION)
                    TABLE 40 EUROPE: MARKET FOR OIL & GAS INDUSTRY, BY COUNTRY, 2023–2028 (USD MILLION)
                    TABLE 41 ASIA PACIFIC: MARKET FOR OIL & GAS INDUSTRY, BY COUNTRY, 2019–2022 (USD MILLION)
                    TABLE 42 ASIA PACIFIC: HAZARDOUS AREA EQUIPMENT MARKET FOR OIL & GAS INDUSTRY, BY COUNTRY, 2023–2028 (USD MILLION)
                    TABLE 43 ROW: MARKET FOR OIL & GAS INDUSTRY, BY REGION, 2019–2022 (USD MILLION)
                    TABLE 44 ROW: MARKET FOR OIL & GAS INDUSTRY, BY REGION, 2023–2028 (USD MILLION)
    9.3 CHEMICAL & PHARMACEUTICAL 
           9.3.1 EXPANDING CHEMICAL & PHARMACEUTICAL INDUSTRIES IN EMERGING ECONOMIES TO LEAD TO INCREASED REQUIREMENT FOR HAZARDOUS AREA EQUIPMENT
                    TABLE 45 HAZARDOUS AREA EQUIPMENT MARKET FOR CHEMICAL & PHARMACEUTICAL INDUSTRY, BY PRODUCT, 2019–2022 (USD MILLION)
                    TABLE 46 MARKET FOR CHEMICAL & PHARMACEUTICAL INDUSTRY, BY PRODUCT, 2023–2028 (USD MILLION)
                    TABLE 47 MARKET FOR CHEMICAL & PHARMACEUTICAL INDUSTRY, BY REGION, 2019–2022 (USD MILLION)
                    TABLE 48 MARKET FOR CHEMICAL & PHARMACEUTICAL INDUSTRY, BY REGION, 2023–2028 (USD MILLION)
                    TABLE 49 NORTH AMERICA: MARKET FOR CHEMICAL & PHARMACEUTICAL INDUSTRY, BY COUNTRY, 2019–2022 (USD MILLION)
                    TABLE 50 NORTH AMERICA: MARKET FOR CHEMICAL & PHARMACEUTICAL INDUSTRY, BY COUNTRY, 2023–2028 (USD MILLION)
                    TABLE 51 EUROPE: MARKET FOR OIL & GAS INDUSTRY, BY COUNTRY, 2019–2022 (USD MILLION)
                    TABLE 52 EUROPE: MARKET FOR OIL & GAS INDUSTRY, BY COUNTRY, 2023–2028 (USD MILLION)
                    TABLE 53 ASIA PACIFIC: MARKET FOR CHEMICAL & PHARMACEUTICAL INDUSTRY, BY COUNTRY, 2019–2022 (USD MILLION)
                    TABLE 54 ASIA PACIFIC: MARKET FOR CHEMICAL & PHARMACEUTICAL INDUSTRY, BY COUNTRY, 2023–2028 (USD MILLION)
                    TABLE 55 ROW: MARKET FOR CHEMICAL & PHARMACEUTICAL INDUSTRY, BY REGION, 2019–2022 (USD MILLION)
                    TABLE 56 ROW: MARKET FOR CHEMICAL & PHARMACEUTICAL INDUSTRY, BY REGION, 2023–2028 (USD MILLION)
    9.4 FOOD & BEVERAGE 
           9.4.1 PRESENCE OF COMBUSTIBLE GASES, LIQUIDS, AND SOLIDS NECESSITATES INSTALLATION OF HAZARDOUS AREA EQUIPMENT IN SEVERAL FOOD & BEVERAGE PROCESSES
                    TABLE 57 HAZARDOUS AREA EQUIPMENT MARKET FOR FOOD & BEVERAGE INDUSTRY, BY PRODUCT, 2019–2022 (USD MILLION)
                    TABLE 58 MARKET FOR FOOD & BEVERAGE INDUSTRY, BY PRODUCT, 2023–2028 (USD MILLION)
                    TABLE 59 MARKET FOR FOOD & BEVERAGE INDUSTRY, BY REGION, 2019–2022 (USD MILLION)
                    TABLE 60 MARKET FOR FOOD & BEVERAGE INDUSTRY, BY REGION, 2023–2028 (USD MILLION)
                    TABLE 61 NORTH AMERICA: MARKET FOR FOOD & BEVERAGE INDUSTRY, BY COUNTRY, 2019–2022 (USD MILLION)
                    TABLE 62 NORTH AMERICA: MARKET FOR FOOD & BEVERAGE INDUSTRY, BY COUNTRY, 2023–2028 (USD MILLION)
                    TABLE 63 EUROPE: MARKET FOR FOOD & BEVERAGE INDUSTRY, BY COUNTRY, 2019–2022 (USD MILLION)
                    TABLE 64 EUROPE: HAZARDOUS AREA EQUIPMENT MARKET FOR FOOD & BEVERAGE INDUSTRY, BY COUNTRY, 2023–2028 (USD MILLION)
                    TABLE 65 ASIA PACIFIC: MARKET FOR FOOD & BEVERAGE INDUSTRY, BY COUNTRY, 2019–2022 (USD MILLION)
                    TABLE 66 ASIA PACIFIC: MARKET FOR FOOD & BEVERAGE INDUSTRY, BY COUNTRY, 2023–2028 (USD MILLION)
                    TABLE 67 ROW: MARKET FOR FOOD & BEVERAGE INDUSTRY, BY REGION, 2019–2022 (USD MILLION)
                    TABLE 68 ROW: MARKET FOR FOOD & BEVERAGE INDUSTRY, BY REGION, 2023–2028 (USD MILLION)
    9.5 ENERGY & POWER 
           9.5.1 WIRELESS TECHNOLOGY ENABLES SIMPLIFIED OPERATIONS OF HAZARDOUS AREA EQUIPMENT WITH HIGHER EFFICIENCY IN ENERGY & POWER INDUSTRY
                    TABLE 69 HAZARDOUS AREA EQUIPMENT MARKET FOR ENERGY & POWER INDUSTRY, BY PRODUCT, 2019–2022 (USD MILLION)
                    TABLE 70 MARKET FOR ENERGY & POWER INDUSTRY, BY PRODUCT, 2023–2028 (USD MILLION)
                    TABLE 71 MARKET FOR ENERGY & POWER INDUSTRY, BY REGION, 2019–2022 (USD MILLION)
                    TABLE 72 MARKET FOR ENERGY & POWER INDUSTRY, BY REGION, 2023–2028 (USD MILLION)
                    TABLE 73 NORTH AMERICA: MARKET FOR ENERGY & POWER INDUSTRY, BY COUNTRY, 2019–2022 (USD MILLION)
                    TABLE 74 NORTH AMERICA: HAZARDOUS AREA EQUIPMENT MARKET FOR ENERGY & POWER INDUSTRY, BY COUNTRY, 2023–2028 (USD MILLION)
                    TABLE 75 EUROPE: MARKET FOR ENERGY & POWER INDUSTRY, BY COUNTRY, 2019–2022 (USD MILLION)
                    TABLE 76 EUROPE: MARKET FOR ENERGY & POWER INDUSTRY, BY COUNTRY, 2023–2028 (USD MILLION)
                    TABLE 77 ASIA PACIFIC: MARKET FOR ENERGY & POWER INDUSTRY, BY COUNTRY, 2019–2022 (USD MILLION)
                    TABLE 78 ASIA PACIFIC: MARKET FOR ENERGY & POWER INDUSTRY, BY COUNTRY, 2023–2028 (USD MILLION)
                    TABLE 79 ROW: MARKET FOR ENERGY & POWER INDUSTRY, BY REGION, 2019–2022 (USD MILLION)
                    TABLE 80 ROW: MARKET FOR ENERGY & POWER INDUSTRY, BY REGION, 2023–2028 (USD MILLION)
    9.6 MINING 
           9.6.1 INCREASE IN MINING INFRASTRUCTURE DEVELOPMENT ACTIVITIES IN EMERGING ECONOMIES TO DRIVE DEMAND
                    TABLE 81 HAZARDOUS AREA EQUIPMENT MARKET FOR MINING INDUSTRY, BY PRODUCT, 2019–2022 (USD MILLION)
                    TABLE 82 MARKET FOR MINING INDUSTRY, BY PRODUCT, 2023–2028 (USD MILLION)
                    TABLE 83 MARKET FOR MINING INDUSTRY, BY REGION, 2019–2022 (USD MILLION)
                    TABLE 84 MARKET FOR MINING INDUSTRY, BY REGION, 2023–2028 (USD MILLION)
                    TABLE 85 NORTH AMERICA: MARKET FOR MINING INDUSTRY, BY COUNTRY, 2019–2022 (USD MILLION)
                    TABLE 86 NORTH AMERICA: MARKET FOR MINING INDUSTRY, BY COUNTRY, 2023–2028 (USD MILLION)
                    TABLE 87 EUROPE: MARKET FOR MINING INDUSTRY, BY COUNTRY, 2019–2022 (USD MILLION)
                    TABLE 88 EUROPE: MARKET FOR MINING INDUSTRY, BY COUNTRY, 2023–2028 (USD MILLION)
                    TABLE 89 ASIA PACIFIC: MARKET FOR MINING INDUSTRY, BY COUNTRY, 2019–2022 (USD MILLION)
                    TABLE 90 ASIA PACIFIC: MARKET FOR MINING INDUSTRY, BY COUNTRY, 2023–2028 (USD MILLION)
                    TABLE 91 ROW: MARKET FOR MINING INDUSTRY, BY REGION, 2019–2022 (USD MILLION)
                    TABLE 92 ROW: MARKET FOR MINING INDUSTRY, BY REGION, 2023–2028 (USD MILLION)
    9.7 OTHERS 
           TABLE 93 HAZARDOUS AREA EQUIPMENT MARKET FOR OTHER INDUSTRIES, BY PRODUCT, 2019–2022 (USD MILLION)
           TABLE 94 MARKET FOR OTHER INDUSTRIES, BY PRODUCT, 2023–2028 (USD MILLION)
           TABLE 95 MARKET FOR OTHER INDUSTRIES, BY REGION, 2019–2022 (USD MILLION)
           TABLE 96 MARKET FOR OTHER INDUSTRIES, BY REGION, 2023–2028 (USD MILLION)
           TABLE 97 NORTH AMERICA: MARKET FOR OTHER INDUSTRIES, BY COUNTRY, 2019–2022 (USD MILLION)
           TABLE 98 NORTH AMERICA: MARKET FOR OTHER INDUSTRIES, BY COUNTRY, 2023–2028 (USD MILLION)
           TABLE 99 EUROPE: MARKET FOR OTHER INDUSTRIES, BY COUNTRY, 2019–2022 (USD MILLION)
           TABLE 100 EUROPE: MARKET FOR OTHER INDUSTRIES, BY COUNTRY, 2023–2028 (USD MILLION)
           TABLE 101 ASIA PACIFIC: HAZARDOUS AREA EQUIPMENT MARKET FOR OTHER INDUSTRIES, BY COUNTRY, 2019–2022 (USD MILLION)
           TABLE 102 ASIA PACIFIC: MARKET FOR OTHER INDUSTRIES, BY COUNTRY, 2023–2028 (USD MILLION)
           TABLE 103 ROW: MARKET FOR OTHER INDUSTRIES, BY REGION, 2019–2022 (USD MILLION)
           TABLE 104 ROW: MARKET FOR OTHER INDUSTRIES, BY REGION, 2023–2028 (USD MILLION)
 
10 HAZARDOUS AREA EQUIPMENT MARKET, BY REGION (Page No. - 117)
     10.1 INTRODUCTION 
             FIGURE 32 GEOGRAPHIC SNAPSHOT OF HAZARDOUS AREA EQUIPMENT MARKET, 2023–2028
             TABLE 105 MARKET, BY REGION, 2019–2022 (USD MILLION)
             TABLE 106 MARKET, BY REGION, 2023–2028 (USD MILLION)
     10.2 NORTH AMERICA 
             FIGURE 33 NORTH AMERICA: MARKET SNAPSHOT
             TABLE 107 NORTH AMERICA: MARKET, BY COUNTRY, 2019–2022 (USD MILLION)
             TABLE 108 NORTH AMERICA: MARKET, BY COUNTRY, 2023–2028 (USD MILLION)
             TABLE 109 NORTH AMERICA: HAZARDOUS AREA EQUIPMENT MARKET, BY INDUSTRY, 2019–2022 (USD MILLION)
             TABLE 110 NORTH AMERICA: MARKET, BY INDUSTRY, 2023–2028 (USD MILLION)
             10.2.1 US
                        10.2.1.1 Significant presence of leading oil & gas companies to drive demand for hazardous area equipment
             10.2.2 CANADA
                        10.2.2.1 Thriving chemical & pharmaceutical industries to boost market
             10.2.3 MEXICO
                        10.2.3.1 Increasing investments in chemical industry to drive market
     10.3 EUROPE 
             FIGURE 34 EUROPE: MARKET SNAPSHOT
             TABLE 111 EUROPE: HAZARDOUS AREA EQUIPMENT MARKET, BY COUNTRY, 2019–2022 (USD MILLION)
             TABLE 112 EUROPE: MARKET, BY COUNTRY, 2023–2028 (USD MILLION)
             TABLE 113 EUROPE: MARKET, BY INDUSTRY, 2019–2022 (USD MILLION)
             TABLE 114 EUROPE: MARKET, BY INDUSTRY, 2023–2028 (USD MILLION)
             10.3.1 UK
                        10.3.1.1 Rapid infrastructure development with growing investment by several industries to fuel market growth
             10.3.2 GERMANY
                        10.3.2.1 Presence of renowned chemical and pharmaceutical companies to drive market
             10.3.3 RUSSIA
                        10.3.3.1 Large oil & gas industry to fuel demand for hazardous area equipment
             10.3.4 REST OF EUROPE
     10.4 ASIA PACIFIC 
             FIGURE 35 ASIA PACIFIC: HAZARDOUS AREA EQUIPMENT MARKET SNAPSHOT
             TABLE 115 ASIA PACIFIC: MARKET, BY COUNTRY, 2019–2022 (USD MILLION)
             TABLE 116 ASIA PACIFIC: MARKET, BY COUNTRY, 2023–2028 (USD MILLION)
             TABLE 117 ASIA PACIFIC: MARKET, BY INDUSTRY, 2019–2022 (USD MILLION)
             TABLE 118 ASIA PACIFIC: MARKET, BY INDUSTRY, 2023–2028 (USD MILLION)
             10.4.1 CHINA
                        10.4.1.1 Availability of cost-effective raw materials allows China to capture leading market position
             10.4.2 JAPAN
                        10.4.2.1 Chemical & pharmaceutical industries in Japan to witness significant demand for hazardous area equipment
             10.4.3 INDIA
                        10.4.3.1 Presence of leading pharmaceutical companies to drive market
             10.4.4 SOUTH KOREA
                        10.4.4.1 Strong focus on modification of manufacturing facilities to fuel market growth
             10.4.5 REST OF ASIA PACIFIC
     10.5 REST OF THE WORLD (ROW) 
             TABLE 119 ROW: MARKET, BY REGION, 2019–2022 (USD MILLION)
             TABLE 120 ROW: HAZARDOUS AREA EQUIPMENT MARKET, BY REGION, 2023–2028 (USD MILLION)
             TABLE 121 ROW: MARKET, BY INDUSTRY, 2019–2022 (USD MILLION)
             TABLE 122 ROW: MARKET, BY INDUSTRY, 2023–2028 (USD MILLION)
             10.5.1 MIDDLE EAST & AFRICA
                        10.5.1.1 Presence of world’s largest oil & gas industries to drive demand for hazardous area equipment
             10.5.2 SOUTH AMERICA
                        10.5.2.1 Surging investments in offshore & onshore rigs to create growth prospects for hazardous area equipment manufacturers
 
11 COMPETITIVE LANDSCAPE (Page No. - 133)
     11.1 OVERVIEW 
     11.2 COMPANY REVENUE ANALYSIS, 2017–2021 
             FIGURE 36 FIVE-YEAR REVENUE ANALYSIS OF TOP FIVE PLAYERS, 2017–2021
     11.3 MARKET SHARE ANALYSIS, 2022 
             TABLE 123 DEGREE OF COMPETITION
     11.4 COMPANY EVALUATION QUADRANT 
             11.4.1 STARS
             11.4.2 PERVASIVE PLAYERS
             11.4.3 EMERGING LEADERS
             11.4.4 PARTICIPANTS
                        FIGURE 37 COMPANY EVALUATION QUADRANT, 2022
     11.5 COMPANY FOOTPRINT 
             TABLE 124 FOOTPRINTS OF COMPANIES
             TABLE 125 INDUSTRY FOOTPRINT OF COMPANIES
             TABLE 126 PRODUCT FOOTPRINT OF COMPANIES
             TABLE 127 REGION FOOTPRINT OF COMPANIES
     11.6 SME EVALUATION QUADRANT 
             11.6.1 PROGRESSIVE COMPANIES
             11.6.2 RESPONSIVE COMPANIES
             11.6.3 DYNAMIC COMPANIES
             11.6.4 STARTING BLOCKS
                        FIGURE 38 SME EVALUATION QUADRANT, 2022
     11.7 STARTUP EVALUATION MATRIX 
             TABLE 128 DETAILED LIST OF KEY SMES
             TABLE 129 COMPETITIVE BENCHMARKING OF KEY SMES
     11.8 COMPETITIVE SCENARIO 
             11.8.1 PRODUCT LAUNCHES
                        TABLE 130 PRODUCT LAUNCHES, 2020–2022
 
12 COMPANY PROFILES (Page No. - 144)
(Business Overview, Products/Solutions/Services Offered, Recent Developments, MnM view (Key strengths/Right to win, Strategic choices made, Weakness/competitive threats)*  
     12.1 KEY PLAYERS 
             12.1.1 SIEMENS AG
                        TABLE 131 SIEMENS AG: COMPANY OVERVIEW
                        FIGURE 39 SIEMENS AG: COMPANY SNAPSHOT
                        TABLE 132 SIEMENS AG: PRODUCT OFFERINGS
                        TABLE 133 SIEMENS AG: PRODUCT LAUNCHES & DEVELOPMENTS
             12.1.2 HONEYWELL INTERNATIONAL INC.
                        TABLE 134 HONEYWELL INTERNATIONAL INC.: COMPANY OVERVIEW
                        FIGURE 40 HONEYWELL INTERNATIONAL INC.: COMPANY SNAPSHOT
                        TABLE 135 HONEYWELL INTERNATIONAL INC.: PRODUCT OFFERINGS
             12.1.3 ABB LTD.
                        TABLE 136 ABB LTD.: COMPANY OVERVIEW
                        FIGURE 41 ABB LTD.: COMPANY SNAPSHOT
                        TABLE 137 ABB LTD.: PRODUCT OFFERINGS
             12.1.4 ROCKWELL AUTOMATION, INC.
                        TABLE 138 ROCKWELL AUTOMATION INC.: COMPANY OVERVIEW
                        FIGURE 42 ROCKWELL AUTOMATION INC.: COMPANY SNAPSHOT
                        TABLE 139 ROCKWELL AUTOMATION INC.: PRODUCT OFFERINGS
             12.1.5 EATON CORPORATION PLC
                        TABLE 140 EATON CORPORATION PLC: COMPANY OVERVIEW
                        FIGURE 43 EATON CORPORATION PLC: COMPANY SNAPSHOT
                        TABLE 141 EATON CORPORATION PLC: PRODUCT OFFERINGS
                        TABLE 142 EATON CORPORATION PLC: PRODUCT LAUNCHES & DEVELOPMENTS
             12.1.6 EMERSON ELECTRIC CO.
                        TABLE 143 EMERSON ELECTRIC CO.: COMPANY OVERVIEW
                        FIGURE 44 EMERSON ELECTRIC CO.: COMPANY SNAPSHOT
                        TABLE 144 EMERSON ELECTRIC CO.: PRODUCT OFFERINGS
                        TABLE 145 EMERSON ELECTRIC CO.: PRODUCT LAUNCHES & DEVELOPMENTS
             12.1.7 PATLITE CORPORATION
                        TABLE 146 PATLITE CORPORATION: COMPANY OVERVIEW
                        TABLE 147 PATLITE CORPORATION: PRODUCT OFFERINGS
             12.1.8 R. STAHL AG
                        TABLE 148 R. STHAL AG: COMPANY OVERVIEW
                        FIGURE 45 R. STHAL AG: COMPANY SNAPSHOT
                        TABLE 149 R. STAHL AG: PRODUCT OFFERINGS
             12.1.9 E2S WARNING SIGNALS
                        TABLE 150 E2S WARNING SIGNALS: COMPANY OVERVIEW
                        TABLE 151 E3S WARNING SIGNALS: PRODUCT OFFERINGS
             12.1.10 NHP ELECTRICAL ENGINEERING PRODUCTS PTY LTD
                        TABLE 152 NHP ELECTRICAL ENGINEERING PRODUCTS PTY LTD: COMPANY OVERVIEW
                        TABLE 153 NHP ELECTRICAL ENGINEERING PRODUCTS PTY LTD: PRODUCT OFFERINGS
     12.2 OTHER PLAYERS 
             12.2.1 WERMA SIGNALTECHNIK GMBH
                        TABLE 154 WERMA SIGNALTECHNIK GMBH: COMPANY OVERVIEW
             12.2.2 FEDERAL SIGNAL CORPORATION
                        TABLE 155 FEDERAL SIGNAL CORPORATION: COMPANY OVERVIEW
             12.2.3 POTTER ELECTRIC SIGNAL COMPANY
                        TABLE 156 POTTER ELECTRIC SIGNAL COMPANY: COMPANY OVERVIEW
             12.2.4 TOMAR ELECTRONICS, INC.
                        TABLE 157 TOMAR ELECTRONICS, INC.: COMPANY OVERVIEW
             12.2.5 QUINTEX GMBH
                        TABLE 158 QUINTEX GMBH: COMPANY OVERVIEW
             12.2.6 PEPPERL+FUCHS SE (GERMANY)
                        TABLE 159 PEPPERL+FUCHS SE (GERMANY): COMPANY OVERVIEW
             12.2.7 SCHNEIDER ELECTRIC
                        TABLE 160 SCHNEIDER ELECTRIC: COMPANY OVERVIEW
             12.2.8 LGM PRODUCTS LTD
                        TABLE 161 LGM PRODUCTS LTD: COMPANY OVERVIEW
             12.2.9 CHING MARS CORPORATION
                        TABLE 162 CHING MARS CORPORATION: COMPANY OVERVIEW
             12.2.10 THORNE & DERRICK INTERNATIONAL
                        TABLE 163 THORNE & DERRICK INTERNATIONAL: BUSINESS OVERVIEW
             12.2.11 EXTRONICS LTD.
                        TABLE 164 EXTRONICS LTD.: COMPANY OVERVIEW
             12.2.12 HAWKE INTERNATIONAL
                        TABLE 165 HAWKE INTERNATIONAL: COMPANY OVERVIEW
             12.2.13 CORTEM S.P.A.
                        TABLE 166 CORTEM S.P.A.: COMPANY OVERVIEW
             12.2.14 RAYTEC
                        TABLE 167 RAYTEC: COMPANY OVERVIEW
             12.2.15 CESP
                        TABLE 168 CESP: BUSINESS OVERVIEW
*Details on Business Overview, Products/Solutions/Services Offered, Recent Developments, MnM view (Key strengths/Right to win, Strategic choices made, Weakness/competitive threats)* might not be captured in case of unlisted companies.  
 
13 ADJACENT & RELATED MARKETS (Page No. - 183)
     13.1 INTRODUCTION 
     13.2 LIMITATIONS 
     13.3 EXPLOSION-PROOF LIGHTING MARKET, BY TYPE 
             13.3.1 INTRODUCTION
                        TABLE 169 EXPLOSION-PROOF LIGHTING MARKET, BY TYPE, 2017–2020 (USD MILLION)
                        TABLE 170 EXPLOSION-PROOF LIGHTING MARKET, BY TYPE, 2021–2026 (USD MILLION)
     13.4 HIGH BAY & LOW BAY 
             13.4.1 EXCELLENT LUMEN OUTPUT AND DIRECTIONAL LIGHTING FOR HIGH CEILING APPLICATIONS TO FUEL DEMAND FOR HIGH BAY & LOW BAY LIGHT FIXTURES
                        TABLE 171 EXPLOSION-PROOF LIGHTING MARKET FOR HIGH BAY & LOW BAY LIGHTS, BY REGION, 2017–2020 (USD MILLION)
                        TABLE 172 EXPLOSION-PROOF LIGHTING MARKET FOR HIGH BAY & LOW BAY LIGHTS, BY REGION, 2021–2026 (USD MILLION)
     13.5 LINEAR 
             13.5.1 RECENT DEVELOPMENTS IN EXPLOSION-PROOF LINEAR LIGHTING TECHNOLOGY TO DRIVE MARKET
                        TABLE 173 EXPLOSION-PROOF LIGHTING MARKET FOR LINEAR LIGHTS, BY REGION, 2017–2020 (USD MILLION)
                        TABLE 174 EXPLOSION-PROOF LIGHTING MARKET FOR LINEAR LIGHTS, BY REGION, 2021–2026 (USD MILLION)
     13.6 FLOOD 
             13.6.1 STRONG FOCUS OF END-USER INDUSTRIES ON ADOPTION OF ENERGY-EFFICIENT AND STURDY LIGHTING SOLUTIONS IN OUTDOOR ENVIRONMENTS TO PROMOTE MARKET GROWTH
                        TABLE 175 EXPLOSION-PROOF LIGHTING MARKET FOR FLOODLIGHTS, BY REGION, 2017–2020 (USD MILLION)
                        TABLE 176 EXPLOSION-PROOF LIGHTING MARKET FOR FLOODLIGHTS, BY REGION, 2021–2026 (USD MILLION)
 
14 APPENDIX (Page No. - 189)
     14.1 DISCUSSION GUIDE 
     14.2 KNOWLEDGESTORE: MARKETSANDMARKETS’ SUBSCRIPTION PORTAL 
     14.3 CUSTOMIZATION OPTIONS 
     14.4 RELATED REPORTS 
     14.5 AUTHOR DETAILS 

The study involved four major activities in estimating the size of hazardous area equipment market. Exhaustive secondary research was done to collect information on the market, peer market, and parent market. The next step was to validate these findings, assumptions, and sizing with industry experts across value chains through primary research. The bottom-up approach was employed to estimate the overall market size. After that, market breakdown and data triangulation were used to estimate the market size of segments and subsegments.

Secondary Research

In the secondary research process, various sources were referred to for identifying and collecting information important for this study. Secondary sources include corporate filings (such as annual reports, investor presentations, and financial statements); trade, business, and professional associations; white papers, hazardous area equipment-related journals, and certified publications; articles by recognized authors; gold and silver standard websites; and directories.

Secondary research was mainly conducted to obtain key information about the market value chain, the industry supply chain, the total pool of key players, market classification and segmentation according to industry trends to the bottom-most level, and key developments from both markets- and technology-oriented perspectives. Data from secondary research was collected and analyzed to arrive at the overall market size, which was further validated by primary research.

Primary Research

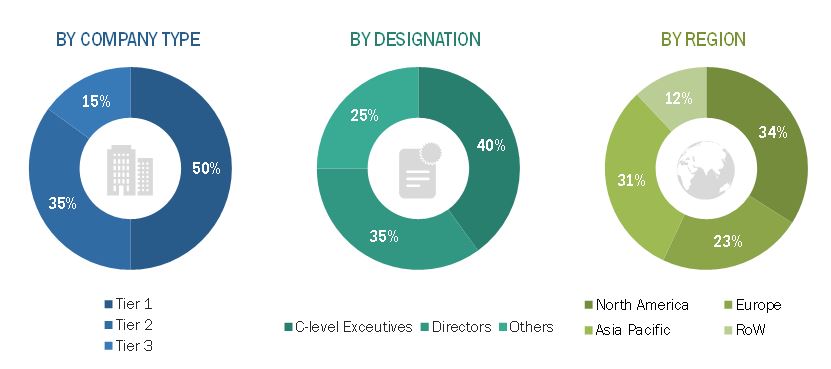
Extensive primary research has been conducted after understanding and analyzing the hazardous area equipment market through secondary research. Several primary telephonic interviews have been conducted with key opinion leaders from the demand- and supply-side vendors across four major regions—North America, Europe, Asia Pacific, and the Rest of the World (RoW). Moreover, questionnaires and emails were also used to collect the data.
Hazardous Area Equipment Market Size, and Share

To know about the assumptions considered for the study, download the pdf brochure

Market Size Estimation

In this report for the complete market engineering process, both top-down and bottom-up approaches were used, along with several data triangulation methods, to estimate, forecast and validate the size of the market and its segments and subsegments listed in the report. Extensive qualitative and quantitative analyses were carried out to list the key information/insights pertaining to the hazardous area equipment market.

Major players in the hazardous area equipment market have been identified through secondary research, and their market shares in the respective regions have been determined through primary and secondary research. The entire research methodology included the study of annual and financial reports of top players and interviews with experts (such as CEOs, VPs, directors, and marketing executives) for key insights (quantitative and qualitative). All percentage shares, splits, and breakdowns have been determined using secondary sources and verified through primary sources. This data was consolidated and enhanced with detailed inputs and analysis from MarketsandMarkets and presented in this report.

Hazardous Area Equipment Market: Bottom-Up Approach

Hazardous Area Equipment Market Size, and Bottom-Up Approach

Hazardous Area Equipment Market: Top-Down Approach

Hazardous Area Equipment Market Size, and Top-Down Approach

Data Triangulation

After arriving at the overall size of the hazardous area equipment market from the estimation process explained above, the total market was split into several segments and subsegments. The market breakdown and data triangulation procedures were employed, wherever applicable, to complete the overall market engineering process and arrive at the exact statistics for all segments and subsegments. The data was triangulated by studying various factors and trends from both the demand and supply sides. Along with this, the market size was validated using both the top-down and bottom-up approaches.

Report Objectives

  • To describe and forecast the hazardous area equipment market size, in terms of value, by product and industry
  • To describe and forecast the market size, in terms of value, by region—North America, Europe,
    Asia Pacific, and the Rest of the World (RoW)
  • To provide detailed information regarding the drivers, restraints, opportunities, and challenges influencing market growth
  • To provide a detailed overview of the process flow of the hazardous area equipment market
  • To analyze opportunities for stakeholders in the hazardous area equipment market by identifying its high-growth segments
  • To strategically analyze micromarkets with respect to individual growth trends, prospects, and contributions to the overall market
  • To strategically profile key players and comprehensively analyze their market shares and core competencies along with detailing the competitive leadership and analyzing growth strategies such as product launches and developments, expansions, acquisitions, agreements, mergers, joint ventures, and partnerships of leading players

Available Customizations

With the given market data, MarketsandMarkets offers customizations according to the specific requirements of companies. The following customization options are available for the report:

Product Analysis

  • Detailed analysis and profiling of additional market players
Custom Market Research Services

We will customize the research for you, in case the report listed above does not meet with your exact requirements. Our custom research will comprehensively cover the business information you require to help you arrive at strategic and profitable business decisions.

Request Customization
Report Code
SE 5205
Published ON
Dec, 2022
Choose License Type
BUY NOW
  • SHARE
X
Request Customization
Speak to Analyst
Speak to Analyst
OR FACE-TO-FACE MEETING
PERSONALIZE THIS RESEARCH
  • Triangulate with your Own Data
  • Get Data as per your Format and Definition
  • Gain a Deeper Dive on a Specific Application, Geography, Customer or Competitor
  • Any level of Personalization
REQUEST A FREE CUSTOMIZATION
LET US HELP YOU!
  • What are the Known and Unknown Adjacencies Impacting the Hazardous Area Equipment Market
  • What will your New Revenue Sources be?
  • Who will be your Top Customer; what will make them switch?
  • Defend your Market Share or Win Competitors
  • Get a Scorecard for Target Partners
CUSTOMIZED WORKSHOP REQUEST
knowledgestore logo

Want to explore hidden markets that can drive new revenue in Hazardous Area Equipment Market?

Find Hidden Markets
  • Call Us
  • +1-888-600-6441 (Corporate office hours)
  • +1-888-600-6441 (US/Can toll free)
  • +44-800-368-9399 (UK office hours)
CONNECT WITH US
ABOUT TRUST ONLINE
©2024 MarketsandMarkets Research Private Ltd. All rights reserved
DMCA.com Protection Status
Website Feedback