Guar Gum Market by Function (Thickening, Gelling, Binding, Friction Reducing), Application (Food & Beverages, Oil & Gas, Paper Manufacturing, Mining & Explosives, Pharmaceuticals & Cosmetics), Grade, and Region - Global Forecast to 2022


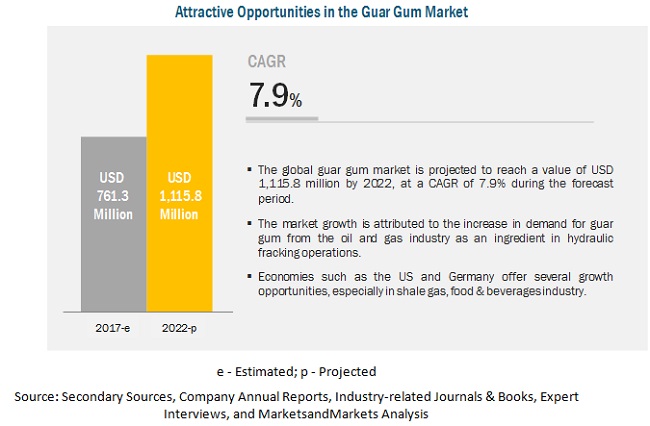
[162 Pages Report]The guar gum market is projected to grow at a CAGR of 7.9% from 2017 to 2022, to reach USD 1.15 billion by 2022. The major factor driving growth in the market is the increasing application of guar gum due to its multifunctional properties and increased health consciousness among consumers about healthy foods. Guar gum is also being increasingly used in different industries such as food, oil & gas, and pharmaceuticals. It performs a wide range of functions such as acting as a friction reducer, binder, thickener, stabilizer, and gelling agent.
The industrial-grade guar gum products dominated the market in 2017
The industrial-grade guar gum products accounted for the largest share of the market in 2017. These are used in various applications such as well fracturing, oil well stimulation, oil recovery, oil well drilling, geological drilling, and water drilling. It acts as a deformer, surfactant, and synthetic polymer in these applications. The rapid growth in oil drilling and oil recovery activities in the North American and Middle Eastern countries, along with the increase in the usage of guar gum for the extraction of unconventional sources of oil is expected to drive the market for industrial grade guar gum products during the forecast period.
On the basis of function, the gelling agent accounted for the largest share in 2017.
The gelling agent function of guar gum is having the maximum share due to its large scale application in the oil & gas industry as an ingredient in the hydraulic fracking process. It is widely used in the oil drilling industry to increase the production rate of oil & gas, owing to its multifunctionality for fluid & water loss control, lubrication and cooling of drill bits, and as a shale inhibitor.
Bakery & confectionery segment accounted for the largest share of the guar gum market in 2017.
The bakery & confectionery products segment accounted for the largest share of the global guar gum market in 2017. Guar gum is used in numerous confectionery products, such as gummy and chewy confections, aerated confections and marshmallows, confectionery jellies, jelly beans, fruit leathers, caramels, fondants, pastes, and liquid centers/fillings. It increases the shelf life and controls and accelerates the setting time. The key factor responsible for the demand for guar gum in confectionery applications is the advantages offered by this product, such as better flavor release, reduced hot viscosity, good gel clarity.
The oil & gas segment accounted for the largest application share of guar gum in 2017
On the basis of application, the oil & gas segment accounted for the largest share of the market in 2017. Industrial grade guar gum powder is used in various oil & gas industry applications such as oil well fracturing; oil well stimulation; and oil recovery to serve multiple purposes such as reducing water mobility and providing enhanced stability against salt, temperature, and shear. Due to its high viscosity, guar gum is widely used in oil well drilling, geological drilling, and water drilling activities; it enables drilling fluids to remove drill waste from deep holes. In the oilfield industry, guar gum is used as a deformer, surfactant, and synthetic polymer. It is suitable for all rheological requirements of water-based and brine-based drilling fluids. It enables fluid and water loss control and facilitates the lubrication and cooling of drill bits.
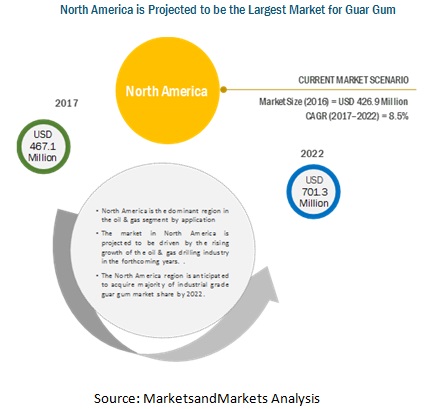
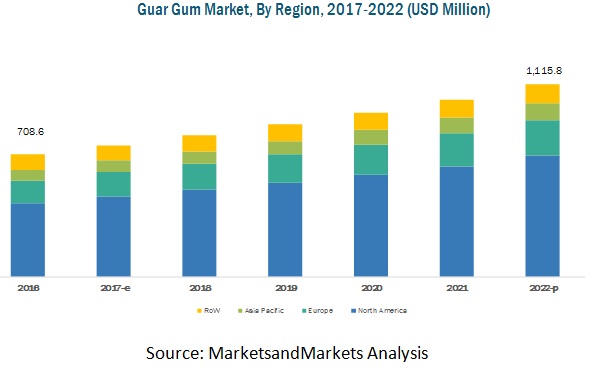
North America is projected to account for the largest market size during the forecast period.
North America is projected to hold the largest share in the guar gum market during the forecast period. The oil & gas industry is booming in the North America region; this region dominates the global market, followed by Europe and Asia-Pacific. The demand for natural additives and processed food among consumers is fueling the growth of the food-grade guar gum market, while the demand from the oil & gas drilling industry for hydraulic fracturing is driving the industrial-grade guar gum market. A large volume of guar gum imported by the US and Canada for the oil & gas industry is the main reason contributing to the dominance of North America in the global market. A few leading manufacturers occupying a significant share in the market across North America include Ingredion, Incorporated (US), which acquired global guar gum leaders, TIC Gums, Inc. (US) & Penford Corporation (US), Ashland Specialty Ingredients (US), and Cargill (US).
Market Dynamics for Guar Gum Market
Increasing application of guar gum due to its multi-functional properties is driving growth.
Growing awareness among consumers about health & nutrition has resulted in an increased interest in natural and organic products such as guar gum. Guar gum, as a natural ingredient, has several health benefits, such as reducing serum low-density lipoprotein (LDL) cholesterol and triglycerides and increasing glucose tolerance. This has driven food manufacturers to use natural gums in various food applications. In the food industry, guar gum is used as a thickener, stabilizer, emulsifier, binding agent, coating agent, texturing agent, and gelling agent for frozen food products, baked food products, dairy products, sauces & salad preparations, confections, beverages, and pet food. Apart from the food industry, properties of guar gum such as binding, fracturing, waterproofing, and gelling make it an ideal additive for different industries such as oil & gas, mining, explosives, textiles, pharmaceuticals, textile, and water treatment.
Lack of R&D in some countries is restraining the growth of the market.
Although Asia holds the largest share in the production of guar and its derivative products, there is a lack of general R&D facilities focused on the guar industry in countries such as India and Pakistan. These countries do not have reputed R&D associations focusing on guar seed production, development of industry-specific products, manufacturing & processing technology, or plant & machinery along with no proper distribution infrastructure. Although some institutions in the country are focusing on the development of certified seeds, agricultural universities and existing research institutions do not have the required resources and are facing a monetary crunch for researching the development of new varieties, optimizing product processing, and technology development. Even the farmers willing to use certified seeds are unable to purchase it at an affordable price. Along with these factors, human resources engaged in the guar industry would need to be trained to develop skilled manpower within the industry. Indian manufacturers need to divert a part of the revenue from export taxes to create national level R&D institutes for the purpose.
Increased consumption of convenience food will provide a good growth opportunity in the future.
The global demand for convenience food is increasing with busy consumer lifestyles. The global demand for convenience food has been influenced by factors such as increased usage of household technologies, longer working hours, and rising consumer incomes. Guar gum is one of the essential food additives in convenience food products, such as soups, cakes, pastry, bread, gravies, and snacks, which improves its quality. An increase in consumer interest in processed food products is expected to further augment the growth of the guar gum market shortly. Moreover, the increasing preference for low-calorie and low-fat foods favoring guar gum has helped reduce the overall fat content in foods; this trend is benefiting the guar gum market. Guar gum is used as a fat replacer in convenience food. The consumer demand for convenience food products that will fit their lifestyles has been rising, globally. Manufacturers continue to focus on convenience food & beverages as the major potential segment for guar gum application.
The development of guar gum substitutes is providing a major challenge to the guar gum market.
Guar finds a wide range of applications covering the food and oil & gas industries. However, factors such as volatility in guar prices and availability will lead the guar industry to face challenges from cheaper substitutes coming up in various sectors, especially the shale gas & oil sector. Some of the major substitutes or alternatives to guar gum are locust bean gum, xanthan gum, carboxymethylcellulose & carboxymethyl-hydroxyethyl cellulose-based gum, starch, clear star, permstim, cassia Tora, and synthetic polymers. Tamarind kernel powder has significantly replaced guar gum in the textile sector, while cassia Tora is replacing guar gum in textiles and pet food. The end-user industries of guar gum that witness stable demand due to the increasing preference for natural products are only food and pharmaceuticals. Trican Well Service Ltd. (Canada), Baker Hughes (U.S.), Nabors Industries Ltd. (Bermuda), and Halliburton Company (U.S.) are some of the oilfield service companies that are reported to have begun in-house on substitutes for guar gum. The uncertainty in supply and price fluctuations beyond a certain range is a major factor posing a high threat of substitution.
Scope of the Report
|
Report Metric |
Details |
|
Market size available for years |
2015–2022 |
|
Base year considered |
2016 |
|
Forecast period |
2017–2022 |
|
Forecast units |
Value (USD Million) and Volume (KT) |
|
Segments covered |
Grade, Function, Application, Food & Beverage Application, and Region |
|
Geographies covered |
North America, Europe, Asia Pacific, ROW |
|
Companies covered |
E. I. du Pont de Nemours and Company (US), Cargill (US), Shree Ram Industries (India), Ingredion Incorporated (US), Ashland Inc. (US), Vikas WSP Limited (India), Hindustan Gums and Chemical Limited (India), Dabur India Ltd. (India), India Glycols Ltd. (India), Neelkanth Polymers (India), Lucid Group (India), Global Gums and Chemicals Pvt Limited (Pakistan), Guangrao Liuhe Chemical Co., Ltd. (China), Jai Bharat Gums and Chemicals Ltd (India), Altrafine Gums (India), Supreme Gums Private Limited (India), Ruchi Soya Industries Limited (India), and Rama Industries (India). |
On the basis of grade, the guar gum market has been segmented as follows:
- Food-grade
- Industrial-grade
- Pharmaceutical-grade
On the basis of function, the guar gum market has been segmented as follows:
- Thickening
- Gelling
- Binding
- Friction reducing
- Other functions (coagulating, flocculating & settling agent, hardening, and strengthening)
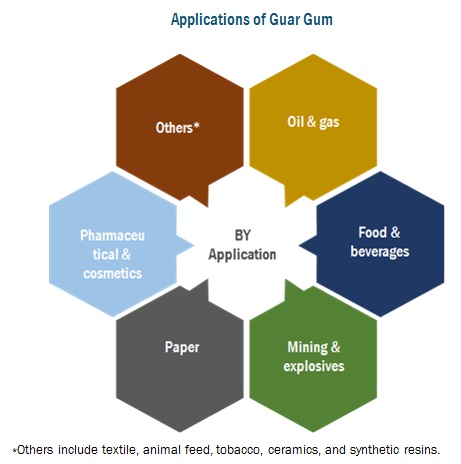
On the basis of application, the guar gum market has been segmented as follows:
- Oil & gas
- Food & beverages
- Mining & explosives
- Paper manufacturing
- Pharmaceuticals and cosmetics
- Others (textile, animal feed, tobacco, ceramic, and synthetic resins)
On the basis of food & beverage applications, the guar gum market has been segmented as follows:
- Bakery & confectionery products
- Dairy & frozen products
- Beverages
- Sauces & dressings
- Others (meat & poultry products, snacks, noodles, soups, and pasta)
On the basis of region, the guar gum market has been segmented as follows:
- North America
- Europe
- Asia Pacific
- RoW (The Middle East and South America)
Recent Developments
Key Questions addressed by the report:
- Which are the key players in the market and how intense is the competition?
- What are the upcoming growth trends which the guar gum manufacturers are focusing on in the future?
- What are the high growth opportunities in the guar gum market in each segment?
- What are the key growth strategies adopted by major market players in the guar gum market?
To speak to our analyst for a discussion on the above findings, click Speak to Analyst
 Exclusive indicates content/data unique to MarketsandMarkets and not available with any competitors.
Table of Contents
1 Introduction (Page No. - 15)
1.1 Objectives of the Study
1.2 Market Definition
1.3 Study Scope
1.4 Periodization Considered
1.5 Currency Considered
1.6 Unit Considered
1.7 Stakeholders
2 Research Methodology (Page No. - 19)
2.1 Research Data
2.1.1 Secondary Data
2.1.1.1 Key Data From Secondary Sources
2.1.2 Primary Data
2.1.2.1 Key Data From Primary Sources
2.1.2.2 Key Industry Insights
2.1.2.3 Breakdown of Primaries
2.2 Macroindicators
2.2.1 Introduction
2.2.1.1 Increasing Natural Gas Consumption
2.2.1.2 Increasing Demand for Processed Food Products
2.2.1.3 Growth in Livestock Population
2.2.1.4 Changing Climatic Conditions
2.3 Market Size Estimation
2.4 Market Breakdown & Data Triangulation
2.5 Assumptions and Limitations
2.5.1 Assumptions
2.5.2 Limitations
3 Executive Summary (Page No. - 31)
4 Premium Insights (Page No. - 37)
4.1 Attractive Opportunities in this Market
4.2 Guar Gum Market, By Grade
4.3 North America Held the Largest Share in this Market
4.4 Guar Gum Market, By Function
4.5 Market, By Food & Beverages Application
4.6 Market: By Region
4.7 Product Life Cycle, By Region
5 Market Overview (Page No. - 44)
5.1 Introduction
5.2 Evolution of Guar Gum
5.3 Market Dynamics
5.3.1 Drivers
5.3.1.1 Growing Demand for Guar Gum in the Oil & Gas Industry
5.3.1.2 Increasing Applications of Guar Gum Owing to Its Multifunctional Properties
5.3.2 Restraints
5.3.2.1 Lack of R&D Activities in Some Countries
5.3.2.2 Trade Barriers
5.3.2.3 Fluctuating Prices of Guar and Its Products
5.3.2.3.1 Dependence On Climatic Conditions
5.3.2.3.2 High Dependency On Crude Oil Prices
5.3.3 Opportunities
5.3.3.1 Increased Consumption of Convenience Food
5.3.3.2 Emerging Markets That Have Immense Potential
5.3.4 Challenges
5.3.4.1 Development of Guar Gum Substitutes
5.3.4.2 Export-Oriented Commodity and Unavailability of Stocks
6 Market For Guar Gum, By Grade (Page No. - 52)
6.1 Introduction
6.2 Food-Grade
6.3 Industrial-Grade
6.4 Pharmaceutical-Grade
7 Market For Guar Gum, By Function (Page No. - 60)
7.1 Introduction
7.2 Thickening
7.3 Gelling
7.4 Binding
7.5 Friction Reducing
7.6 Other Functions
8 Market For Guar Gum, By Application (Page No. - 68)
8.1 Introduction
8.2 Oil & Gas
8.3 Food & Beverages
8.4 Mining & Explosives
8.5 Paper Manufacturing
8.6 Pharmaceuticals & Cosmetics
8.7 Others
9 Market For Guar Gum, By Food & Beverage Application (Page No. - 79)
9.1 Introduction
9.2 Bakery & Confectionery Products
9.3 Dairy & Frozen Products
9.4 Beverages
9.5 Sauces & Dressings
9.6 Others
10 Market For Guar Gum, By Region (Page No. - 89)
10.1 Introduction
10.2 North America
10.2.1 U.S.
10.2.2 Canada
10.2.3 Mexico
10.3 Europe
10.3.1 Germany
10.3.2 Spain
10.3.3 Italy
10.3.4 France
10.3.5 U.K.
10.3.6 Rest of Europe
10.4 Asia-Pacific
10.4.1 China
10.4.2 India
10.4.3 Pakistan
10.4.4 Rest of Asia-Pacific
10.5 RoW
10.5.1 South America
10.5.2 Middle East
10.5.3 Others in RoW
11 Regulations Governing the Market For Guar Gum (Page No. - 119)
11.1 Overview
11.2 North America
11.2.1 U.S.
11.2.2 Canada
11.3 Europe
12 Competitive Landscape (Page No. - 121)
12.1 Introduction
12.2 Competitive Benchmarking
12.3 Company Ranking
*Top 15 Companies Analyzed for This Study are - Hindustan Gums & Chemicals Ltd. (India), Vikas WSP (India), India Glycols Ltd. (India), Rama Gum Industries (India), Dabur (India), Jai Bharat Gums & Chemicals Ltd. (India), Neelkanth Polymers (India), Guangrao Liuhe Chemicals Co. Ltd. (China), Lucid Group (India), Global Gums & Chemicals Pvt. Ltd. (Pakistan), Ashland Specialty Ingredients (U.S.), Ingredion Inc. (U.S.), Altrafine Gums (India), Ruchi Soya Industries Ltd. (India), Supreme Gums Pvt. Ltd. (India),
13 Company Profiles (Page No. - 124)
(Overview, Products and Services, Financials, Strategy & Development)*
13.1 Cargill
13.2 E.I. Dupont De Nemours and Company
13.3 Shree Ram Industries
13.4 Ingredion Incorporated
13.5 Ashland Inc.
13.6 Vikas WSP Ltd.
13.7 Hindustan Gums and Chemical Limited
13.8 Dabur India Ltd
13.9 India Glycols Ltd
13.10 Neelkanth Polymers
13.11 Lucid Group
13.12 Global Gums and Chemicals Pvt Ltd
13.13 Guangrao Liuhe Chemical Co., Ltd.
13.14 Jai Bharat Gums and Chemicals Ltd
13.15 Altrafine Gums
13.16 Supreme Gums Private Limited
13.17 Ruchi Soya Industries Limited
13.18 Rama Gum Industries
*Details On Overview, Products and Services, Financials, Strategy & Development Might Not Be Captured in Case of Unlisted Companies.
14 Appendix (Page No. - 155)
14.1 Discussion Guide
14.2 Knowledge Store: Marketsandmarkets’ Subscription Portal
14.3 Introducing RT: Real-Time Market Intelligence
14.4 Available Customizations
14.5 Related Reports
14.6 Author Details
List of Tables (89 Tables)
Table 1 Guar Gum Market Size, By Grade, 2015–2022 (USD Million)
Table 2 Market Size, By Grade, 2015–2022 (KT)
Table 3 Food-Grade Guar Gum Market Size, By Region, 2015–2022 (USD Million)
Table 4 Food-Grade Guar Gum Market Size, By Region, 2015–2022 (KT)
Table 5 Industrial-Grade Guar Gum Market Size, By Region, 2015–2022 (USD Million)
Table 6 Industrial-Grade Guar Gum Market Size, By Region, 2015–2022 (KT)
Table 7 Pharmaceutical-Grade Guar Gum Market Size, By Region, 2015–2022 (USD Million)
Table 8 Pharmaceutical-Grade Guar Gum Market Size, By Region, 2015–2022 (KT)
Table 9 Market Size For Guar Gum, By Function, 2015-2022 (USD Million)
Table 10 Market Size, By Function, 2015-2022 (KT)
Table 11 Thickening: Market Size For Guar Gum, By Region, 2015-2022 (USD Million)
Table 12 Thickening: Market Size, By Region, 2015-2022 (KT)
Table 13 Gelling: Market Size For Guar Gum, By Region, 2015-2022 (USD Million)
Table 14 Gelling: Market Size, By Region, 2015-2022 (KT)
Table 15 Binding: Market Size For Guar Gum, By Region, 2015-2022 (USD Million)
Table 16 Binding: Market Size, By Region, 2015-2022 (KT)
Table 17 Friction Reducing: Market Size For Guar Gum, By Region, 2015-2022 (USD Million)
Table 18 Friction Reducing: Market Size, By Region, 2015-2022 (KT)
Table 19 Other Functions: Market Size For Guar Gum, By Region, 2015-2022 (USD Million)
Table 20 Other Functions: Market Size, By Region, 2015-2022 (KT)
Table 21 Market Size For Guar Gum, By Application, 2015–2022 (USD Million)
Table 22 Market Size, By Application, 2015–2022 (KT)
Table 23 Guar Gum Market Size for Oil & Gas, By Region, 2015–2022 (USD Million)
Table 24 Market Size for Oil & Gas, By Region, 2015–2022 (KT)
Table 25 By Market Size for Food & Beverages, By Region, 2015–2022 (USD Million)
Table 26 Market Size for Food & Beverages, By Region, 2015–2022 (KT)
Table 27 Guar Gum Market Size for Mining & Explosives, By Region, 2015–2022 (USD Million)
Table 28 Market Size for Mining & Explosives, By Region, 2015–2022 (KT)
Table 29 By Market Size for Paper Manufacturing, By Region, 2015–2022 (USD Million)
Table 30 Market Size for Paper Manufacturing, By Region, 2015–2022 (KT)
Table 31 Market Size for Pharmaceuticals & Cosmetics, By Region, 2015–2022 (USD Million)
Table 32 Market Size for Pharmaceuticals & Cosmetics, By Region, 2015–2022 (KT)
Table 33 By Market Size for Other Applications, By Region, 2015–2022 (USD Million)
Table 34 Market Size for Other Applications, By Region, 2015–2022 (KT)
Table 35 Market Size For Guar Gum, By Food & Beverage Application, 2015–2022 (USD Million)
Table 36 Market Size, By Food & Beverage Application, 2015–2022 (KT)
Table 37 Market Size in Bakery & Confectionery Products, By Region, 2015–2022 (USD Million)
Table 38 Market Size in Bakery & Confectionery Products, By Region, 2015–2022 (KT)
Table 39 By Market Size in Dairy & Frozen Food, By Region, 2015–2022 (USD Million)
Table 40 Market Size in Dairy & Frozen Food, By Region, 2015–2022 (KT)
Table 41 Market Size in Beverages, By Region, 2015–2022 (USD Million)
Table 42 Market Size in Beverages, By Region, 2015–2022 (KT)
Table 43 By Market Size in Sauces & Dressings, By Region, 2015–2022 (USD Million)
Table 44 Market Size in Sauces & Dressings, By Region, 2015–2022 (KT)
Table 45 Guar Gum Market Size in Other Food & Beverage Applications, By Region, 2015–2022 (USD Million)
Table 46 Market Size in Other Food & Beverage Applications, By Region, 2015–2022 (KT)
Table 47 Market Size For Guar Gum, By Region, 2015–2022 (USD Million)
Table 48 Market Size, By Region, 2015–2022 (KT)
Table 49 North America: Market Size For Guar Gum, By Country, 2015–2022 (USD Million)
Table 50 North America: Market Size, By Country, 2015–2022 (KT)
Table 51 North America: Market Size, By Grade, 2015–2022 (USD Million)
Table 52 North America: Market Size, By Grade, 2015–2022 (KT)
Table 53 North America: Market Size, By Application, 2015–2022 (USD Million)
Table 54 North America: Market Size, By Application, 2015–2022 (KT)
Table 55 North America: Market Size, By Food & Beverage Application, 2015–2022 (USD Million)
Table 56 North America: Market Size, By Food & Beverage Application, 2015–2022 (KT)
Table 57 North America: Market Size For Guar Gum, By Function, 2015–2022 (USD Million)
Table 58 North America: Market Size, By Function, 2015–2022 (KT)
Table 59 Europe: Guar Gum Market Size, By Application, 2015-2022 (USD Million)
Table 60 Europe: Market Size, By Application, 2015-2022 (KT)
Table 61 Europe: Market Size For Guar Gum, By Food & Beverage Application, 2015-2022 (USD Million)
Table 62 Europe: Market Size, By Food & Beverage Application, 2015-2022 (KT)
Table 63 Europe: Market Size For Guar Gum, By Grade, 2015-2022 (USD Million)
Table 64 Europe: Market Size, By Grade, 2015-2022 (KT)
Table 65 Europe: Market Size For Guar Gum, By Function, 2015-2022 (USD Million)
Table 66 Europe: Market Size, By Function, 2015-2022 (KT)
Table 67 Europe: Market Size For Guar Gum, By Country, 2015-2022 (USD Million)
Table 68 Europe: Guar Gum Market Size, By Country, 2015-2022 (KT)
Table 69 Asia-Pacific: Market Size, By Application, 2015–2022 (USD Million)
Table 70 Asia-Pacific: Market Size, By Application, 2015–2022 (KT)
Table 71 Asia-Pacific: Market Size For Guar Gum, By Food & Beverage Application, 2015–2022 (USD Million)
Table 72 Asia-Pacific: Market Size, By Food & Beverage Application, 2015–2022 (KT)
Table 73 Asia-Pacific: Market Size, By Grade, 2015–2022 (USD Million)
Table 74 Asia-Pacific: Market Size, By Grade, 2015–2022 (KT)
Table 75 Asia-Pacific: Market Size For Guar Gum, By Function, 2015–2022 (USD Million)
Table 76 Asia-Pacific: Market Size, By Function, 2015–2022 (KT)
Table 77 Asia-Pacific: Market Size For Guar Gum, By Country, 2015–2022 (USD Million)
Table 78 Asia-Pacific: Market Size, By Country, 2015–2022 (KT)
Table 79 RoW: Market Size For Guar Gum, By Application, 2015-2022 (USD Million)
Table 80 RoW: Market Size, By Application, 2015-2022 (KT)
Table 81 RoW: Market Size For Guar Gum, By Food & Beverage Application, 2015-2022 (USD Million)
Table 82 RoW: Market Size, By Food & Beverage Application, 2015-2022 (KT)
Table 83 RoW: Market Size, By Grade, 2015-2022 (USD Million)
Table 84 RoW: Market Size, By Grade, 2015-2022 (KT)
Table 85 RoW: Market Size For Guar Gum, By Function, 2015-2022 (USD Million)
Table 86 RoW: Market Size, By Function, 2015-2022 (KT)
Table 87 RoW: Market Size For Guar Gum, By Region, 2015-2022 (USD Million)
Table 88 RoW: Guar Gum Market Size, By Region, 2015-2022 (KT)
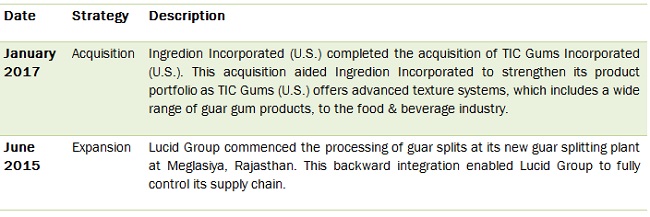
Table 89 Recent Developments
List of Figures (38 Figures)
Figure 1 Market Segmentation
Figure 2 Guar Gum Market: Research Design
Figure 3 Breakdown of Primary Interviews: By Company Type, Designation, and Region
Figure 4 Increasing Natural Gas Consumption, 2012-2040 (Trillion Cubic Feet)
Figure 5 RTE and Snacks & Savory Products Segments Held ~35% in the Food Sector in 2013
Figure 6 Livestock Population Count, 2010 Vs. 2014 (Million)
Figure 7 Interdependence of Guar Production and Rainfall in Haryana, 2009–2011
Figure 8 Market Size Estimation: Bottom-Up Approach
Figure 9 Market Size Estimation Methodology: Top-Down Approach
Figure 10 Market Breakdown & Data Triangulation
Figure 11 Global Overview of Market For Guar Gum, 2015–2022
Figure 12 Global Overview of the Market For Guar Gum, By Grade, 2017–2022
Figure 13 Market Size For Guar Gum, By Application, 2017–2022 (USD Million)
Figure 14 Market Size, By Function, 2017–2022 (USD Million)
Figure 15 Market Size, By Region
Figure 16 Guar Gum Stands As an Emerging Market With Promising Growth Potential, 2017–2022 (USD Million)
Figure 17 Industrial-Grade Segment Projected to Grow at the Highest Rate From 2017 to 2022
Figure 18 Oil & Gas Application Held the Largest Share in the North American Region in 2016
Figure 19 Gelling Segment is Projected to Be the Largest Between 2017 and 2022
Figure 20 Bakery & Confectionery Products Dominated All Regions in 2016, in Terms of Value
Figure 21 North America is Projected to Be the Fastest Growing Region in the Market in 2016
Figure 22 The Guar Gum Market is at A Growing Stage
Figure 23 Evolution of Guar Gum
Figure 24 Guar Gum Market: Drivers, Restraints, Opportunities, and Challenges
Figure 25 Top Ten Countries With Technically Recoverable Wet Shale Gas Resources (Trillion Cubic Feet)
Figure 26 Guar Gum Consumption By the U.S. Oil & Gas Industry
Figure 27 Production of Guar is Directly Proportional to Rainfall, 2008–2011
Figure 28 Market Segmentation For Guar Gum, By Grade
Figure 29 Industrial-Grade Guar Gum Market Size, By Region, 2017 Vs. 2022 (USD Million)
Figure 30 Market For Guar Gum, By Application
Figure 31 Guar Gum Market Size for Oil & Gas, By Region, 2017 Vs. 2022 (USD Million)
Figure 32 Guar Gum Market Segmentation, By Food & Beverage Application
Figure 33 Bakery & Confectionery Products Market, By Region, 2017 Vs. 2022 (USD Million)
Figure 34 Dairy & Frozen Products Market, By Region, 2017 Vs. 2022 (USD Million)
Figure 35 Geographic Snapshot (2017–2022) – Rapid Growth Markets are Emerging As New Hotspots
Figure 36 North American Market Snapshot: Demand to Be Driven By Increase in the Consumption of Processed Foods
Figure 37 Europe: Guar Gum Market Snapshot
Figure 38 Cargill: Company Snapshot


Growth opportunities and latent adjacency in Guar Gum Market
What will be the future of this market because demand is shrinking during this pandemic period?