Food Stabilizers Market [Blends & Systems] by Source (Plant, Microbial, Seaweed, Synthetic, and Animal), Application (Dairy, Bakery, Confectionery, Beverages, Convenience Foods, Meat, and Sauces & Dressings), Function, and Region - Global Forecasts to 2023


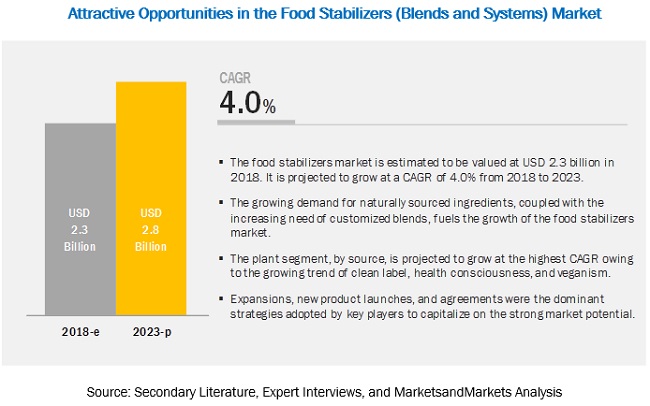
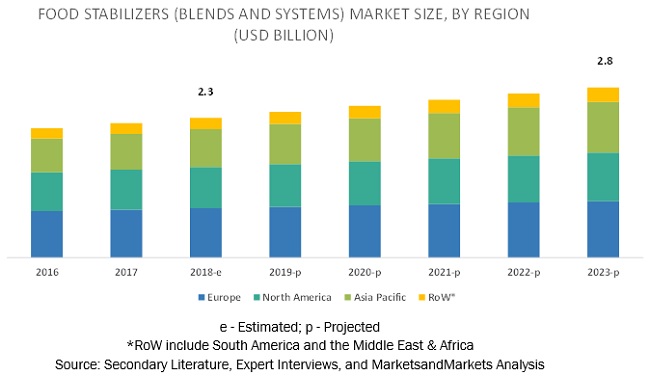
[212 Pages Report] The food stabilizers market (blends & systems) was valued at USD 2.3 billion in 2018, and projected to grow at a CAGR of 4.0%, to reach USD 2.8 billion by 2023. The growth of the food stabilizers market is driven by the rising demand for healthier and natural food ingredients from the food industry. The key drivers for the market’s growth are the increase in consumption of processed food, the multi-functionality of food stabilizers, and the growth in the use of natural ingredients in foods owing to the rise in consumer awareness about healthy diet. The growing demand for stabilizers as an ingredient in bakery products, beverages, and convenience food is expected to boost the market in developed countries of North America and Europe. International regulations and quality standards related to food additives are the restraining factors for food stabilizers market (blends & systems).
See how this study impacted revenues for other players in Food Stabilizers (Blends & Systems) Market
Client’s Problem Statement
Our client, a food flavors and fragrances manufacturer, wanted to expand its product portfolio and enter a new food stabilizers market. The client wanted to understand the regional and global trends for food stabilizers, as well as the competitive landscape of the market and the strategic initiatives taken by key players in the last few years. 
MnM Approach
MNM provided a thorough market analysis of food stabilizers and their sources, along with the market for potential application areas. The market performance at global, regional, and country levels was also provided, with a detailed analysis of industry trends pertaining to major competitors, their product portfolios, strategic initiatives, and business overviews.
Revenue Impact (RI)
The consumer trends, regulatory trends, and value chain analysis provided by MNM formed the basis of the strategic decision made by the client. MNM’s findings helped the client penetrate the European market by offering food stabilizers derived from plant-based sources. The client was also able to understand the degree of acceptance of stabilizer sources and the demand in Europe. This helped the client plan its investment strategy and production. Our findings allowed the client to penetrate new revenue pockets, projected at ~USD 20–30 million in five years.
“Plant-sourced stabilizers to be the fastest growing source for food stabilizers.”
Based on source, the plant segment is projected to be the fastest-growing during the forecast period. This segment is rapidly growing majorly due to the rise in demand for natural ingredients and increase in trend for vegan food. Consumer’s perception towards the nutritional properties of plant-sourced food stabilizers has also been boosting the adoption rate of naturally sourced stabilizers. Food & beverage manufacturers prefer plant-sourced food stabilizer to fulfill the consumer's demand for natural food additives.
“The texturizing function segment is projected to be the fastest-growing in the food stabilizers (blends & systems) market during the forecast period”
Based on function, the texturizing segment is estimated to account for the largest share in the food stabilizers (blends & systems) market in 2018. In the food industry, the use of food stabilizers helps in improving the appearance of the product, which, in turn, encourages consumers to purchase the said products. Hence, the demand for stabilizers in the food industry is increasing.
“Dairy & dairy products is estimated to lead the market in 2018.”
On the basis of application, the food stabilizers (blends & systems) market was led by the dairy & dairy products segment. There has been an increasing application of food stabilizers in dairy products such as ice-cream and frozen dessert, and flavored milk. Stabilizers such as guar gum and carrageenans are the majorly used ingredients for dairy applications, and with the rising innovations in dairy product industry, the market for dairy & dairy products is estimated to dominate in 2018. In the food industry, the demand for dairy & dairy products is growing due to changing lifestyles and eating habits.
“High growth is expected in the Asia Pacific food stabilizers market.”
Asia Pacific is projected to be the fastest-growing market for the period considered for this study, due to the increase in disposable income and rise in demand for processed food, along with the growing industrial base, leading to increased demand for food stabilizers in the region. In addition, the market is driven by the growing demand for beverages in developing countries such as India, China, Japan, and Australia. The food processing industry is growing rapidly in these countries due to the increasing demand for convenience food in this region. Consumer food preferences are changing, awareness about food additives is increasing, and consumers are willing to spend more money on naturally sourced food products. All these factors are fueling the growth of food stabilizers (blends & systems) market in the Asia Pacific region.
Market Dynamics
“Multifunctionality of food stabilizers in various food & beverage products is driving market growth”
Food stabilizers are obtained from a wide range of natural raw materials including microorganisms, land and sea plants, and animal connective tissues. They control moisture and provide structure, flow, stability, and mouthfeel qualities in food products. Food & beverage manufacturers gain economic benefits by using food stabilizers blends and systems, which has increased demand for them. For instance, xanthan is extensively used in bakery products to help retention of water in baking food and therefore increases the shelf life of the food.
“Stringent international quality standards and regulations acts as a restraint.”
International bodies such as the National Food Safety and Quality Service (SENASA), Canadian Food Inspection Agency (CFIA), U.S. Food and Drug Administration (FDA), World Health Organization (WHO), and Committee on the Environment, Public Health and Food Safety (EU) are associated with food safety regulations. These organizations have control over the usage of different chemicals and materials used in food processing, directly or indirectly.
With stringent international regulations, regulatory approval of a food ingredient is critical. Without approval of the appropriate government bodies, the additive has no market or function in food. Obtaining regulatory approval for a new ingredient is becoming increasingly expensive and a time-consuming process.
Demand for food stabilizers from food & beverage industries for innovative application is a major area of opportunity.”
The market demand for food products is driven by the increasing population and economic development. The ever-growing global population imposes pressure on availability of scarce resources. High energy prices and rising raw material costs impact food prices, thus affecting low-income consumers. The growing market for food products such as bakery, meat products, beverages, convenience food, and beverages is expected to offer potential growth opportunities for the stabilizer blends and systems market. Consumers in developing economies are characterized by changing lifestyles and higher disposable income, which drives the market for processed food products. Food additives and ingredients are essential for manufacturing of processed products, which drives the food additives and food ingredients markets.
Rise in raw material prices increases production cost of food stabilizer manufacturers thereby posing a major challenge.”
The prices of raw materials for hydrocolloids that are raw materials for blends and systems have been fluctuating, resulting in uncertainty in the market. Seaweed is the natural raw source for hydrocolloids, which are used in food & beverages for varied applications such as thickening, stabilizing, gelling, and many more. The price of hydrocolloid raw materials affects the price of the hydrocolloids, which in turn, impacts the price of the end food product. Gum sources, including carrageenan, agar and alginates, are also obtained from seaweed. When choosing gum sources for such applications as tortillas and ice cream, formulators consider price as well as other factors. According to Hydrocolloid News, a newsletter published by IMR International, a hydrocolloid consulting company in San Diego; the market prices of raw seaweed sources will continue to grow in the coming years. This rise in prices of raw material will increase the product and operational costs of food stabilizer manufacturers. To deal with fluctuations in raw material prices, food stabilizer manufacturers are searching for seaweed alternatives.
Food Stabilizers Market Report Scope
|
Report Metric |
Details |
|
Market size available for years |
2016-2023 |
|
Base year considered |
2017 |
|
Forecast period |
2018-2023 |
|
Units considered |
Value (USD) & Volume (KT) |
|
Segments covered |
Function, Source, Application, and Region |
|
Geographies covered |
North America, Asia Pacific, Europe, and RoW (South America and the Middle East & Africa) |
|
Companies covered |
Cargill (US), DowDuPont (US), Tate & Lyle (UK), Kerry (Ireland), CP Kelco (US), Palsgaard (Denmark), Ashland (US), ADM (US), BASF (Germany), Ingredion (US), Hydrosol (Germany), and Nexira (France) |
Recent Developments:
- In October 2018, CP Kelco launched new ingredient solution GENU Explorer Pectin ND-200; this solution is used in dairy products such as neutral pH dairy desserts.
- In September 2018, Kerry opened a new production plant in Moscow, Russia. This new facility would serve Kerry’s global and regional customer base in the Russian market; as well as in countries such as Belarus, Tajikistan, Kazakhstan, Uzbekistan, and Azerbaijan.
- In June 2018, Cargill signed an agreement to acquire Five Star Custom Foods, Ltd (US), a specialty food maker. The transaction is expected to be finalized this summer after a regulatory review.
Key Questions addressed by the report
- What are the new trends in the food stabilizers (blends & systems) market? Which companies are exploring these trends?
- Who are the key players in the market and how intense is the competition?
- What are the upcoming growth trends that the food stabilizer manufacturers are focusing in the future?
- What are the high-growth opportunities in the food stabilizers (blends & systems) market in each segment?
- What are the key growth strategies adopted by the major market players in the food stabilizers (blends & systems) market?
To speak to our analyst for a discussion on the above findings, click Speak to Analyst
 Exclusive indicates content/data unique to MarketsandMarkets and not available with any competitors.
Table of Contents
1 Introduction
1.1 Objectives of The Study
1.2 Market Definition
1.2.1 Food Stabilizers
1.2.2 Food Stabilizer Blends
1.2.3 Food Stabilizer Systems
1.3 Study Scope
1.3.1 Markets Covered
1.4 Periodization Considered
1.5 Currency Considered
1.6 Units
1.7 Stakeholders
2 Research Methodology
2.1 Research Data
2.1.1 Secondary Data
2.1.2 Primary Data
2.1.2.1 Breakdown of Primaries
2.2 Market Size Estimation
2.3 Data Triangulation
2.4 Research assumptions & Limitations
2.4.1 assumptions
2.4.2 Limitations
2.5 Factor analysis
2.5.1 Introduction
2.5.2 Demand-Side analysis
2.5.2.1 Increasing Per Capita Income and Shift towards Convenience Foods
2.5.2.2 Growing Consumer Consciousness towards Healthy Food Products
2.5.2.3 Rise inAlcoholic Beverage Consumption in APAC and North America
2.5.3 Supply-Side analysis
2.5.3.1 Research & Development for Better Customized Food Stabilizer Products
2.5.3.2 Changing Climatic Conditions to Impact The Use of Conventional Raw Materials
3 Executive Summary
4 Premium Insights
4.1 attractive Opportunities in The Food Stabilizers Market
4.2 Market for Food Stabilizers Share, By Function
4.3 asia Pacific: Market for Food Stabilizers, By Source & Country
4.4 Market for Food Stabilizers, By Source
4.5 Market for Food Stabilizers Market Share, By Key Country
5 Market Overview
5.1 Introduction
5.2 Market Dynamics
5.2.1 Drivers
5.2.1.1 Multifunctionality of Food Stabilizers in Various Food & Beverage Products
5.2.1.2 Increase inDemand for Customized Products
5.2.1.3 Growth inDemand for Naturally Sourced Ingredients
5.2.2 Restraints
5.2.2.1 Stringent International Quality Standards and Regulations
5.2.2.1.1 Legal Framework of Food & Beverage Additives in Singapore
5.2.3 Opportunities
5.2.3.1 Emerging Markets: New Growth Frontiers
5.2.3.2 Increase inInvestments for Research & Development to Develop New Products
5.2.4 Challenges
5.2.4.1 Fluctuation inPrices of Raw Materials
5.2.4.2 Consumer Demand for Clean Label Products and Perception of Food Labeling There of
6 Industry Trends
6.1 Introduction
6.1.1 Types of Food Ingredients
6.1.2 Stabilizer Blends for Food Applications
6.2 Value Chain analysis
6.3 Supply Chain
6.4 Pest analysis
6.4.1 Political/Legal Factors
6.4.1.1 Governmental Regulations
6.4.2 Economic Factors
6.4.2.1 Economic Changes inThe Global Market Directly Influence The Market
6.4.3 Social Factors
6.4.3.1 Consumer Demand for Clean Label and Natural Ingredients to Drive The Market
6.4.4 Technological Factors
6.4.4.1 Development of Innovative Stabilizing Blend and Systems for Product Efficiency
6.5 Porter’s Five forces analysis
6.5.1 Intensity of Competitive Rivalry
6.5.2 Bargaining Power of Suppliers
6.5.3 Bargaining Power of Buyers
6.5.4 Threat of Substitutes
6.5.5 Threat of New Entrants
7 Market for Food Stabilizers, By Source
7.1 Introduction
7.2 Plant
7.2.1 Plant-Based Food Stabilizers Are Widely Used in The Food & Beverage Industry Due to Its Nutritional Value and Wide Acceptance
7.3 Seaweed
7.3.1 Seaweed-Sourced Food Stabilizers Can Be Used as A Major Substitute to Plant-Based Or Synthetic-Based Food Stabilizers
7.4 Microbial
7.4.1 The Fluctuations inThe Prices of Plant and Seaweed Based Food Stabilizer Have Provided Growth Opportunities to The Microbial-Sourced Market for Food Stabilizers
7.5 animal
7.5.1 Europe is The Largest Market for animal Sourced Food Stabilizers
7.6 Synthetic
7.6.1 Synthetic Market for Food Stabilizers is Driven By Increasing Demand in APAC Region
8 Market for Food Stabilizers, By Function
8.1 Introduction
8.2 Texturizing
8.2.1 Texturizing Function Dominated The Market During The forecast Period
8.3 Stabilizing
8.3.1 Stabilizing is Key Function of Food Stabilizers and Used to Stabilize Emulsion in Food Products
8.4 Moisture Retention
8.4.1 Europe Region Dominated The Moisture Retention Segment of Market in 2017
8.5 Other Functions
8.5.1 The Other Functions of Food Stabilizers Include Mouthfeel, Egg Replacement, and Synthesis Control
9 Market for Food Stabilizers, By Application
9.1 Introduction
9.2 Dairy & Dairy Products
9.2.1 Dairy & Dairy Products Application Dominated The Market in 2017
9.3 Confectionery Products
9.3.1 Food Stabilizers Improve Nutritional Value, Consistency, Texture, Shape, Flavor, and Gelation of Confectionery Products
9.4 Convenience Foods
9.4.1 Europe Dominates The Connivance Foods Segment of Food Stabilizers Market
9.5 Bakery Products
9.5.1 Food Stabilizers Improve The Quality and Provide Desired Texture to The Bakery Products
9.6 Meat & Poultry Products
9.6.1 APAC Region to Drive Market for Food Stabilizers With Application in Meat & Poultry Products
9.7 Beverages
9.7.1 Increasing Demand for Sports Drinks and Energy Drinks has Increased in The Market, Which, in Turn, has Increased The Demand for Stabilizers Used inBeverages
9.8 Sauces & Dressings
9.8.1 Europe Dominates The Market With The Applications in Sauces & Dressings
9.9 Others
9.9.1 Stabilizers Help to Improve Nutritional Value of Products
10 Market for Food Stabilizers, By Region
10.1 Introduction
10.2 North America
10.2.1 US
10.2.1.1 The US Market Dominated The Global Food Stabilizers Markets in 2017
10.2.2 Canada
10.2.2.1 Increasing Wine Consumption to Drive The Market in Canada
10.2.3 Mexico
10.2.3.1 Increasing Commercialization of The Food Processing Industry is The Key Driver for The Market Growth in Mexico
10.3 Europe
10.3.1 France
10.3.1.1 France is The Largest Market for Food Stabilizers in Europe
10.3.2 Germany
10.3.2.1 Increasing Health Conscious, is Expected to Drive The Market for Food Stabilizers inThe Germany
10.3.3 Uk
10.3.3.1 Presence of Major Players of Food Stabilizers in The Country to Drive Market for Food Stabilizers in Uk
10.3.4 Spain
10.3.4.1 Increasing Demand for Convenience Food With Better Appearance and Taste to Drive Market for Food Stabilizers in Spain
10.3.5 Italy
10.3.5.1 Increasing Demand for Beverages to Drive Market for Food Stabilizers Growth in Italy
10.3.6 Russia
10.3.6.1 Changing Food Preferences to Drive Market for Food Stabilizers Growth in Russia
10.3.7 Netherlands
10.3.7.1 Increasing Disposable Income and Improved Standard of Living to Drive Food Market for Stabilizers Growth in Netherlands
10.3.8 Rest of Europe
10.4 asia Pacific
10.4.1 China
10.4.1.1 China is One of The Largest Markets for Food Stabilizers in APAC Region, With Significant Potential for Further Growth
10.4.2 Japan
10.4.2.1 The Japanese Market is Estimated to Be Positioned Second in The asia Pacific Market for Food Stabilizers
10.4.3 India
10.4.3.1 Convenience and Easy Availability, Coupled With Growing Disposable Incomes, Would Lead to an Increase in Buying Capability of Premium Ready to Eat Products to Drive The Market in India
10.4.4 Australia
10.4.4.1 The Growing Consumption of Food & Beverage Products has Resulted in an Increase in The Consumption of Raw Materials and Other Food Ingredients, to Drive The Australian Food Stabilizers Market
10.4.5 Rest of asia Pacific
10.5 Rest of The World (Row)
10.5.1 South America
10.5.1.1 Increasing Demand for Clean Label Food Additives is Expected to Drive The Market in South America
10.5.2 Middle East & Africa
10.5.2.1 Rising Population and Rapid Urbanization is Fueling The Demand for Processed Food Which is Key Driver for Market for Food Stabilizers Growth in The Middle East
11 Competitive Landscape
11.1 Overview
11.2 Expansions & Investments
11.3 Mergers and Acquisitions
11.4 New Product Launches
11.5 Agreements & Joint Ventures
12 Company Profiles
(Business Overview, Products of fered, Recent Developments, SWOT analysis, MnM View)*
12.1 DowDuPont
12.1.1 Business Overview
12.1.2 Products of fered
12.1.3 Recent Developments
12.1.4 SWOT analysis
12.1.5 MnM View
12.2 Cargill
12.2.1 Business Overview
12.2.2 Products of fered
12.2.3 Recent Developments
12.2.4 SWOT analysis
12.2.5 MnM View
12.3 Tate & Lyle
12.3.1 Business Overview
12.3.2 Products of fered
12.3.3 Recent Developments
12.3.4 SWOT analysis
12.3.5 MnM View
12.4 Palsgaard
12.4.1 Business Overview
12.4.2 Products of fered
12.4.3 Recent Developments
12.4.4 SWOT analysis
12.4.5 MnM View
12.5 ADM
12.5.1 Business Overview
12.5.2 Products of fered
12.5.3 Recent Developments
12.5.4 SWOT analysis
12.5.5 MnM View
12.6 Ashland
12.6.1 Business Overview
12.6.2 Products of fered
12.6.3 Recent Developments
12.6.4 SWOT analysis
12.6.5 MnM View
12.7 CP Kelco
12.7.1 Business Overview
12.7.2 Products of fered
12.7.3 Recent Developments
12.8 Kerry
12.8.1 Business Overview
12.8.2 Products of fered
12.8.3 Recent Developments
12.9 Ingredion
12.9.1 Business Overview
12.9.2 Products of fered
12.9.3 Recent Developments
12.10 Nexira
12.10.1 Business Overview
12.10.2 Products of fered
12.10.3 Recent Developments
12.11 Hydrosol Gmbh & Co. Kg
12.11.1 Business Overview
12.11.2 Products of fered
12.11.3 Recent Developments
12.12 BASF
12.12.1 Business Overview
12.12.2 Products of fered
*Details on Business Overview, Products of fered, Recent Developments, SWOT analysis, MnM View Might Not Be Captured in Case of Unlisted Companies.
13 Appendix (Page No. - 204)
13.1 Discussion Guide
13.2 Knowledge Store: Marketsandmarkets’ Subscription Portal
13.3 Available Customizations
13.4 Related Reports
13.5 Author Details
List of Tables (119 Tables)
Table 1 USD Exchange Rates Considered, 2013–2017
Table 2 Food Stabilizers and Their Natural Sources
Table 3 Snapshot: Summary/Definition of Food Additives in Singapore
Table 4 Common Types of Food Ingredients and Their Applications
Table 5 Maximum Level of Different Stabilizers for Various Food Applications
Table 6 Composition of Various Stabilizer Blends in Ice Creams
Table 7 top Five Gdp Per Capita (Ppp) for Emerging Economies in asia Pacific, 2017
Table 8 Food Stabilizers Market Size, By Source, 2016–2023 (USD Million)
Table 9 Market for Food Stabilizers Size, By Source, 2016–2023 (Kt)
Table 10 Plant Gums: Sources & Food Applications
Table 11 Plant-Sourced FS Market Size, By Region, 2016–2023 (USD Million)
Table 12 Plant-Sourced FS Market Size, By Region, 2016–2023 (Kt)
Table 13 Seaweed E-Numbers and Their Uses
Table 14 Seaweed-Sourced Food Stabilizers Market Size, By Region, 2016–2023 (USD Million)
Table 15 Seaweed-Sourced FS Market Size, By Region, 2016–2023 (Kt)
Table 16 Microbial-Sourced FS Market Size, By Region, 2016–2023 (USD Million)
Table 17 Microbial-Sourced FS Market Size, By Region, 2016–2023 (Kt)
Table 18 animal-Sourced FS Market Size, By Region, 2016–2023 (USD Million)
Table 19 animal-Sourced FS Market Size, By Region, 2016–2023 (Kt)
Table 20 Synthetic FS Market Size, By Region, 2016–2023 (USD Million)
Table 21 Synthetic FS Market Size, By Source, 2016–2023 (Kt)
Table 22 Market for Food Stabilizers Size, By Function, 2016–2023 (USD Million)
Table 23 Texturizing: Market for Food Stabilizers Size, By Region, 2016–2023 (USD Million)
Table 24 Stabilizing: FS Market Size, By Region, 2016–2023 (USD Million)
Table 25 Moisture Retention: FS Market Size, By Region, 2016–2023 (USD Million)
Table 26 Other Functions: FS Market Size, By Region, 2016–2023 (USD Million)
Table 27 Application of Food Stabilizers
Table 28 Food Stabilizers Market Size, By Application, 2016-2023 (USD Million)
Table 29 Market for Food Stabilizers Size, By Application, 2016-2023 (Kt)
Table 30 Food Stabilizers for Dairy & Dairy Products Market Size, By Region, 2016-2023 (USD Million)
Table 31 Food Stabilizers for Dairy & Dairy Products Market Size, By Region, 2016-2023 (Kt)
Table 32 Stabilizers Used in Areated Confections
Table 33 Food Stabilizers for Confectionery Products Market Size, By Region, 2016-2023 (USD Million)
Table 34 Food Stabilizers for Confectionery Products Market Size, By Region, 2016-2023 (Kt)
Table 35 Food Stabilizers for Convenience Foods Market Size, By Region, 2016-2023 (USD Million)
Table 36 Food Stabilizers for Convenience Foods Market Size, By Region, 2016-2023 (Kt)
Table 37 Food Stabilizers for Bakery Products Market Size, By Region, 2016-2023 (USD Million)
Table 38 Food Stabilizers for Bakery Products Market Size, By Region, 2016-2023 (Kt)
Table 39 Food Stabilizers for Meat & Poultry Products Market Size, By Region, 2016-2023 (USD Million)
Table 40 Food Stabilizers for Meat & Poultry Products Market Size, By Region, 2016-2023 (Kt)
Table 41 Food Stabilizers for Beverages Market Size, By Region, 2016-2023 (USD Million)
Table 42 Food Stabilizers for Beverages Market Size, By Region, 2016-2023 (Kt)
Table 43 Hydrocolloids in Salad Dressings: Typical Dressing formulae
Table 44 Food Stabilizers for Sauces & Dressings Market Size, By Region, 2016-2023 (USD Million)
Table 45 Food Stabilizers for Sauces & Dressings Market Size, By Region, 2016-2023 (Kt)
Table 46 Food Stabilizers for Others Market Size, By Region, 2016-2023 (USD Million)
Table 47 Food Stabilizers for Others Market Size, By Region, 2016-2023 (Kt)
Table 48 Market for Food Stabilizers Size, By Region, 2016–2023 (USD Million)
Table 49 Market for Food Stabilizers Size, By Region, 2016–2023 (Kt)
Table 50 North America: Food Stabilizers Market Size, By Country, 2016–2023 (USD Million)
Table 51 North America: By Market Size, By Country, 2016–2023 (Kt)
Table 52 North America: By Market Size, By Source, 2016–2023 (USD Million)
Table 53 North America: By Market Size, By Source, 2016–2023 (Kt)
Table 54 North America: By Market Size, By Function, 2016–2023 (USD Million)
Table 55 North America: By Market Size, By Application, 2016–2023 (USD Million)
Table 56 North America: By Market Size, By Application, 2016–2023 (Kt)
Table 57 US: By Market Size, By Application, 2016–2023 (USD Million)
Table 58 US: By Market Size, By Application, 2016–2023 (Kt)
Table 59 Canada: By Market Size, By Application, 2016–2023 (USD Million)
Table 60 Canada: By Market Size, By Applications, 2016–2023 (Kt)
Table 61 Mexico: By Market Size, By Application, 2016–2023 (USD Million)
Table 62 Mexico: By Market Size, By Application, 2016–2023 (Kt)
Table 63 Major European Producers of Seaweed Extracts
Table 64 Europe: By Market Size, By Country, 2016–2023 (USD Million)
Table 65 Europe: By Market Size, By Country, 2016–2023 (Kt)
Table 66 Europe: By Market Size, By Application, 2016–2023 (USD Million)
Table 67 Europe: By Market Size, By Application, 2016–2023 (Kt)
Table 68 Europe: By Market Size, By Function, 2016–2023 (USD Million)
Table 69 Europe: By Market Size, By Source, 2016–2023 (USD Million)
Table 70 Europe: By Market Size, By Source, 2016–2023 (Kt)
Table 71 France: By Market Size, By Application, 2016–2023 (USD Million)
Table 72 France: By Market Size, By Application, 2016–2023 (Kt)
Table 73 Germany: By Market Size, By Application, 2016–2023 (USD Million)
Table 74 Germany: By Market Size, By Application, 2016–2023 (Kt)
Table 75 UK: By Market Size, By Application, 2016–2023 (USD Million)
Table 76 UK: By Market Size, By Application, 2016–2023 (Kt)
Table 77 Spain: By Market Size, By Application, 2016–2023 (USD Million)
Table 78 Spain: By Market Size, By Application, 2016–2023 (Kt)
Table 79 Italy: By Market Size, By Application, 2016–2023 (USD Million)
Table 80 Italy: By Market Size, By Application, 2016–2023 (Kt)
Table 81 Russia: By Market Size, By Application, 2016–2023 (USD Million)
Table 82 Russia: By Market Size, By Application, 2016–2023 (Kt)
Table 83 Netherlands: By Market Size, By Application, 2016–2023 (USD Million)
Table 84 Netherlands: By Market Size, By Application, 2016–2023 (Kt)
Table 85 Rest of Europe: Food Stabilizers Market Size, By Application, 2016–2023 (USD Million)
Table 86 Rest of Europe: By Market Size, By Application, 2016–2023 (Kt)
Table 87 Asia Pacific: By Market Size, By Country, 2016–2023 (USD Million)
Table 88 Asia Pacific: By Market Size, By Country, 2016–2023 (Kt)
Table 89 Asia Pacific: By Market Size, By Source, 2016–2023 (USD Million)
Table 90 Asia Pacific: By Market Size, By Source, 2016–2023 (Kt)
Table 91 Asia Pacific: By Market Size, By Function, 2016–2023 (USD Million)
Table 92 Asia Pacific: By Market Size, By Application, 2016–2023 (USD Million)
Table 93 Asia Pacific: By Market Size, By Application, 2016–2023 (Kt)
Table 94 China: By Market Size, By Application, 2016–2023 (USD Million)
Table 95 China: By Market Size, By Application, 2016–2023 (Kt)
Table 96 Japan: By Market Size, By Application, 2016–2023 (USD Million)
Table 97 Japan: By Market Size, By Application, 2016–2023 (Kt)
Table 98 India: By Market Size, By Application, 2016–2023 (USD Million)
Table 99 India: By Market Size, By Application, 2016–2023 (Kt)
Table 100 Australia: Food Stabilizers Market Size, By Application, 2016–2023 (USD Million)
Table 101 Australia: By Market Size, By Application, 2016–2023 (Kt)
Table 102 Rest of asia Pacific: By Market Size, By Application, 2016–2023 (USD Million)
Table 103 Rest of asia Pacific: By Market Size, By Application, 2016–2023 (Kt)
Table 104 RoW: Food Stabilizers Market Size, By Region, 2016–2023 (USD Million)
Table 105 RoW: By Market Size, By Region, 2016–2023 (Kt)
Table 106 RoW: By Market Size, By Source, 2016–2023 (USD Million)
Table 107 RoW: By Market Size, By Source, 2016–2023 (Kt)
Table 108 RoW: By Market Size, By Function, 2016–2023 (USD Million)
Table 109 RoW: By Market Size, By Application, 2016–2023 (USD Million)
Table 110 RoW: By Market Size, By Application, 2016–2023 (Kt)
Table 111 South America: Food Stabilizers Market Size, By Application, 2016–2023 (USD Million)
Table 112 South America: By Market Size, By Application, 2016–2023 (Kt)
Table 113 Middle East & Africa: By Market Size, By Application, 2016–2023 (USD Million)
Table 114 Middle East & Africa: By Market Size, By Application, 2016–2023 (Kt)
Table 115 Food Stabilizers Market Ranking, 2017
Table 116 Expansions & Investments, 2012–2018
Table 117 Mergers and Acquisitions, 2012–2018
Table 118 New Product Launches, 2012–2018
Table 119 Agreements & Joint Ventures, 2012–2018
List of Figures (47 Figures)
Figure 1 Food Stabilizers (Blends/Systems) Market Segmentation
Figure 2 Regional Segmentation
Figure 3 Food Stabilizers (Blends & Systems) Market: Research Design
Figure 4 Breakdown of Primary Interviews: By Company Type, Designation, and Region
Figure 5 Market Size Estimation: Bottom-Up Approach
Figure 6 Market Size Estimation Methodology: top-Down Approach
Figure 7 Data Triangulation
Figure 8 top 10 Economies Based on GDP (PPP), 2018 (USD Billion)
Figure 9 Global Middle-Class Consumption, By Region, 2015–2030 (Million)
Figure 10 Consumer Perception of Specific Nutrients’ Adequacy in Diets, 2013
Figure 11 Alcoholic Beverages Consumption Trend, 2013–2015 (Liter Per Capita)
Figure 12 Haryana: Interdependence of Guar Production and Rainfall, 2014 vs. 2015
Figure 13 Dairy & Dairy Products to Dominate The Market, By Application, 2018 vs. 2023 (USD Million)
Figure 14 Texturizing Segment to Dominate The Market, By Function, 2018 vs. 2023 (USD Million)
Figure 15 Plant Segment to Dominate The Market, By Source, 2018 vs. 2023 (USD Million)
Figure 16 Europe Was The Largest Market for Food Stabilizers in 2017
Figure 17 Growing Awareness of Natural Food Ingredients to Drive The Market Growth
Figure 18 Texturizing Segment Dominated The Market in 2017
Figure 19 China Dominated The Asia Pacific Market for Food Stabilizers in 2017
Figure 20 Plant-Sourced Food Stabilizers Dominated The Market in 2017
Figure 21 US and China Accounted for Major Shares of The Global Food Stabilizers Market in 2017
Figure 22 Market for Food Stabilizers: Drivers, Restraints, Opportunities, and Challenges
Figure 23 Product Claims Sought By Consumers, 2015 - Stabilizers to Be The Preferred Natural Ingredients
Figure 24 Fluctuating Prices of Guar Gum, 2013–2016 (USD/Metric ton)
Figure 25 Fluctuating Import and Export Prices of Agar-Agar, 2013–2017 (USD/ton)
Figure 26 Food Stabilizers: Development and Production Contributes Maximum Value
Figure 27 Food Stabilizers: Regulatory Bodies Maintains The Quality Standards in Supply Chain
Figure 28 Porter’s Five forces analysis
Figure 29 Plant Segment is Estimated to Dominate The Market, in Terms of Value, in 2017 vs 2023
Figure 30 Texturizing Segment is Estimated to Dominate The Market, in Terms of Value, in 2017 vs 2023
Figure 31 Dairy & Dairy Products Application to Lead The Market, 2017 vs. 2023 (USD Million)
Figure 32 Geographic Snapshot (2018–2023): China and India Are Emerging as New Hotspots, in Terms of Value
Figure 33 North America: Market for Food Stabilizers Snapshot
Figure 34 Europe: Market for Food Stabilizers Snapshot
Figure 35 Asia Pacific: Food Stabilizers Market
Figure 36 Expansions & Investments Have Fueled Growth & Innovation
Figure 37 Expansions & Investments, 2012–2018
Figure 38 annual Developments in The Market, 2012–2018
Figure 39 DowDuPont: Company Snapshot
Figure 40 Cargill: Company Snapshot
Figure 41 Tate & Lyle: Company Snapshot
Figure 42 Palsgaard: Company Snapshot
Figure 43 ADM: Company Snapshot
Figure 44 Ashland: Company Snapshot
Figure 45 Kerry: Company Snapshot
Figure 46 Ingredion: Company Snapshot
Figure 47 BASF: Company Snapshot


Growth opportunities and latent adjacency in Food Stabilizers Market
Do you have any information on customized blends for different applications such as dairy and beverages for the European region?