Gourmet Salts Market by Type (Fleur de Sel, Sel Gris, Himalayan Salt, Flake Salt, Specialty Salt), Application (Bakery & Confectionery, Meat & Poultry Products, Seafood Products, Sauces & Savory) & Geography - Global Trend & Forecast to 2019


Gourmet salts are unrefined, naturally-harvested salts (mostly sea salts) with comparatively lower sodium content, and without additives. Due to media exposure and increasing globalization, people are becoming more aware of various cuisines and are becoming more open to experimenting with food. By using gourmet salt, chefs are improvising on the recipes, enhancing the organoleptic qualities and hence, are increasing the appeal. The rising demand for traditional cuisines with enhanced flavor has increased the demand for gourmet salt from the food & beverage manufacturers and food service industry. The gourmet salts market, in terms of value, is projected to grow at a CAGR of 6.3% from 2014 to 2019 to touch $1,340.9 million by 2019.
The gourmet salts are available in wide range of types such as fleur de sel, sel gris, and flake salts. Different types of gourmet salt have respectively unique flavors due to their distinctive combination of minerals and the variations of shapes and sizes of salt crystals. They are used to enhance the appearance of food, impart rich texture, pleasant aroma and mouth feel. The gourmet salt are used in canning and pickling of food items to retain moisture content and preserve them for later use.
The market for gourmet salts was segmented on the basis of types, applications, and geography, in terms of both value ($million) and volume (tons). The gourmet salts market, by type, includes fleur de sel, sel gris, Himalayan salts, flake salts, specialty salts, and others. The applications of gourmet salt include bakery & confectionery, meat & poultry products, seafood products, and sauces & savory. The geographic segmentation includes market size, in terms of value and volume, for key countries in North America, Europe, Asia-Pacific, and Rest of the World (ROW).
The report provides a competitive analysis of developments recorded in the industry during the past five years. Market drivers, restraints, opportunities, and burning issues of the market are discussed in detail. The leading players in the market such as Morton Salt, Inc. (U.S.), Saltworks, Inc. (U.S.), Cargill, Inc. (U.S.), and Murray River Gourmet Salt (Australia) have been profiled in this report.
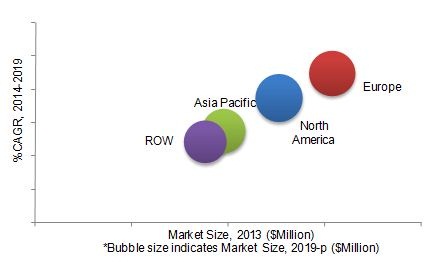
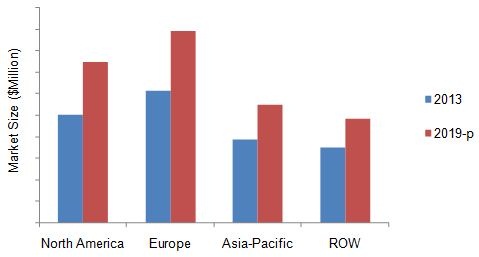
Gourmet Salts Market Size, by Geography, 2012 vs. 2019 ($Million)
P - Projected
Source: MarketsandMarkets Analysis
MnM helped a leading US based Salt supplier in identifying $0.3 billion of revenue opportunity (over a time of 5 years) through market penetration in the pink salt market across food and beverage, animal feed, spa and lamps markets in North America.
Client�s Problem Statement
Our client, a leading US based Salt supplier, was keen to increase its market penetration in Himalayan pink salt market for various end-use segments such as food and beverage, animal feed, spa and lamps markets. The senior management needed to take a host of crucial decisions � which country in North America to prioritise, which area to cluster his distributors, which application to focus, and what offering/ value proposition to build for target customers.
MnM Approach
MNM assisted the client with an outside-in perspective on the market potential of Himalayan pink salt in North America, by country and identification of potential customers. Further, we helped them identify the top application areas in target end-use segments and their locations across North America. MNM also helped them better understand the competitive landscape, varying business models & strategies of different players to win in these markets. This helped them in improving their product offering as well. Interviews with a host of potential customers were conducted in end-use segments to understand their unmet needs, pull for Himalayan pink salt especially in upcoming/ trending end-use segments. This helped our client refine their value proposition to quickly gain share.
Revenue Impact (RI)
Our findings helped the client to penetrate into a USD 1 billion market, with a revenue opportunity of USD 300 million in 5 years from this strategy. The client was able to establish and grow Himalayan pink salt business in the US and Canada.
In 2013, the gourmet salts market was dominated by Europe. North America is projected to grow at the highest rate during the projected period. The North American region is estimated to be the fastest growing market for gourmet salt during the review period. The growing demand for various gourmet salt in the U.S. drives the market in this region. The increasing awareness about the application of gourmet salt in various cuisines is also driving the market of gourmet salt, globally.
Scope of the Report
This report focuses on the market for the F&B industry and food service industry. The market was segmented on the basis of types, applications, and geography.
On the basis of types
- Fleur de sel
- Sel Gris or grey salts
- Himalayan salts
- Flake salts
- Specialty salts (flavored salts and smoked salts, among others)
- Others (Italian sea salts and Hawaiian sea salts, among others)
On the basis of application
- Bakery & confectionery
- Meat & poultry products
- Seafood products
- Sauces & savory
- Others (Desserts and frozen products, among others)
On the basis of geography
- North America
- Europe
- Asia-Pacific
- Rest of the World (ROW)
Customization Options:
Company-specific needs can be met by the customization option offered by the MnM assessment. The report can be customized to provide an in-depth analysis and exhaustive industry information for the following considerations:
Market Trend Analysis
- Exploration of new products and opportunities in the market
- Detailed analysis of addressable markets (bakery & confectionery, meat & poultry products, seafood products) that help to gauge target market segments
Competitive Intelligence
- Benchmarking of companies [Cargill, Inc., (U.S.), Cheetham Salt Ltd. (China), Morton Salt, Inc. (Germany), Saltworks, Inc. (U.S.)] based on revenues, products, and location
- Pricing strategy and profitability
- Market share analysis of leading player as per as product type
Gap Analysis
- Detailed analysis of distributors and customers perception to identify gaps
- Experts� opinion on usage of types of gourmet salts based on their applications
- Opinions of the customers about product trends and acceptance of various key player products
- Product development/opportunity mapping
Product Portfolio
- New product developments and advances leading to growth in the market
- Technological expansion for the production of gourmet salts (Fleur de sel, Sel gris, Himalayan salt)
- Matrix of products, functions, and applications
- In-depth product type analysis
Gourmet salt is available in various textures and flavors, affecting the food accordingly. The various types of gourmet salts are flake salts, fleur de sel, sel gris, and Himalayan salt, to name a few. This type of salt has wide application in foods that include beef, meat, poultry, sea food, sauces, and roasted vegetables. They are also blended with spices and flavors such as garlic, onion, chili, paprika, and pepper.
The market for gourmet salts has shown positive growth over the last few years. Gourmet salt are available in many varieties, each with a unique flavor, crystalline shape, and texture of its own. Due to media exposure and increasing globalization, people are becoming more aware of various cuisines and are becoming more open to experiment with food. Chefs are improvising on the recipes by using gourmet salt, enhancing the organoleptic qualities and hence, are increasing the appeal.
The gourmet salt market was segmented on the basis of the types of salts, their applications, and geography. The market applications for gourmet salts include bakery & confectionery, meat & poultry products, seafood products, and sauces & savory. On the basis of types, the gourmet salt are categorized into fleur de sel, sel gris, Himalayan salt, flake salt, specialty salt, and others. The geographic segmentation of the market includes regions such as North America, Europe, Asia-Pacific, and Rest of the World (ROW).
Gourmet Salt Market Size, by Geography, 2013 VS. 2019 ($Million)
P - Projected
Source: MarketsandMarkets Analysis
The European region was the largest market for gourmet salt, in terms of value, in 2013. North American region is projected to be the fastest growing market for gourmet salt, in terms of value. The leading players in the gourmet salts market include Morton Salt, Inc. (U.S.), Saltworks, Inc. (U.S.), and Murray River Gourmet Salt (Australia). The companies are adopting development strategies such as new product launches and expansion to increase their products portfolio and productivity.
 Exclusive indicates content/data unique to MarketsandMarkets and not available with any competitors.
Table Of Contents
1 Introduction (Page No. - 17)
1.1 Key Take-Aways
1.2 Report Description
1.3 Markets Covered
1.4 Stakeholders
1.5 Research Methodology
1.5.1 Market Size Estimation
1.5.2 Market Crackdown & Data Triangulation
1.5.3 Assumptions Made For The Report
1.5.4 Periodization Considered For The Gourmet Salts Market
1.5.5 Key Data Points Taken From Secondary Sources
1.5.6 Key Data Points Taken From Primary Sources
2 Executive Summary (Page No. - 29)
3 Premium Insights (Page No. - 32)
4 Industry Analysis (Page No. - 39)
4.1 Introduction
4.2 Core Industry Analysis
4.2.1 Seasoning & Spices
4.2.2 Gourmet Food
4.3 Gourmet Salt
4.3.1 Supply Chain Analysis
4.3.2 Industry Insight
4.3.2.1 Shift From Table Salt To Gourmet Salts
4.4 Market Share Analysis
5 Market Overview (Page No. - 45)
5.1 Introduction
5.1.1 Growing Exotic Tastes Among Consumers
5.2 History Of Salt
5.3 Market Statistics
5.3.1 Salt Market
5.3.2 Gourmet Salt Market
6 Market Analysis (Page No. - 50)
6.1 Introduction
6.2 Winning Imperative
6.2.1 R&D Initiatives For Producing More Flavors
6.3 Burning Issue
6.3.1 Concerns Regarding Quality Of Gourmet Salt
6.3.2 Cash Claims Less Difference Between Gourmet Salt & Table Salt
6.4 Market Dynamics
6.4.1 Drivers
6.4.1.1 Increasing Applications Of Gourmet Salt
6.4.1.1.1 Traditional Cuisines
6.4.1.1.2 Professional Cooks In Luxury Hotels
6.4.1.2 Advantages Related To Natural Sea Salts
6.4.1.3 High Profit Margin For Retailers
6.4.2 Restraints
6.4.2.1 Gourmet Salts Are More Expensive
6.4.2.2 Lack Of Awareness About Gourmet Salt
6.4.3 Opportunities
6.4.3.1 Increasing Food & Cookery Shows
6.4.3.2 Rising Gourmet Restaurants Throughout The World
6.5 Porter�s Five Forces
6.5.1 Degree Of Competition
6.5.2 Bargaining Power Of Suppliers
6.5.3 Bargaining Power Of Buyers
6.5.4 Threat Of New Entrants
6.5.5 Threat Of Substitutes
7 Gourmet Salts Market, By Type (Page No. - 62)
7.1 Introduction
7.2 Fleur De Sel
7.3 Sel Gris
7.4 Himalayan Salt
7.5 Flake Salts
7.6 Specialty Gourmet Salt
7.6.1 Flavored Salts
7.6.2 Smoked Salts
7.7 Other Gourmet Salt
7.7.1 Italian Sea Salt
7.7.2 Hawaiian Salt
7.8 North America: Market, By Type
7.9 Europe: Market, By Type
7.10 Asia-Pacific: Market, By Type
7.11 Row: Market, By Type
8 Gourmet Salts Market, By Application (Page No. - 90)
8.1 Introduction
8.2 Bakery & Confectionery Products
8.3 Meat & Poultry Products
8.4 Seafood Products
8.5 Sauces & Savories
8.6 Other Applications
8.7 Fleur De Sel Salt Market, By Application
8.8 Sel Gris Gourmet Salt Market, By Application
8.9 Himalayan Salt Market, By Application
8.10 Flake Salt Market, By Application
8.11 Specialty Salt Market, By Application
8.12 Other Salt Market, By Application
9 Gourmet Salts Market, By Geography (Page No. - 118)
9.1 Introduction
9.2 North America
9.2.1 U.S.
9.2.2 Canada
9.2.3 Mexico
9.3 Europe
9.3.1 U.K.
9.3.2 Italy
9.3.3 France
9.3.4 Germany
9.3.5 Spain
9.3.6 Rest Of Europe
9.4 Asia-Pacific
9.4.1 China
9.4.2 India
9.4.3 Japan
9.4.4 Australia
9.4.5 New Zealand
9.4.6 Rest Of Asia-Pacific
9.5 Rest Of The World
9.5.1 Latin America
9.5.2 The Middle East
9.5.3 Other Countries Of Row
10 Competitive Landscape (Page No. - 167)
10.1 Introduction
10.2 Saltworks: The Most Active Company
10.3 Moderately Competitive Market
10.4 New Product Launches: Most Preferred Strategic Approach
10.5 Key Market Strategies
10.6 Agreements, Partnerships & Collaborations
10.7 New Product/ Technology Launches
10.8 Investments & Expansions
11 Company Profiles (Company At A Glance, Recent Financials, Products & Services, Strategies & Insights, & Recent Developments)* (Page No. - 176)
11.1 Alaska Pure Sea Salt Co.
11.2 Amagansett Sea Salt Co.
11.3 Cargill, Incorporated
11.4 Cheetham Salt Ltd.
11.5 Infosa
11.6 Maldon Crystal Salt Co.
11.7 Morton Salt, Inc.
11.8 Murray River Salt
11.9 Pyramid Salt Pty.Ltd.
11.10 Saltworks, Inc. *Details On Company At A Glance, Recent Financials, Products & Services, Strategies & Insights, & Recent Developments Might Not Be Captured In Case Of Unlisted Companies.
List Of Tables (112 Tables)
Table 1 Gourmet Salts Market Estimation
Table 2 Types Of Salts & Their Applications
Table 3 History Of Salt
Table 4 Gourmet Salt & Their Applications
Table 5 Market Size, By Type, 2012-2019 ($Million)
Table 6 Market Size, By Type, 2012�2019 (Tons)
Table 7 Fleur De Sel Gourmet Salts Market Size, By Geography, 2012-2019 ($Million)
Table 8 Fleur De Sel Salt Market Size, By Geography, 2012�2019 (Tons)
Table 9 Texture Of Sel Gris & Their Applications
Table 10 Sel Gris Gourmet Salts Market Size, By Geography, 2012-2019 ($Million)
Table 11 Sel Gris Salt Market Size, By Geography, 2012�2019 (Tons)
Table 12 Himalayan Gourmet Salts Market Size, By Geography, 2012-2019 ($Million)
Table 13 Himalayan Salt Market Size, By Geography, 2012�2019 (Tons)
Table 14 Flake Gourmet Salts Market Size, By Geography, 2012-2019 ($Million)
Table 15 Flake Salt Market Size, By Geography, 2012�2019 (Tons)
Table 16 Specialty Gourmet Salt Market Size, By Geography, 2012-2019 ($Million)
Table 17 Specialty Salt Market Size, By Geography, 2012�2019 (Tons)
Table 18 Other Gourmet Salts Market Size, By Geography, 2012-2019 ($Million)
Table 19 Other Salt Market Size, By Geography, 2012�2019 (Tons)
Table 20 North America: Gourmet Salts Market Size, By Type, 2012-2019 ($Million)
Table 21 North America: Salt Market Size, By Type, 2012�2019 (Tons)
Table 22 Europe: Gourmet Salts Market Size, By Type, 2012-2019 ($Million)
Table 23 Europe: Salt Market Size, By Type, 2012�2019 (Tons)
Table 24 Asia-Pacific: Gourmet Salt Market Size, By Type, 2012-2019 ($Million)
Table 25 Asia-Pacific: Salt Market Size, By Type, 2012�2019 (Tons)
Table 26 Row: Gourmet Salts Market Size, By Type, 2012-2019 ($Million)
Table 27 Row: Salt Market Size, By Type, 2012�2019 (Tons)
Table 28 Gourmet Salt & Their Applications
Table 29 Market Size, By Application, 2012�2019 ($Million)
Table 30 Market Size, By Application, 2012�2019 (Tons)
Table 31 Gourmet Salts In Bakery & Confectionery Products Market Size, By Geography, 2012-2019 ($Million)
Table 32 Gourmet Salt In Bakery & Confectionery Products Market Size, By Geography, 2012-2019 (Tons)
Table 33 Gourmet Salt In Meat & Poultry Products Market Size, By Geography, 2012-2019 ($Million)
Table 34 Gourmet Salt In Meat & Poultry Products Market Size, By Geography, 2012-2019 (Tons)
Table 35 Gourmet Salts In Seafood Products Market Size, By Geography, 2012-2019 ($Million)
Table 36 Salt In Seafood Products Market Size, By Geography, 2012-2019 (Tons)
Table 37 Gourmet Salt In Sauces & Savories Market Size, By Geography, 2012-2019 ($Million)
Table 38 Salt In Sauces & Savories Market Size, By Geography, 2012-2019 (Tons)
Table 39 Gourmet Salt In Other Applications Market Size, By Geography, 2012-2019 ($Million)
Table 40 Salts In Other Applciations Market Size, By Geography, 2012-2019 (Tons)
Table 41 Fleur De Sel Gourmet Salt Market Size, By Application, 2012�2019 ($Million)
Table 42 Fleur De Sel Salt Market Size, By Application, 2012�2019 (Tons)
Table 43 Sel Gris Gourmet Salts Market Size, By Application, 2012�2019 ($Million)
Table 44 Sel Gris Salt Market Size, By Application, 2012�2019 (Tons)
Table 45 Himalayan Gourmet Salt Market Size, By Application, 2012�2019 ($Million)
Table 46 Himalayan Salt Market Size, By Application, 2012�2019 (Tons)
Table 47 Flake Gourmet Salts Market Size, By Application, 2012�2019 ($Million)
Table 48 Flake Salt Market Size, By Application, 2012�2019 (Tons)
Table 49 Specialty Gourmet Salt Market Size, By Application, 2012�2019 ($Million)
Table 50 Specialty Salt Market Size, By Application, 2012�2019 (Tons)
Table 51 Other Gourmet Salts Market Size, By Application, 2012�2019 ($Million)
Table 52 Other Salt Market Size, By Application, 2012�2019 (Tons)
Table 53 Gourmet Salts, By Country
Table 54 Market Size, By Geography, 2012-2019 ($Million)
Table 55 Market Size, By Geography, 2012-2019 (Tons)
Table 56 North America: Gourmet Salts Market Size, By Country, 2012-2019 ($Million)
Table 57 North America: Salt Market Size, By Country, 2012-2019 (Tons)
Table 58 U.S.: Salts Market Size, By Type, 2012-2019 ($Million)
Table 59 U.S.: Gourmet Salt Market Size, By Type, 2012�2019 (Tons)
Table 60 Canada: Gourmet Salt Market Size, By Type, 2012-2019 ($Million)
Table 61 Canada: Salt Market Size, By Type, 2012�2019 (Tons)
Table 62 Mexico: Gourmet Salts Market Size, By Type, 2012-2019 ($Million)
Table 63 Mexico: Salt Market Size, By Type, 2012�2019 (Tons)
Table 64 Europe: Gourmet Salts Market Size, By Country, 2012-2019 ($Million)
Table 65 Europe: Salt Market Size, By Country, 2012-2019 (Tons)
Table 66 U.K.: Gourmet Salts Market Size, By Type, 2012-2019 ($Million)
Table 67 U.K.: Salt Market Size, By Type, 2012�2019 (Tons)
Table 68 Italy: Gourmet Salt Market Size, By Type, 2012-2019 ($Million)
Table 69 Italy: Salt Market Size, By Type, 2012�2019 (Tons)
Table 70 France: Gourmet Salts Market Size, By Type, 2012-2019 ($Million)
Table 71 France: Salt Market Size, By Type, 2012�2019 (Tons)
Table 72 Germany: Gourmet Salts Market Size, By Type, 2012-2019 ($Million)
Table 73 Germany: Salt Market Size, By Type, 2012�2019 (Tons)
Table 74 Spain: Gourmet Salt Market Size, By Type, 2012-2019 ($Million)
Table 75 Spain: Salt Market Size, By Type, 2012�2019 (Tons)
Table 76 Rest Of Europe: Gourmet Salts Market Size, By Type, 2012-2019 ($Million)
Table 77 Rest Of Europe: Salt Market Size, By Type, 2012�2019 (Tons)
Table 78 Asia-Pacific: Gourmet Salts Market Size, By Country, 2012-2019 ($Million)
Table 79 Asia-Pacific: Salt Market Size, By Country, 2012-2019 (Tons)
Table 80 China: Gourmet Salts Market Size, By Type, 2012-2019 ($Million)
Table 81 China: Salt Market Size, By Type, 2012�2019 (Tons)
Table 82 India: Gourmet Salt Market Size, By Type, 2012-2019 ($Million)
Table 83 India: Salts Market Size, By Type, 2012�2019 (Tons)
Table 84 Japan: Gourmet Salt Market Size, By Type, 2012-2019 ($Million)
Table 85 Japan: Salt Market Size, By Type, 2012�2019 (Tons)
Table 86 Australia: Gourmet Salts Market Size, By Type, 2012�2019 ($Million)
Table 87 Australia: Salt Market Size, By Type, 2012�2019 (Tons)
Table 88 New Zealand: Gourmet Salts Market Size, By Type, 2012�2019 ($Million)
Table 89 New Zealand: Salt Market Size, By Type, 2012�2019 (Tons)
Table 90 Rest Of Asia-Pacific: Gourmet Salts Market Size, By Type, 2012-2019 ($Million)
Table 91 Rest Of Asia-Pacific: Salt Market Size, By Type, 2012�2019 (Tons)
Table 92 Row: Gourmet Salts Market Size, By Geography, 2012-2019 ($Million)
Table 93 Row: Salt Market Size, By Geography, 2012-2019 (Tons)
Table 94 Latin America: Gourmet Salts Market Size, By Type, 2012-2019 ($Million)
Table 95 Latin America: Salt Market Size, By Type, 2012�2019 (Tons)
Table 96 The Middle East: Gourmet Salts Market Size, By Type, 2012-2019 ($Million)
Table 97 The Middle East: Salt Market Size, By Type, 2012�2019 (Tons)
Table 98 Other Countries Of Row: Gourmet Salts Market Size, By Type, 2012-2019 ($Million)
Table 99 Other Countries Of Row: Salt Market Size, By Type, 2012�2019 (Tons)
Table 100 Agreements, Partnerships & Collaborations, 2011
Table 101 New Product/Technology Launches, 2010-2014
Table 102 Investments & Expansions, 2011-2012
Table 103 Alaska Pure: Products & Their Descriptions
Table 104 Amagansett: Products & Their Descriptions
Table 105 Cargill: Products & Their Descriptions
Table 106 Cheetham Salt: Products & Their Descriptions
Table 107 Infosa: Products & Their Descriptions
Table 108 Maldon: Products & Their Descriptions
Table 109 Morton Salt: Products & Their Descriptions
Table 110 Murray River: Products & Their Descriptions
Table 111 Pyramid Salt: Products & Their Descriptions
Table 112 Saltworks: Products & Their Descriptions
List Of Figures (31 Figures)
Figure 1 Research Methodology
Figure 2 Gourmet Salts Market Size Estimation Methodology
Figure 3 Market Size, By Geography, 2013 ($Million)
Figure 4 Market Share (Value), By Application, 2013
Figure 5 Gourmet Salt Market Segmentation
Figure 6 Gourmet Salts Market Size, By Geography, 2013 Vs 2019
Figure 7 Market Life Cycle, By Geography, 2013 Vs. 2019
Figure 8 Market Size, By Application, 2012 ($Million)
Figure 9 Gourmet Salts Product Market Share (Value), By Type, 2013
Figure 10 Salts Market Dynamics
Figure 11 Gourmet Salt Market Development, By Strategy, 2010-2014
Figure 12 Common Seasoning & Spices Used In Food
Figure 13 Gourmet Salt Market Supply Chain Analysis
Figure 14 Salt Market Share Analysis, By Key Player, 2013
Figure 15 Gourmet Salt Market Segmentation
Figure 16 Types Of Flavors In Gourmet Salts
Figure 17 Sodium Content, By Salt Type
Figure 18 Gourmet Salts Market Dynamics
Figure 19 Porter�s Five Forces Analysis
Figure 20 Gourmet Salt In Bakery & Confectionery Products Market Share (Value), By Type, 2013
Figure 21 Gourmet Salt In Sauces & Savories Market Share (Value), By Type, 2013
Figure 22 Competitive Gourmet Salts Market Product & Development Portfolio, By Company, 2010�2014
Figure 23 Annual Gourmet Salts Market Development Trend, 2010-2014
Figure 24 Market Share (Developments), By Growth Strategy, 2010�2014
Figure 25 Annual Gourmet Salts Market Development Analysis, By Growth Strategy, 2010�2014
Figure 26 Gourmet Salt Market Share (Developments), By Company, 2010�2014
Figure 27 Cargill: Swot Analysis
Figure 28 Cheetham Salts: Swot Analysis
Figure 29 Morton: Swot Analysis
Figure 30 Murray River: Swot Analysis
Figure 31 Saltworks: Swot Analysis


Growth opportunities and latent adjacency in Gourmet Salts Market