Global DNA and Gene Chip (Microarrays) Market (2010 ¢ 2015)


DNA microarrays are a technology used to measure the expression levels of thousands of genes together and at times, all genes in a genome at the same time. There are two types of DNA microarrays, cDNA (complementary DNA), and oDNA (oligonucleotide DNA) with oDNA dominating the market with a share of almost 98%. The global DNA and gene chip (Microarray) market offers tremendous growth potential and has witnessed the entry of a number of players striving for a share in this market.
The global DNA & gene chip (microarray) market was valued at $760 million in 2010 and is expected to reach $1,425.2 million by 2015 growing at a CAGR of and 13.4%. Affymetrix, Inc. dominate this market mainly due to high density of their chips, sizeable number of patents, first-to-market presence, and many research and commercial partnerships. The other players include Illumina, Inc., Agilent Technologies, Inc., Roche Nimblegen, Sequenom Inc., Applied Microarrays, and others.
North America dominated the global DNA and gene chip market with maximum share in 2010. However, this share is likely to drop down in 2015 as the market has already reached maturity. Growth is expected from the Asian economies, especially China, India, South Korea, and Singapore, where government funding and investments in biotechnology play major roles. China and India being the most populous countries would provide the largest base for clinical trials and drug discovery; and thus will positively impact the DNA microarray market.
Singapore is amongst the most preferred locations for setting up manufacturing facilities for biotechnology and pharmaceutical companies due to strong intellectual property laws, excellent supply chain, and logistics connectivity. It offers world-class scientific infrastructure, safety and regulatory record, and a highly skilled 13,000-strong biomedical workforce. Therefore, it has been identified as one of the top five biotech hotspots of the world. Singapore's robust process R&D capabilities in electronics and precision engineering, large pool of well-educated workers, reduced cost, and competitive tax environment are the prime reasons for companies such as Affymetrix and Illumina to move their manufacturing bases to Singapore.
Gene expression currently forms the largest application market as gene expression products have diverse usage in areas such as clinical diagnostics, biodefense, and agriculture that are gaining tremendous government funding. While this application contributed 28% to the global DNA & gene chip (microarray) market revenues in 2010, cancer diagnosis and treatment application is expected to dominate the applications market by 2015; accounting for about 24% share in the market.
Scope of the report
This research report categorizes the global DNA & gene chip (microarray) market on the basis of applications, types, and geography; forecasting revenues, and analyzing trends in each of the following submarkets:
On the basis of applications:
Gene expression, cancer diagnostics & treatments, drug discovery, genetics (DNA sequencing by hybridization, reverse genetics, functional genomics, and genomic mismatch scanning, gene mapping, diagnosis), SNP analysis, screening & monitoring of patient data during clinical trials, proteomics, toxicogenomics, microbial genotyping, agricultural biology, and environmental control
On the basis of types:
Oligonucleotide DNA microarrays (oDNA) and complementary DNA microarrays (cDNA)
On the basis of geography:
- North America (U.S., Canada)
- Europe (Germany, France, Italy, Spain, UK)
- Asia (India, China, Japan, South Korea), and
- Rest of the World
Each section provides market data, market drivers, trends and opportunities, top-selling products, key players, and competitive outlook. This report also provides market tables for covering the sub-segments. In addition, the report provides more than 30 company profiles covering all the sub-segments.
DNA microarray is the largest contributing segment of the biochip family. DNA microarrays studied in this report are categorized by cDNA (complementary DNA) and oDNA (oligonucleotide DNA), of which oDNA account for as high as 98% of the total market. The prime reason is the high specificity these chips offer with shorter probes. Affymetrix, Inc. (U.S.) is the pioneer in oDNA microarrays. The company commercialized its products in 1989 and since then has been the market leader. However, the market share is found depleting with the passage of each year. The global DNA & gene chip market was valued at $760 million in 2010 and is expected to reach $1,425.2 million by 2015; growing at a CAGR of and 13.4%.
Global DNA & Gene Chip Market dynamics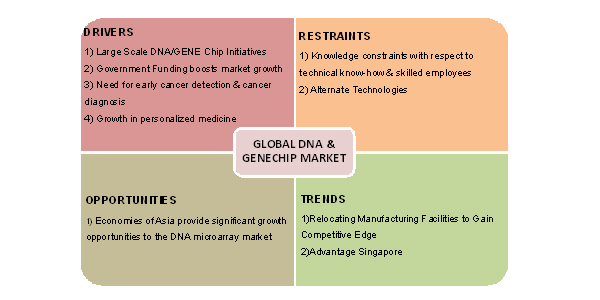
Source: Expert Interviews, MarketsandMarkets Analysis
The DNA microarray market is influenced by its parent (biotechnology) market with North America and Europe accounting for a larger chunk in the red sector (human health) of the biotech market and the Asian economies more focused towards the green sector (agricultural and zoo-technical sector).
The DNA & gene chip market is primarily driven by growth in personalized medicine, need for early cancer detection & cancer diagnosis, and government funding. Many Companies developing microarray technologies also depend on funds received by the government as their main customers include government laboratories, academic centers, and clinical research organizations. The Asian countries provide immense growth opportunities for the DNA microarray markets as this region accounts for more than half of the world population and the government in these countries has planned substantial budget allocations for developing the biotechnology sector. Besides, Affymetrix, Inc (U.S.) and Illumina, Inc. (U.S.) have relocated their manufacturing facilities in the Asian sub-continent to take advantage of the growing demand and gain competitive edge in the region with large number of regional players.
 Exclusive indicates content/data unique to MarketsandMarkets and not available with any competitors.
TABLE OF CONTENTS
EXECUTIVE SUMMARY
OBJECTIVE
MARKET SCENARIO
1 INTRODUCTION
1.1 KEY TAKE-AWAYS
1.2 REPORT DESCRIPTION
1.3 MARKETS COVERED
1.4 STAKEHOLDERS
1.5 RESEARCH METHODOLOGY
2 SUMMARY
3 MARKET OVERVIEW
3.1 INTRODUCTION
3.2 DNA MICROARRAY REQUIREMENTS
3.2.1 FIRM TETHERING
3.2.2 UNHINDERED BINDING
3.2.3 USING LARGER & DNA MOLECULES
3.2.4 NO CROSS CONTAMINATION
3.3 DNA MICROARRAY DEVELOPMENT TRENDS
3.3.1 GLASS ARRAYS TRENDS
3.3.2 AMERSHAM'S COATING TECHNOLOGY
3.3.3 AGILENT TECHNOLOGY
3.3.4 PROBE TECHNOLOGY
3.4 COMPARISON OF INKJET & PHOTOLITHOGRAPHIC TECHNOLOGY
3.4.1 PHOTOLITHOGRAPHY
3.4.2 INKJET TECHNOLOGY
3.5 KEY CHALLENGES IN DNA/GENE MICROARRAY MANUFACTURING
3.5.1 BASE PAIR MISMATCH
3.5.2 POOR BINDING
3.5.3 HYBRIDIZATION
3.5.4 VARIABLE SIGNAL STRENGTHS
3.5.5 INTERPRETATION OF MICROARRAYS
3.5.6 INTRAMICROARRAY VARIABILITY & INTERMICROARRAY VARIABILITY
3.5.7 THE INCOMPLETE REACTION PROBLEM
3.5.8 PROBE DESIGN
3.5.9 SUBSTRATES
3.5.10 MARKER MOLECULES
3.5.11 UNREACTIVE SURFACE
3.6 MARKET DRIVERS
3.6.1 LARGE SCALE DNA/GENE CHIP INITIATIVES
3.6.2 GROWTH OF PERSONALIZED MEDICINE
3.6.3 NEED FOR EARLY CANCER DETECTION & CANCER DIAGNOSIS
3.6.4 DNA/GENE CHIPS MINIATURIZATION
3.6.5 GOVERNMENT FUNDING BOOSTS MARKET GROWTH
3.7 RESTRAINTS
3.7.1 KNOWLEDGE CONSTRAINTS WITH RESPECT TO TECHNICAL KNOW-HOW & SKILLED EMPLOYEES
3.7.2 ALTERNATE TECHNOLOGIES
3.8 OPPORTUNITIES
3.8.1 ECONOMIES OF ASIA PROVIDE SIGNIFICANT GROWTH OPPORTUNITIES TO THE DNA MICROARRAY MARKET
3.9 BURNING ISSUES
3.9.1 PATENT DISPUTES
3.10 MARKET TRENDS
3.10.1 RELOCATING MANUFACTURING FACILITIES TO GAIN COMPETITIVE EDGE
3.10.1.1 Advantage Singapore
3.10.2 WINNING IMPERATIVES
3.10.2.1 Standardization
3.10.2.2 Size
3.10.2.3 Cost
3.10.2.4 Compatibility
3.10.2.5 End-to-end solutions
3.11 PATENT ANALYSIS
3.12 END-USER ANALYSIS
3.13 MARKET SHARE FOR MAJOR PLAYERS
4 DNA/GENE CHIPS (DNA MICROARRAY) MARKET BY TYPES & APPLICATIONS
4.1 INTRODUCTION
4.2 MARKET SEGMENTATION
4.3 DNA/GENE CHIPS (DNA MICROARRAY) MARKET BY TYPES
4.3.1 OLIGONUCLEOTIDE BASED CHIPS
4.3.1.1 Photolithographic (light generated) oligonucleotide chips
4.3.1.2 Inkjet print technology generated oligonucleotide chips
4.3.2 CDNA CHIPS
4.3.2.1 Mechanical microspotting generated cDNA chips
4.3.2.2 Inkjet print technology generated cDNA chips
4.4 DNA/GENE CHIPS (DNA MICROARRAY) MARKET BY APPLICATIONS
4.4.1 GENE EXPRESSION
4.4.2 SNP ANALYSIS
4.4.3 CANCER DIAGNOSIS & TREATMENT
4.4.4 GENOMICS
4.4.4.1 DNA sequencing in hybridization
4.4.4.2 Functional genomics & genomic mis-match scanning
4.4.4.3 Reverse genetics
4.4.4.4 Diagnosis & genetic mapping
4.4.5 PROTEOMICS
4.4.6 AGRICULTURAL BIOLOGY
4.4.7 ENVIRONMENTAL CONTROL
4.4.8 TOXICOGENOMICS
4.4.9 DRUG DISCOVERY
4.4.10 SCREENING & MONITORING OF PATIENT DATA IN CLINICAL TRIALS
4.4.11 MICROBIAL GENOTYPING
5 GEOGRAPHIC ANALYSIS
5.1 INTRODUCTION
5.2 NORTH AMERICA
5.2.1 U.S.
5.2.2 CANADA
5.3 EUROPE
5.3.1 GERMANY
5.3.2 FRANCE
5.3.3 ITALY
5.3.4 SPAIN
5.3.5 UNITED KINGDOM
5.4 ASIA
5.4.1 INDIA
5.4.2 CHINA
5.4.3 JAPAN
5.4.4 SOUTH KOREA
5.5 REST OF THE WORLD (ROW)
6 COMPETITIVE ANALYSIS
6.1 KEY STRATEGIES
7 COMPANY PROFILES
7.1 AFFYMETRIX INC
7.1.1 OVERVIEW
7.1.2 FINANCIALS
7.1.3 PRODUCTS & SERVICES
7.1.4 STRATEGY
7.1.5 DEVELOPMENTS
7.2 AGILENT TECHNOLOGIES INC
7.2.1 OVERVIEW
7.2.2 FINANCIALS
7.2.3 PRODUCTS & SERVICES
7.2.4 STRATEGY
7.2.5 DEVELOPMENTS
7.3 BIOM╔RIEUX SA
7.3.1 OVERVIEW
7.3.2 FINANCIALS
7.3.3 PRODUCTS & SERVICES
7.3.4 STRATEGY
7.3.5 DEVELOPMENTS
7.4 BIOMETRIX TECHNOLOGY INC
7.4.1 OVERVIEW
7.4.2 PRODUCTS & SERVICES
7.4.3 STRATEGY
7.5 BIONEER CORP
7.5.1 OVERVIEW
7.5.2 FINANCIALS
7.5.3 PRODUCTS & SERVICES
7.5.4 STRATEGY
7.5.5 DEVELOPMENTS
7.6 CAPITALBIO CORP
7.6.1 OVERVIEW
7.6.2 PRODUCTS & SERVICES
7.6.3 STRATEGY
7.6.4 DEVELOPMENTS
7.7 EUROFINS MWG OPERON
7.7.1 OVERVIEW
7.7.2 PRODUCTS & SERVICES
7.7.3 STRATEGY
7.7.4 DEVELOPMENTS
7.8 GREINER BIO-ONE
7.8.1 OVERVIEW
7.8.2 PRODUCT & SERVICES
7.8.3 STRATEGY
7.8.4 DEVELOPMENTS
7.9 ILLUMINA INC
7.9.1 OVERVIEW
7.9.2 FINANCIALS
7.9.3 PRODUCTS & SERVICES
7.9.4 STRATEGY
7.9.5 DEVELOPMENTS
7.10 LC SCIENCES
7.10.1 OVERVIEW
7.10.2 PRODUCTS & SERVICES
7.10.3 STRATEGY
7.10.4 DEVELOPMENTS
7.11 LIFEGEN TECHNOLOGIES
7.11.1 OVERVIEW
7.11.2 PRODUCTS & SERVICES
7.11.3 STRATEGY
7.11.4 DEVELOPMENTS
7.12 LIFE TECHNOLOGIES CORP
7.12.1 OVERVIEW
7.12.2 FINANCIALS
7.12.3 PRODUCTS & SERVICES
7.12.4 STRATEGY
7.12.5 DEVELOPMENTS
7.13 MACROGEN INC
7.13.1 OVERVIEW
7.13.2 PRODUCTS & SERVICES
7.13.3 STRATEGY
7.13.4 DEVELOPMENTS
7.14 MICROARRAYS INC
7.14.1 OVERVIEW
7.14.2 PRODUCTS & SERVICES
7.14.3 STRATEGY
7.14.4 DEVELOPMENTS
7.15 NGK INSULATORS LTD
7.15.1 OVERVIEW
7.15.2 FINANCIALS
7.15.3 PRODUCTS & SERVICES
7.15.4 STRATEGY
7.15.5 DEVELOPMENTS
7.16 OCIMUM BIOSOLUTIONS LTD
7.16.1 OVERVIEW
7.16.2 PRODUCTS & SERVICES
7.16.3 STRATEGY
7.16.4 DEVELOPMENTS
7.17 OXFORD GENE TECHNOLOGY
7.17.1 OVERVIEW
7.17.2 PRODUCTS & SERVICES
7.17.3 STRATEGY
7.17.4 DEVELOPMENTS
7.18 PERKINELMER
7.18.1 OVERVIEW
7.18.2 FINANCIALS
7.18.3 PRODUCTS & SERVICES
7.18.4 STRATEGY
7.18.5 DEVELOPMENTS
7.19 PAMGENE INTERNATIONAL B.V.
7.19.1 OVERVIEW
7.19.2 PRODUCT & SERVICES
7.19.3 STRATEGY
7.20 ROCHE NIMBLEGEN INC
7.20.1 OVERVIEW
7.20.2 PRODUCTS & SERVICES
7.20.3 STRATEGY
7.20.4 DEVELOPMENTS
7.21 SAVYON DIAGNOSTICS LTD
7.21.1 OVERVIEW
7.21.2 PRODUCTS & SERVICES
7.21.3 STRATEGY
7.21.4 DEVELOPMENTS
7.22 SEQUENOM INC
7.22.1 OVERVIEW
7.22.2 FINANCIALS
7.22.3 PRODUCTS & SERVICES
7.22.4 STRATEGY
7.22.5 DEVELOPMENTS
7.23 SHANGHAI BIOCHIP CO LTD
7.23.1 OVERVIEW
7.23.2 PRODUCTS & SERVICES
7.23.3 STRATEGY
7.23.4 DEVELOPMENTS
7.24 SIGMA-ALDRICH
7.24.1 OVERVIEW
7.24.2 FINANCIALS
7.24.3 PRODUCTS & SERVICES
7.24.4 STRATEGY
7.24.5 DEVELOPMENTS
7.25 SURMODICS INC
7.25.1 OVERVIEW
7.25.2 FINANCIALS
7.25.3 PRODUCT & SERVICES
7.25.4 STRATEGY
7.25.5 DEVELOPMENTS
7.26 SCIENION AG
7.26.1 OVERVIEW
7.26.2 PRODUCTS & SERVICES
7.26.3 STRATEGY
7.26.4 DEVELOPMENTS
7.27 TOSHIBA CORP
7.27.1 OVERVIEW
7.27.2 FINANCIALS
7.27.3 PRODUCTS & SERVICES
7.28 WAFERGEN BIOSYSTEMS INC
7.28.1 OVERVIEW
7.28.2 FINANCIALS
7.28.3 PRODUCTS & SERVICES
7.28.4 STRATEGY
7.28.5 DEVELOPMENTS
7.29 ARRAYIT CORP
7.29.1 OVERVIEW
7.29.2 FINANCIALS
7.29.3 PRODUCTS & SERVICES
7.29.4 STRATEGY
7.29.5 DEVELOPMENTS
7.30 OTHERS
7.30.1 APPLIED MICROARRAYS INC
7.30.1.1 Overview
7.30.1.2 Products & Services
7.30.2 CANON INC
7.30.2.1 Overview
7.30.2.2 Financials
7.30.2.3 Products & Services
7.30.3 GENISPHERE LLC
7.30.3.1 Overview
7.30.3.2 Products & Services
7.30.4 HITACHI LTD
7.30.4.1 Overview
7.30.4.2 Financials
7.30.4.3 Products & Services
7.30.5 CYTOPATHFINDER INC
7.30.5.1 Overview
7.30.5.2 Products & Services
7.30.6 INTEGRATED DNA TECHNOLOGIES
7.30.6.1 Overview
7.30.6.2 Products & Services
7.30.7 EXIQON
7.30.7.1 Overview
7.30.7.2 Financials
7.30.7.3 Products & Services
7.30.8 SAMSUNG ELECTRONICS CO LTD
7.30.8.1 Overview
7.30.8.2 Financials
7.30.8.3 Products & Services
7.30.9 PROMEGA CORP
7.30.9.1 Overview
7.30.9.2 Products & Services
7.30.10 THERMO FISHER SCIENTIFIC INC
7.30.10.1 Overview
7.30.10.2 Financials
7.30.10.3 Products & Services
ō * The companies listed are a representative sample of the marketÆs ecosystem and in no particular orderö
APPENDIX
U.S. PATENTS
EUROPE PATENTS
JAPAN PATENTS
WIPO PATENTS
LIST OF TABLES
TABLE 1 GLOBAL DNA & GENE CHIP MARKET REVENUE, BY TYPES, 2008 ¢ 2015 ($MILLION)
TABLE 2 GLOBAL DNA & GENE CHIP MARKET, BY TYPES, 2008 ¢ 2015 (UNIT SHIPMENTS)
TABLE 3 TOP 5 DNA MICROARRAY TECHNOLOGIES
TABLE 4 COMPARISON BETWEEN PHOTOLITHOGRAPHY & INKJET TECHNOLOGY
TABLE 5 PATENT DISPUTES IN DNA MICROARRAY MARKET
TABLE 6 TAX ENVIRONMENT
TABLE 7 TAX ENVIRONMENT: FOR NEW START UP COMPANIES IN SINGAPORE
TABLE 8 ODNA CHIP MARKET REVENUE, BY GEOGRAPHY, 2008 ¢ 2015 ($MILLION)
TABLE 9 ODNA CHIP MARKET, BY GEOGRAPHY, 2008 ¢ 2015 (UNIT SHIPMENTS)
TABLE 10 CDNA CHIP MARKET REVENUE, BY GEOGRAPHY, 2008 ¢ 2015 ($THOUSAND)
TABLE 11 CDNA CHIP MARKET, BY GEOGRAPHY, 2008 ¢ 2015 (UNIT SHIPMENTS) TABLE 12 GLOBAL DNA & GENE CHIP MARKET REVENUE, BY APPLICATIONS, 2008 ¢ 2015 ($MILLION)
TABLE 13 GLOBAL DNA & GENE CHIP MARKET, BY APPLICATIONS, 2008 ¢ 2015 (UNIT SHIPMENTS)
TABLE 14 GENE EXPRESSION PRODUCT PORTFOLIO
TABLE 15 GENE EXPRESSION MARKET REVENUE, BY GEOGRAPHY, 2008 ¢ 2015 ($MILLION)
TABLE 16 GENE EXPRESSION MARKET, BY GEOGRAPHY, 2008 ¢ 2015 (UNIT SHIPMENTS)
TABLE 17 SNP ANALYSIS PRODUCT PORTFOLIO
TABLE 18 SNP ANALYSIS MARKET REVENUE, BY GEOGRAPHY, 2008 ¢ 2015 ($MILLION)
TABLE 19 SNP ANALYSIS MARKET, BY GEOGRAPHY, 2008 ¢ 2015 (UNIT SHIPMENTS)
TABLE 20 CANCER DIAGNOSTICS & TREATMENT MARKET REVENUE, BY GEOGRAPHY, 2008 ¢ 2015 ($MILLION)
TABLE 21 CANCER DIAGNOSTICS & TREATMENT MARKET, BY GEOGRAPHY, 2008 ¢ 2015 (UNIT SHIPMENTS)
TABLE 22 CANCER DIAGNOSIS & TREATMENT PRODUCT PORTFOLIO
TABLE 23 GENOMICS MARKET REVENUE, BY GEOGRAPHY, 2008 ¢ 2015 ($MILLION)
TABLE 24 GENOMICS MARKET, BY GEOGRAPHY, 2008 ¢ 2015 (UNIT SHIPMENTS)
TABLE 25 DIAGNOSIS & GENETIC MAPPING PRODUCT PORTFOLIO
TABLE 26 PROTEOMICS MARKET REVENUE, BY GEOGRAPHY, 2008 ¢ 2015 ($MILLION)
TABLE 27 PROTEOMICS MARKET, BY GEOGRAPHY, 2008 ¢ 2015 (UNIT SHIPMENTS)
TABLE 28 AGRICULTURAL BIOLOGY PRODUCT PORTFOLIO
TABLE 29 AGRICULTURAL BIOLOGY MARKET REVENUE, BY GEOGRAPHY, 2008 ¢ 2015 ($MILLION)
TABLE 30 AGRICULTURAL BIOLOGY MARKET, BY GEOGRAPHY, 2008 ¢ 2015 (UNIT SHIPMENTS)
TABLE 31 ENVIRONMENTAL CONTROL MARKET REVENUE, BY GEOGRAPHY, 2008 ¢ 2015 ($THOUSAND)
TABLE 32 ENVIRONMENTAL CONTROL MARKET, BY GEOGRAPHY, 2008 ¢ 2015 (UNIT SHIPMENTS)
TABLE 33 TOXICOGENOMICS MARKET REVENUE, BY GEOGRAPHY, 2008 ¢ 2015 ($MILLION)
TABLE 34 TOXICOGENOMICS MARKET, BY GEOGRAPHY, 2008 ¢ 2015 (UNIT SHIPMENTS)
TABLE 35 DRUG DISCOVERY MARKET REVENUE, BY GEOGRAPHY, 2008 ¢ 2015 ($MILLION)
TABLE 36 GLOBAL DRUG DISCOVERY MARKET, BY GEOGRAPHY, 2008 ¢ 2015 (UNIT SHIPMENTS)
TABLE 37 SCREENING & MONITORING PATIENT DATA IN CLINICAL TRIALS MARKET REVENUE, BY GEOGRAPHY, 2008 ¢ 2015 ($MILLION)
TABLE 38 SCREENING & MONITORING PATIENT DATA IN CLINICAL TRIALS MARKET, BY GEOGRAPHY, 2008 ¢ 2015 (UNIT SHIPMENTS)
TABLE 39 MICROBIAL GENOTYPING MARKET REVENUE, BY GEOGRAPHY, 2008 ¢ 2015 ($MILLION)
TABLE 40 MICROBIAL GENOTYPING MARKET, BY GEOGRAPHY, 2008 ¢ 2015 (UNIT SHIPMENTS)
TABLE 41 NORTH AMERICA: DNA & GENE CHIP MARKET, BY REVENUE, BY GEOGRAPHY, 2008 ¢ 2015 ($MILLION)
TABLE 42 NORTH AMERICA: DNA & GENE CHIP MARKET, BY GEOGRAPHY, 2008 ¢ 2015 (UNIT SHIPMENTS)
TABLE 43 NORTH AMERICA: DNA & GENE CHIP MARKET, BY REVENUE, BY APPLICATIONS, 2008 ¢ 2015 ($MILLION)
TABLE 44 NORTH AMERICA: DNA & GENE CHIP MARKET, BY APPLICATIONS, 2008 ¢ 2015 (UNIT SHIPMENTS)
TABLE 45 U.S.: DNA & GENE CHIP MARKET, BY REVENUE, BY TYPES, 2008 ¢ 2015 ($MILLION)
TABLE 46 U.S.: DNA & GENE CHIP MARKET, BY TYPES, 2008 ¢ 2015 (UNIT SHIPMENTS)
TABLE 47 U.S.: DNA & GENE CHIP MARKET, BY REVENUE, BY APPLICATIONS, 2008 ¢ 2015 ($MILLION)
TABLE 48 U.S.: DNA & GENE CHIP MARKET, BY APPLICATIONS, 2008 ¢ 2015 (UNIT SHIPMENTS)
TABLE 49 CANADA: DNA & GENE CHIP MARKET , BY REVENUE, BY TYPES, 2008 ¢ 2015 ($THOUSAND)
TABLE 50 CANADA: DNA & GENE CHIP MARKET, BY TYPES, 2008 ¢ 2015 (UNIT SHIPMENTS)
TABLE 51 CANADA: DNA & GENE CHIP MARKET, BY REVENUE, BY APPLICATIONS, 2008 ¢ 2015 ($THOUSAND)
TABLE 52 CANADA: DNA & GENE CHIP MARKET, BY APPLICATIONS, 2008 ¢ 2015 (UNIT SHIPMENTS)
TABLE 53 EUROPE: DNA & GENE CHIP MARKET REVENUE, BY GEOGRAPHY, 2008 ¢ 2015 ($MILLION)
TABLE 54 EUROPE: DNA & GENE CHIP MARKET, BY GEOGRAPHY, 2008 ¢ 2015 (UNIT SHIPMENTS)
TABLE 55 EUROPE: DNA & GENE CHIP MARKET, BY REVENUE, BY APPLICATIONS, 2008 ¢ 2015 ($MILLION)
TABLE 56 EUROPE: DNA & GENE CHIP MARKET, BY APPLICATIONS, 2008 ¢ 2015 (UNIT SHIPMENTS)
TABLE 57 GERMANY: DNA & GENE CHIP MARKET, BY REVENUE, BY TYPES, 2008 ¢ 2015 ($THOUSAND)
TABLE 58 GERMANY: DNA & GENE CHIP MARKET, BY TYPES, 2008 ¢ 2015 (UNIT SHIPMENTS)
TABLE 59 GERMANY: DNA & GENE CHIP MARKET, BY REVENUE, BY APPLICATIONS, 2008 ¢ 2015 ($THOUSAND)
TABLE 60 GERMANY: DNA & GENE CHIP MARKET, BY APPLICATIONS, 2008 ¢ 2015 (UNIT SHIPMENTS)
TABLE 61 FRANCE: DNA & GENE CHIP MARKET, BY REVENUE, BY TYPES, 2008 ¢ 2015 ($THOUSAND)
TABLE 62 FRANCE: DNA & GENE CHIP MARKET, BY TYPES, 2008 ¢ 2015 (UNIT SHIPMENTS)
TABLE 63 FRANCE: DNA & GENE CHIP MARKET, BY REVENUE, BY APPLICATIONS, 2008 ¢ 2015 ($THOUSAND)
TABLE 64 FRANCE: DNA & GENE CHIP MARKET, BY APPLICATIONS, 2008 ¢ 2015 (UNIT SHIPMENTS)
TABLE 65 ITALY: DNA & GENE CHIP MARKET , BY REVENUE, BY TYPES, 2008 ¢ 2015 ($THOUSAND)
TABLE 66 ITALY: DNA & GENE CHIP MARKET, BY TYPES, 2008 ¢ 2015 (UNIT SHIPMENTS)
TABLE 67 ITALY: DNA & GENE CHIP MARKET, BY REVENUE, BY APPLICATIONS, 2008 ¢ 2015 ($THOUSAND)
TABLE 68 ITALY: DNA & GENE CHIP MARKET, BY APPLICATIONS, 2008 ¢ 2015 (UNIT SHIPMENTS)
TABLE 69 SPAIN: DNA & GENE CHIP MARKET, BY REVENUE, BY TYPES, 2008 ¢ 2015 ($THOUSAND)
TABLE 70 SPAIN: DNA & GENE CHIP MARKET, BY TYPES, 2008 ¢ 2015 (UNIT SHIPMENTS)
TABLE 71 SPAIN: DNA & GENE CHIP MARKET, BY REVENUE, BY APPLICATIONS, 2008 ¢ 2015 ($THOUSAND)
TABLE 72 SPAIN: DNA & GENE CHIP MARKET, BY APPLICATIONS, 2008 ¢ 2015 (UNIT SHIPMENTS)
TABLE 73 UK: DNA & GENE CHIP MARKET , BY REVENUE, BY TYPES, 2008 ¢ 2015 ($THOUSAND)
TABLE 74 UK: DNA & GENE CHIP MARKET, BY TYPES, 2008 ¢ 2015 (UNIT SHIPMENTS)
TABLE 75 UK: DNA & GENE CHIP MARKET, BY REVENUE, BY APPLICATIONS, 2008 ¢ 2015 ($THOUSAND)
TABLE 76 UK: DNA & GENE CHIP MARKET, BY APPLICATIONS, 2008 ¢ 2015 (UNIT SHIPMENTS)
TABLE 77 ASIA: DNA & GENE CHIP MARKET, BY REVENUE, BY GEOGRAPHY, 2008 ¢ 2015 ($MILLION)
TABLE 78 ASIA: DNA & GENE CHIP MARKET, BY GEOGRAPHY, 2008 ¢ 2015 (UNIT SHIPMENTS)
TABLE 79 ASIA: DNA & GENE CHIP MARKET, BY REVENUE, BY APPLICATIONS, 2008 ¢ 2015 ($MILLION)
TABLE 80 ASIA: DNA & GENE CHIP MARKET, BY APPLICATIONS, 2008 ¢ 2015 (UNIT SHIPMENTS)
TABLE 81 INDIA: DNA & GENE CHIP MARKET, BY REVENUE, BY TYPES, 2008 ¢ 2015 ($THOUSAND)
TABLE 82 INDIA: DNA & GENE CHIP MARKET, BY TYPES, 2008 ¢ 2015 (UNIT SHIPMENTS)
TABLE 83 INDIA: DNA & GENE CHIP MARKET, BY REVENUE, BY APPLICATIONS, 2008 ¢ 2015 ($THOUSAND)
TABLE 84 INDIA: DNA & GENE CHIP MARKET, BY APPLICATIONS, 2008 ¢ 2015 (UNIT SHIPMENTS)
TABLE 85 CHINA: DNA & GENE CHIP MARKET, BY REVENUE, BY TYPES, 2008 ¢ 2015 ($THOUSAND)
TABLE 86 CHINA: DNA & GENE CHIP MARKET, BY TYPES, 2008 ¢ 2015 (UNIT SHIPMENTS)
TABLE 87 CHINA: DNA & GENE CHIP MARKET, BY REVENUE, BY APPLICATIONS, 2008 ¢ 2015 ($THOUSAND)
TABLE 88 CHINA: DNA & GENE CHIP MARKET, BY APPLICATIONS, 2008 ¢ 2015 (UNIT SHIPMENTS)
TABLE 89 JAPAN: DNA & GENE CHIP MARKET, BY REVENUE, BY TYPES, 2008 ¢ 2015 ($THOUSAND)
TABLE 90 JAPAN: DNA & GENE CHIP MARKET, BY TYPES, 2008 ¢ 2015 (UNIT SHIPMENTS)
TABLE 91 JAPAN: DNA & GENE CHIP MARKET, BY REVENUE, BY APPLICATIONS, 2008 ¢ 2015 ($THOUSAND)
TABLE 92 JAPAN: DNA & GENE CHIP MARKET, BY APPLICATIONS, 2008 ¢ 2015 (UNIT SHIPMENTS)
TABLE 93 SOUTH KOREA: DNA & GENE CHIP MARKET, BY REVENUE, BY TYPES, 2008 ¢ 2015 ($THOUSAND)
TABLE 94 SOUTH KOREA: DNA & GENE CHIP MARKET, BY TYPES, 2008 ¢ 2015 (UNIT SHIPMENTS)
TABLE 95 SOUTH KOREA: DNA & GENE CHIP MARKET, BY REVENUE, BY APPLICATIONS, 2008 ¢ 2015 ($THOUSAND)
TABLE 96 SOUTH KOREA: DNA & GENE CHIP MARKET, BY APPLICATIONS, 2008 ¢ 2015 (UNIT SHIPMENTS)
TABLE 97 ROW: DNA & GENE CHIP MARKET, BY REVENUE, BY TYPES, 2008 ¢ 2015 ($THOUSAND)
TABLE 98 ROW: DNA & GENE CHIP MARKET, BY TYPES, 2008 ¢ 2015 (UNIT SHIPMENTS)
TABLE 99 ROW: DNA & GENE CHIP MARKET, BY REVENUE, BY APPLICATIONS, 2008 ¢ 2015 ($THOUSAND)
TABLE 100 ROW: DNA & GENE CHIP MARKET, BY APPLICATIONS, 2008 ¢ 2015 (UNIT SHIPMENTS)
TABLE 101 NEW PRODUCT LAUNCHES
TABLE 102 MERGERS & ACQUISITIONS
TABLE 103 AGREEMENTS & COLLABORATIONS
TABLE 104 PARTNERSHIPS
TABLE 105 APPROVALS
TABLE 106 EXPANSIONS
TABLE 107 AFFYMETRIX INC: TOTAL REVENUES & R&D EXPENSES ($MILLION)
TABLE 108 AFFYMETRIX INC: TOTAL REVENUES, BY GEOGRAPHY ($MILLION)
TABLE 109 AFFYMETRIX INC: TOTAL REVENUES, BY SEGMENTS ($MILLION)
TABLE 110 AGILENT TECHNOLOGIES: TOTAL REVENUES & R&D EXPENSES ($MILLION)
TABLE 111 AGILENT TECHNOLOGIES: TOTAL REVENUES, BY GEOGRAPHY ($MILLION)
TABLE 112 AGILENT TECHNOLOGIES: TOTAL REVENUES, BY SEGMENTS ($MILLION)
TABLE 113 BIOM╔RIEUX SA: TOTAL REVENUES & R&D EXPENSES ($MILLION)
TABLE 114 BIONEER CORP: TOTAL REVENUES & R&D EXPENSES ($MILLION)
TABLE 115 BIONEER CORP: TOTAL REVENUES, BY SEGMENTS ($MILLION)
TABLE 116 ILLUMINA INC: TOTAL REVENUES & R&D EXPENSE FOR FISCAL YEAR ENDED ($THOUSAND)
TABLE 117 ILLUMINA INC: TOTAL REVENUES, BY GEOGRAPHY ($THOUSAND)
TABLE 118 ILLUMINA INC: TOTAL REVENUES, BY SEGMENTS ($THOUSAND)
TABLE 119 LIFE TECHNOLOGIES CORP: TOTAL REVENUES & R&D EXPENSES ($MILLION)
TABLE 120 LIFE TECHNOLOGIES CORP: TOTAL REVENUES, BY GEOGRAPHY ($THOUSAND)
TABLE 121 LIFE TECHNOLOGIES CORP: TOTAL REVENUES, BY SEGMENTS ($MILLION)
TABLE 122 NGK INSULATORS LTD: TOTAL REVENUES & R&D EXPENSES ($THOUSAND)
TABLE 123 NGK INSULATORS LTD: TOTAL REVENUES, BY GEOGRAPHY ($MILLION)
TABLE 124 NGK INSULATORS LTD: TOTAL REVENUES, BY SEGMENTS ($MILLION)
TABLE 125 PERKINELMER: TOTAL REVENUES & R&D EXPENSES ($MILLION)
TABLE 126 PERKINELMER: TOTAL REVENUES, BY GEOGRAPHY ($MILLION)
TABLE 127 PERKINELMER: TOTAL REVENUES, BY SEGMENTS ($MILLION)
TABLE 128 SEQUENOM INC: TOTAL REVENUES & R&D EXPENSES ($THOUSAND)
TABLE 129 SEQUENOM INC: TOTAL REVENUES, BY GEOGRAPHY ($MILLION)
TABLE 130 SEQUENOM INC: TOTAL REVENUES, BY SEGMENTS ($MILLION)
TABLE 131 SIGMA-ALDRICH: TOTAL REVENUES & R&D EXPENSES ($MILLION)
TABLE 132 SIGMA-ALDRICH: TOTAL REVENUES, BY GEOGRAPHY ($MILLION)
TABLE 133 SURMODICS INC: TOTAL REVENUE ($THOUSAND)
TABLE 134 TOSHIBA CORP: TOTAL REVENUES & R&D EXPENSES ($BILLION)
TABLE 135 TOSHIBA CORP: TOTAL REVENUES, BY GEOGRAPHY ($BILLION)
TABLE 136 TOSHIBA CORP: TOTAL REVENUES, BY SEGMENTS ($BILLION)
TABLE 137 WAFERGEN BIOSYSTEMS: TOTAL REVENUES & R&D EXPENSES ($THOUSAND)
TABLE 138 ARRAYIT CORP: TOTAL REVENUES & R&D EXPENSES ($THOUSAND) TABLE 139 ARRAYIT CORP: TOTAL REVENUES, BY SEGMENTS ($THOUSAND)
TABLE 140 CANON INC: TOTAL REVENUES & R&D EXPENSES ($MILLION)
TABLE 141 CANON INC: TOTAL REVENUES, BY GEOGRAPHY ($MILLION)
TABLE 142 CANON INC: TOTAL REVENUES, BY SEGMENTS ($MILLION)
TABLE 143 HITACHI LTD: TOTAL REVENUES & R&D EXPENSES ($MILLION)
TABLE 144 HITACHI LTD: TOTAL REVENUES, BY GEOGRAPHY ($MILLION)
TABLE 145 HITACHI LTD: TOTAL REVENUES, BY SEGMENTS ($MILLION)
TABLE 146 EXIQON: TOTAL REVENUES & R&D EXPENSES ($THOUSAND)
TABLE 147 EXIQON: TOTAL REVENUES, BY GEOGRAPHY ($THOUSAND)
TABLE 148 EXIQON A/S: TOTAL REVENUES, BY SEGMENTS ($THOUSAND)
TABLE 149 SAMSUNG ELECTRONICS CO LTD: TOTAL REVENUES & R&D EXPENSES $MILLION)
TABLE 150 SAMSUNG ELECTRONICS CO LTD: TOTAL REVENUES, BY GEOGRAPHY ($MILLION)
TABLE 151 SAMSUNG ELECTRONICS CO LTD: TOTAL REVENUES, BY SEGMENTS ($MILLION)
TABLE 152 THERMO FISHER SCIENTIFIC INC: TOTAL REVENUES & R&D EXPENSES ($MILLION)
TABLE 153 THERMO FISHER SCIENTIFIC INC: TOTAL REVENUES, BY GEOGRAPHY ($MILLION)
TABLE 154 THERMO FISHER SCIENTIFIC INC: TOTAL REVENUES, BY SEGMENTS ($MILLION)
LIST OF FIGURES
FIGURE 1 GLOBAL DNA & GENE CHIP MARKET 2010 ($MILLION)
FIGURE 2 DNA MICROARRAY MILESTONES
FIGURE 3 MICROFLUIDICS CHIP
FIGURE 4 PATENT ANALYSIS BY ASSIGNEE
FIGURE 5 COMPOSITION OF END-USER (2010 & 2015)
FIGURE 6 MARKET SHARE ANALYSIS (2009)
FIGURE 7 DNA MICROARRAY MARKET SEGMENTATION
FIGURE 8 ODNA MICROARRAY
FIGURE 9 CDNA MICROARRAY
FIGURE 10 MAJOR GROWTH STRATEGIES IN DNA & GENE CHIP MARKET (JANUARY 2008 ¢ MARCH 2011)

 Generating Response ...


Growth opportunities and latent adjacency in Global DNA and Gene Chip (Microarrays) Market