Forage Analysis Market by Target (Nutrients (Vitamins, Minerals, Crude Protein, Fiber, and TDN), Dry Matter, and Mycotoxin)), Livestock (Cattle, Equine, and Sheep), Forage (Ration, Hay, and Silage), Method (Wet Chemistry and NIRs), and Region - Global Forecast to 2023
[121 Pages Report] The global forage analysis market was valued at USD 494.4 million in 2017; this is projected to grow at a CAGR of 5.1% from 2018, to reach USD 661.1 million by 2023. The objectives of the report are to define, segment, and estimate the size of the global market. Furthermore, the market has been segmented on the basis of forage type, target, livestock, method, and region. The report also aims to provide detailed information about the crucial factors influencing the growth of the market, strategical analysis of the micro markets, opportunities for stakeholders, details of the competitive landscape, and the profiles of the key players with respect to their market share and competencies.

For More details on this research, Request Free Sample Report
The years considered for the study are as follows:
- Base year: 2017
- Estimated year: 2018
- Forecast period: 2018–2023
Research Methodology
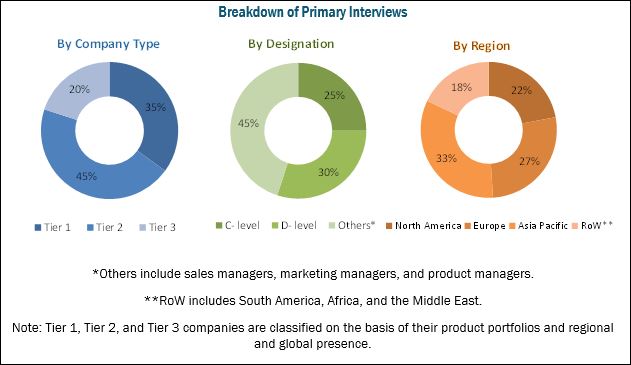
This research study involved the extensive use of secondary sources which included directories and databases such as Hoovers, Forbes, Bloomberg Businessweek, and Factiva to identify and collect information useful for the technical, market-oriented, and commercial study of the forage analysis market. The primary sources that were involved include industry experts from core and related industries and preferred suppliers, dealers, manufacturers, alliances, standards & certification organizations from companies, and organizations related to all segments of this industry’s value chain. In-depth interviews were conducted with various primary respondents such as key industry participants, subject matter experts, C-level executives of key market players, and industry consultants to obtain and verify critical qualitative and quantitative information as well as to assess future prospects. The following figure depicts the market research methodology applied in drafting this report on the forage analysis market.

To know about the assumptions considered for the study, download the pdf brochure
The key manufacturers in the forage analysis market include SGS (Switzerland), Eurofins Scientific (Luxembourg), Cargill (US), Intertek (UK), and CVAS (US). These companies have diversified product portfolios and advanced technologies for forage analysis at major strategic locations. Other companies include RJ Hill Laboratories (New Zealand), Dodson & Horrell (UK), Cawood Scientific (UK), Servi-Tech (US), DairyLand Laboratories (US), Dairy One (US), Minnesota Valley Testing Laboratories (US), and Massey Feeds (UK).
The stakeholders for the forage analysis market are mentioned below:
- Forage manufacturers, processors, and suppliers
- Agriculture and farming industry
- Raw material suppliers
- Animal husbandry, health, and nutrition organization
- Forage testing, feed testing, inspection, and certification laboratories
- Feed safety agencies
- Government and research organizations
-
Associations and industry bodies:
- The Food and Drug Administration (FDA)
- The European Food Safety Agency (EFSA)
Scope of the forage analysis market report
On the basis of Target, the market has been segmented into the following:
-
Nutrients
- Vitamins
- Minerals
- Fibers
- Crude Protein
- Total digestible nutrients
- Mycotoxins
- Dry Matter
- Others (pathogens and pesticides)
On the basis of Forage type, the market has been segmented into the following:
- Hay
- Silage
-
Ration
- Legume
- Grass
- Others (mixed legume-grass, legume mix, and grass mix)
On the basis of Livestock, the forage analysis market has been segmented into the following:
- Cattle
- Equine
- Sheep
On the basis of Method, the market has been segmented into the following:
- Physical method
- Chemical method
- Wet chemistry
- NIRs
On the basis of Region, the market has been segmented into the following:
- North America
- Europe
- Asia Pacific
- Rest of the World (South America, the Middle East, and Africa)
Available Customizations
With the given market data, MarketsandMarkets offers customizations according to client-specific needs.
The following customization options are available for the report:
Product Analysis
- Product Analysis, which gives a detailed comparison of the product portfolios of each company
Geographic Analysis
- Further breakdown of the Rest of Asia Pacific forage analysis market into Indonesia, Malaysia, Thailand, and the Philippines.
Company Information
- Detailed analysis and profiling of additional market players (up to five)
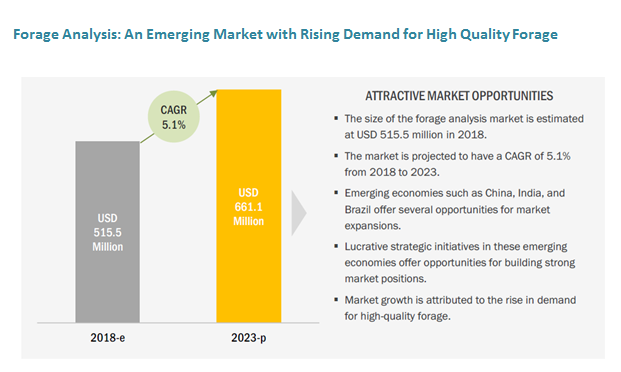
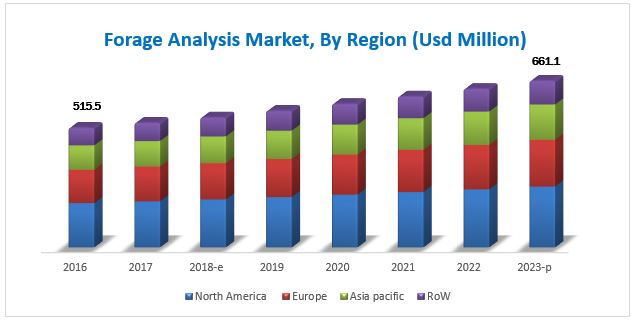
The forage analysis market is projected to reach USD 661.1 million by 2023, from USD 515.5 million in 2018, growing at a CAGR of 5.1%. The major driving factor for forage analysis is the rise in demand for high-quality forage, mandatory analysis of feed quality, and safety among farmers and manufacturers for the growth and development of livestock.
Based on the forage type, the market has been segmented into hay, silage, and ration. The ration segment dominated the market in 2018, and this trend is projected to continue through the forecast period from 2018 to 2023. Ration is the most frequently used forage for in-house dairy cows and equine. A healthy ration should be highly rich in proteins, minerals, vitamins, carbohydrates, and fat. Hence, it is important to analyze the nutrient level of ration.
On the basis of livestock, the forage analysis market has been segmented into cattle, equine, and sheep. The cattle segment dominated the global market in 2018. Cattle are the major source of end-use products such as milk and meat. Quality forage helps to improve forage conversion and absorption and strengthens the immune system of animals . Therefore, to attain quality livestock products, farmers and companies are focusing on forage analysis.
On the basis of target, the market has been segmented into nutrients, mycotoxins, dry matter, and others. The nutrients segment dominated the global market in 2018. Nutrients are essential, as they play an important role in optimizing the growth and performance of livestock. Different types of tests are performed to test the nutrient levels in forage. Therefore, manufacturers and farmers are increasingly conducting forage analysis in order to provide the required level of nutrients to livestock.
North America is projected to account for the largest share of the global forage analysis market by 2023 , owing to the presence of a large number of forage analysis laboratories and awareness regarding animal nutrition among farmers and forage manufacturers. The key players in the region are Cargill (US) and CVAS (US). Asia Pacific is projected to be the fastest-growing region in the global market during the forecast period, owing to the rising demand for quality dairy and meat products as well as the expansion of the forage industry in this region.

For more details on this research, Request Free Sample Report
However, lack of awareness among farmers and forage manufacturers in the developing countries are also some of the major factors restraining the growth of this market, globally. Developing regions, with the lack of infrastructure, do not offer a proper environment to conduct tests. Thus, lack of awareness, coupled with the rise in the price of the forage as a result of testing, is hindering the growth of the forage analysis market in countries such as India, Vietnam, and Kenya.
The key players in the global market include SGS (Switzerland), Eurofins Scientific (Luxembourg), Intertek (UK), Cargill (US), CVAS (US), RJ Hill Laboratories (New Zealand), Dodson & Horrell (UK), Cawood Scientific (UK), Servi-Tech (US), DairyLand Laboratories (US), Dairy One (US), Minnesota Valley Testing Laboratories (US) and Massey Feeds (UK).
To speak to our analyst for a discussion on the above findings, click Speak to Analyst

Table of Contents
1 Introduction (Page No. - 14)
1.1 Objectives of the Study
1.2 Market Definition
1.3 Market Scope
1.3.1 Periodization Considered
1.4 Currency Considered
1.5 Stakeholders
2 Research Methodology (Page No. - 18)
2.1 Research Data
2.1.1 Secondary Data
2.1.2 Primary Data
2.1.2.1 Breakdown of Primaries
2.2 Market Size Estimation
2.2.1 Bottom-Up Approach
2.2.2 Top-Down Approach
2.3 Data Triangulation
2.4 Research Assumptions & Limitations
2.4.1 Assumptions
2.4.2 Limitations
3 Executive Summary (Page No. - 24)
4 Premium Insights (Page No. - 28)
4.1 Attractive Opportunities in this Market
4.2 Market, By Key Countries
4.3 Market, By Forage Type, 2018–2023
4.4 Market, By Target & Region, 2017
4.5 Asia Pacific Forage Analysis Market, By Country & Livestock, 2017
5 Market Overview (Page No. - 32)
5.1 Introduction
5.2 Market Dynamics
5.2.1 Drivers
5.2.1.1 Rise in Demand for High-Quality Forage
5.2.1.2 Mandatory Analysis of Feed Quality & Safety
5.2.1.3 Outbreak of Livestock Diseases
5.2.1.4 Customized Testing Services Have Emerged as Cost- & Time-Effective Solutions
5.2.2 Restraints
5.2.2.1 Lack of Awareness Among Farmers and Forage Manufacturers
5.2.3 Opportunities
5.2.3.1 Emerging Markets and Untapped Regions Offer Potential Scope for Market Growth
5.2.3.2 Risk of Forage Contamination
5.2.4 Challenges
5.2.4.1 Lack of Basic Supporting Infrastructure
5.3 Organization/Regulatory Bodies Governing the Forage Analysis Market
5.3.1 Federal Food, Drug, and Cosmetic Act (FFDCA)
5.3.2 Center for Veterinary Medicine (CVM)
5.3.3 Regulation (EC) No. 1831/2003
5.3.4 Bureau of Indian Standards (BIS): Livestock Feeds, Equipment and Systems Sectional Committee (FAD5)
6 Forage Analysis Market, By Method (Page No. - 37)
6.1 Introduction
6.2 Physical Method
6.3 Chemical Method
6.3.1 Wet Chemistry
6.3.2 NIRS (Near-Infrared Reflective Spectroscopy)
7 Forage Analysis Market, By Target (Page No. - 39)
7.1 Introduction
7.2 Nutrients
7.2.1 Vitamins
7.2.2 Minerals
7.2.3 Fibers
7.2.4 Crude Protein
7.2.5 Total Digestible Nutrients
7.3 Mycotoxins
7.4 Dry Matter
7.5 Others
8 Forage Analysis Market, By Forage Type (Page No. - 48)
8.1 Introduction
8.2 Hay
8.3 Silage
8.4 Ration
8.4.1 Grass
8.4.2 Legumes
8.4.3 Others
9 Forage Analysis Market, By Livestock (Page No. - 55)
9.1 Introduction
9.2 Cattle
9.3 Equine
9.4 Sheep
10 Forage Analysis Market, By Region (Page No. - 60)
10.1 Introduction
10.2 North America
10.2.1 US
10.2.2 Canada
10.2.3 Mexico
10.3 Europe
10.3.1 Germany
10.3.2 France
10.3.3 UK
10.3.4 Italy
10.3.5 Spain
10.3.6 Rest of Europe
10.4 Asia Pacific
10.4.1 China
10.4.2 India
10.4.3 Japan
10.4.4 Rest of Asia Pacific
10.5 Rest of the World (RoW)
10.5.1 South America
10.5.2 The Middle East
10.5.3 Africa
11 Competitive Landscape (Page No. - 85)
11.1 Overview
11.2 Key Strategies
11.3 Market Ranking
11.4 Competitive Scenario
11.4.1 Expansions
11.4.2 Acquisitions
11.4.3 Collaborations, Agreements, and Partnerships
11.4.4 New Product/Service Launch
12 Company Profiles (Page No. - 91)
(Business Overview, Services Offered, Recent Developments, SWOT Analysis & MnM View)*
12.1 SGS
12.2 Eurofins Scientific
12.3 Intertek
12.4 Cargill
12.5 CVAS
12.6 R J Hill Laboratories
12.7 Dodson & Horrell
12.8 Cawood Scientific
12.9 Servi-Tech
12.10 Dairyland Laboratories
12.11 Dairy One
12.12 Minnesota Valley Testing Laboratories
12.13 Massey Feeds
*Details on Business Overview, Services Offered, Recent Developments, SWOT Analysis & MnM View Might Not Be Captured in Case of Unlisted Companies.
13 Appendix (Page No. - 115)
13.1 Discussion Guide
13.2 Knowledge Store: Marketsandmarkets’ Subscription Portal
13.3 Available Customizations
13.4 Related Reports
13.5 Author Details
List of Tables (69 Tables)
Table 1 USD Exchange Rates Considered for the Study, 2015–2017
Table 2 Forage Analysis Market Size, By Target, 2016–2023 (USD Million)
Table 3 Nutrients: Forage Analysis Market Size, By Type, 2016–2023 (USD Million)
Table 4 Nutrients: Market Size , By Region, 2016–2023 (USD Million)
Table 5 Vitamins: Forage Analysis Market Size, By Region, 2016–2023 (USD Million)
Table 6 Minerals: Forage Analysis Market Size , By Region, 2016–2023 (USD Million)
Table 7 Fiber: Forage Analysis Market Size, By Region, 2016–2023 (USD Million)
Table 8 Crude Protein: Forage Analysis Market Size, By Region, 2016–2023 (USD Million)
Table 9 Total Digestible Nutrients: Forage Analysis Market Size, By Region, 2016–2023 (USD Million)
Table 10 Mycotoxins: Forage Analysis Market Size, By Region, 2016–2023 (USD Million)
Table 11 Dry Matter: Forage Analysis Market Size, By Region, 2016–2023 (USD Million)
Table 12 Other Targets: Forage Analysis Market Size, By Region, 2016–2023 (USD Million)
Table 13 Forage Analysis Market Size, By Forage Type, 2016–2023 (USD Million)
Table 14 Market Size, By Ration Type, 2016–2023 (USD Million)
Table 15 Hay Forage Analysis Market Size, By Region, 2016–2023 (USD Million)
Table 16 Silage Forage Analysis Market Size, By Region, 2016–2023 (USD Million)
Table 17 Ration Forage Analysis Market Size, By Region, 2016–2023 (USD Million)
Table 18 Grass Ration Analysis Market Size, By Region, 2016–2023 (USD Million)
Table 19 Legume Ration Market Size, By Region, 2016–2023 (USD Million)
Table 20 Other Ration Forage Analysis Market Size, By Region, 2016–2023 (USD Million)
Table 21 Forage Analysis Market Size, By Livestock, 2016–2023 (USD Million)
Table 22 Cattle: Forage Analysis Market Size, By Region, 2016–2023 (USD Million)
Table 23 Equine: Forage Analysis Market Size, By Region, 2016–2023 (USD Million)
Table 24 Sheep: Forage Analysis Market Size, By Region, 2016–2023 (USD Million)
Table 25 Forage Analysis Market Size, By Region, 2016–2023 (USD Million)
Table 26 North America: Forage Analysis Market Size, By Country, 2016–2023 (USD Million)
Table 27 North America: Market Size, By Livestock, 2016–2023 (USD Million)
Table 28 North America: Market Size, By Target, 2016–2023 (USD Million)
Table 29 North America: Forage Nutrient Analysis Market Size, By Type, 2016–2023 (USD Million)
Table 30 North America: Forage Analysis Market Size, By Forage Type, 2016–2023 (USD Million)
Table 31 North America: Forage Ration Analysis Market Size, By Ration Type, 2016–2023 (USD Million)
Table 32 US: Forage Analysis Market Size, By Livestock, 2016–2023 (USD Million)
Table 33 Canada: Forage Analysis Market Size, By Livestock, 2016–2023 (USD Million)
Table 34 Mexico: Forage Analysis Market Size, By Livestock, 2016–2023 (USD Million)
Table 35 Europe: Forage Analysis Market Size, By Country, 2016–2023 (USD Million)
Table 36 Europe: Market Size, By Livestock, 2016–2023 (USD Million)
Table 37 Europe: Market Size, By Target, 2016–2023 (USD Million)
Table 38 Europe: Forage Nutrient Analysis Market Size, By Type, 2016–2023 (USD Million)
Table 39 Europe: Forage Analysis Market Size, By Forage Type, 2016–2023 (USD Million)
Table 40 Europe: Forage Ration Analysis Market Size, By Ration Type, 2016–2023 (USD Million)
Table 41 Germany: Forage Analysis Market Size, By Livestock, 2016–2023 (USD Million)
Table 42 France: Forage Analysis Market Size, By Livestock, 2016–2023 (USD Million)
Table 43 UK: Forage Analysis Market Size, By Livestock, 2016–2023 (USD Million)
Table 44 Italy: Forage Analysis Market Size, By Livestock, 2016–2023 (USD Million)
Table 45 Spain: Forage Analysis Market Size, By Livestock, 2016–2023 (USD Million)
Table 46 Rest of Europe: Forage Analysis Market Size, By Livestock, 2016–2023 (USD Million)
Table 47 Asia Pacific: Forage Analysis Market Size, By Country, 2016–2023 (USD Million)
Table 48 Asia Pacific: Market Size, By Livestock, 2016–2023 (USD Million)
Table 49 Asia Pacific: Market Size, By Target, 2016–2023 (USD Million)
Table 50 Asia Pacific: Forage Nutrient Analysis Market Size, By Type, 2016–2023 (USD Million)
Table 51 Asia Pacific: Forage Analysis Market Size, By Forage Type, 2016–2023 (USD Million)
Table 52 Asia Pacific: Forage Ration Analysis Market Size, By Ration Type, 2016–2023 (USD Million)
Table 53 China: Forage Analysis Market Size, By Livestock, 2016–2023 (USD Million)
Table 54 India: Forage Analysis Market Size, By Livestock, 2016–2023 (USD Million)
Table 55 Japan: Forage Analysis Market Size, By Livestock, 2016–2023 (USD Million)
Table 56 Rest of Asia Pacific: Forage Analysis Market Size, By Livestock, 2016–2023 (USD Million)
Table 57 RoW: Forage Analysis Market Size, By Region, 2016–2023 (USD Million)
Table 58 RoW: Market Size, By Livestock, 2016–2023 (USD Million)
Table 59 RoW: Market Size, By Target, 2016–2023 (USD Million)
Table 60 RoW: Forage Nutrient Analysis Market Size, By Type, 2016–2023 (USD Million)
Table 61 RoW: Forage Analysis Market Size, By Forage Type, 2016–2023 (USD Million)
Table 62 RoW: Forage Ration Analysis Market Size, By Ration Type, 2016–2023 (USD Million)
Table 63 South America: Forage Analysis Market Size, By Livestock, 2016–2023 (USD Million)
Table 64 Middle East: Forage Analysis Market Size, By Livestock, 2016–2023 (USD Million)
Table 65 Africa: Forage Analysis Market Size, By Livestock, 2016–2023 (USD Million)
Table 66 Expansions, 2013–2018
Table 67 Acquisitions, 2013–2018
Table 68 Collaborations Agreements, and Partnerships, 2013–2018
Table 69 New Product/Service Launches, 2013–2018
List of Figures (35 Figures)
Figure 1 Market Segmentation
Figure 2 Geographic Scope
Figure 3 Research Design
Figure 4 Market Size Estimation Methodology: Bottom-Up Approach
Figure 5 Market Size Estimation Methodology: Top-Down Approach
Figure 6 Data Triangulation
Figure 7 Forage Analysis Market Snapshot, By Livestock, 2018 vs 2023 (USD Million)
Figure 8 Market Snapshot, By Target, 2018 vs 2023 (USD Million)
Figure 9 Market Snapshot, By Forage Type, 2018 vs 2023 (USD Million)
Figure 10 Forage Analysis Market Size, By Region, 2017
Figure 11 Forage Analysis: an Emerging Market With Rising Demand for High Quality Forage
Figure 12 Geographic Snapshots: New Hotspots Emerging in Asia Pacific, 2018–2023
Figure 13 Ration Segment Grow at the Highest Rate
Figure 14 Nutrients Segment Accounted for the Largest Share Across All Regions in 2017
Figure 15 China Was the Largest Market for Forage Analysis in the Asia Pacific Region in 2017
Figure 16 Forage Analysis Market Dynamics
Figure 17 Nutrients Segment to Dominate the Forage Analysis Market From 2018 to 2023
Figure 18 Ration is Projected to Be the Largest Segment During the Forecast Period
Figure 19 Cattle Accounted for the Largest Market Share
Figure 20 Forage Analysis Market Size, By Region, 2018 vs 2023 (USD Million)
Figure 21 North America Forage Analysis Market Snapshot
Figure 22 Key Strategies Adopted By Leading Players in the Forage Analysis Market Between 2013 and 2018
Figure 23 Forage Analysis Market Developments, By Growth Strategy, 2013–2018
Figure 24 Top Five Companies in this Market, 2017
Figure 25 Key Growth Strategies Adopted By Major Companies, 2013–2018
Figure 26 SGS: Company Snapshot
Figure 27 SGS: SWOT Analysis
Figure 28 Eurofins Scientific: Company Snapshot
Figure 29 Eurofins Scientific: SWOT Analysis
Figure 30 Intertek: Company Snapshot
Figure 31 Intertek: SWOT Analysis
Figure 32 Cargill: Company Snapshot
Figure 33 Cargill: SWOT Analysis
Figure 34 CVAS: SWOT Analysis
Figure 35 RJ Hill Laboratories: SWOT Analysis


Growth opportunities and latent adjacency in Forage Analysis Market