Foam Tape Market by Resin (Acrylic, Rubber, Silicone), Technology (Solvent, Water, Hot-Melt), Type (PE, PU, Acrylic), End-Use Industry (Automotive, Building & Construction, Electrical & Electronics, Paper & Printing), and Region - Global Forecast to 2023


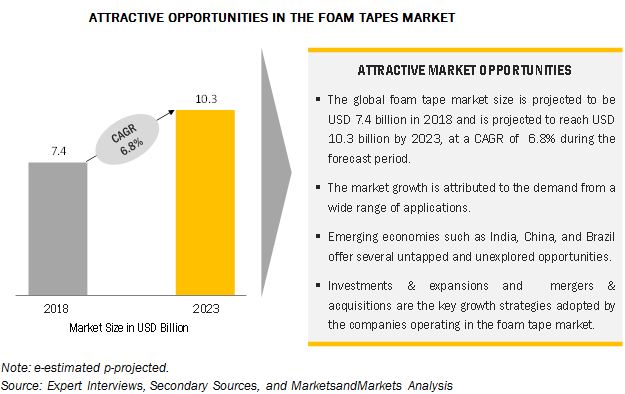
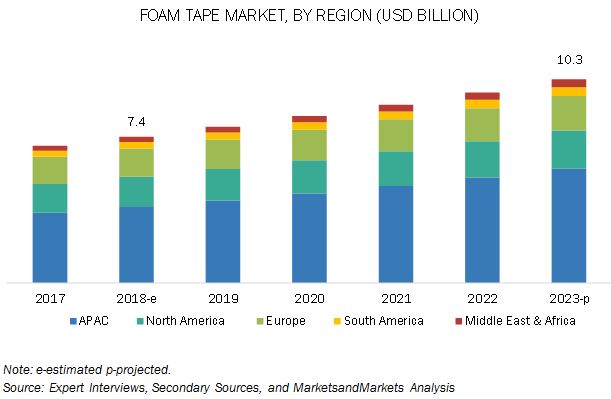
[151 Pages Report] The foam tape market is projected to grow from USD 7.4 billion in 2018 to USD 10.3 billion by 2023, at a CAGR of 6.8% between 2018 and 2023. The rising demand for foam tape across various end-use industries such as electrical & electronics, building & construction, automotive, and paper & printing is expected to drive the foam tape market. The increasing environmental concerns and the growing number of regulatory policies have propelled the manufacturers of foam tape to focus on the development of eco-friendly products. Volatile raw materials prices are acting as a restraint to the growth of the foam tape market. The rising costs of foam types such as acrylic and PE across the globe are affecting the foam tape market. Most of the raw materials used in the development of foam tape are petroleum-based derivatives that are vulnerable to fluctuations in commodity prices.
Automotive is expected to be the largest end-use industry of foam tape during the forecast period
Automotive is expected to be the leading end-use industry of foam tape during the forecast period, in terms of volume. In the automotive industry, foam tape -is used in plate panels, roof molding, outer belt moldings, rocker panel/claddings, emblem & nameplates, rear spoilers, body & bumper side moldings, side mirrors, and side fenders/wheel flares.
Acrylic resin-based foam tape accounted for the largest share of the foam tape market
The demand for acrylic resin-based foam tape is increasing across all the regions, as it has higher tack and peel adhesion than silicone. It also has excellent cohesion and humidity resistance, which makes it suitable for use in various environmental conditions. The price of acrylic resin-based foam tapes is also lower than the other types. It is widely used in the medical and automotive industries, owing to its excellent adhesion properties.
Solvent-based technology was the dominating segment of the foam tape market
The solvent-based technology was the largest segment of the foam tape market, as it offers extraordinary chemical resistance. The solvent-based technology is used when properties such as high tensile strength, durability, and peel and shear strength are required in foam tapes. In addition, solvent-based foam tapes offer durability and can withstand a high range of temperature, which makes them suitable for a wide range of applications.
Polyethylene (PE) accounted to be the largest segment of the foam tape market
There is a high demand for PE-backed foam tape is from applications which require tapes to offer properties such as gap filling between two surfaces that are being bonded. PE-backed foam tape also offers properties such as sound and vibration reduction and shock absorption. This growth is attributed to its use in a wide variety of applications in the automotive and building & construction industries, which are growing rapidly in the APAC region, owing to the increase in private and public investments, growing population, and focus on renewable energy sector.
APAC is expected to lead the foam tape market during the forecast period.
The APAC region is projected to lead the foam tape market during the forecast period, in terms of volume. The economic growth of the emerging countries such as China, India, Taiwan, Indonesia, Vietnam, and Malaysia, is expected to drive the demand for foam tape in the region. China is expected to lead the foam tape market in the APAC region. Factors such as increasing automotive production, availability of cheap labor and raw materials, low taxes, and less stringent environmental regulations are driving the foam tape market in China.
The increasing use of foam tape in various industries and the high demand from the APAC region are the key drivers for the foam tape market, whereas, the higher prices of raw materials and final products are a major restraint. The advancements in manufacturing technology and end-products offer opportunities to the foam tape manufacturers.
Market Dynamics
Drivers
Wide usage of foam tape in various industries
The automotive and building & construction industries are the major consumers of foam tape. The trend of using lightweight vehicles and electronic devices in vehicles is increasing, which is driving the foam tape market. In automobiles, foam tape is widely used in the automotive badge and script mounting, automotive trim attachment, and bonding dissimilar materials. Building & construction is also one of the key end-use industries of foam tape, especially in APAC, South America, and the Middle East. Foam tape is also widely used for HVAC, glazing, abatement, and insulation applications in the building & construction industry.
Restraint
Higher prices of raw materials and end-products
The raw materials used in foam tape include PE, PU, acrylic, nitrile, EVA, release liners, adhesives, and refined petroleum products. Most of these raw materials are petroleum-based derivatives and are vulnerable to the fluctuations in crude oil prices. The prices of raw materials such as adhesives, backing materials, and release liners are increased by converters and manufacturers such as Henkel, 3M, H.B. Fuller, and Sika AG, which result in higher prices of foam tape.
The rise in the price of foam tape products for end users such as automotive and building & construction industries affect the market, globally. According to H.B Fuller, since 2017, the adhesives prices have increased due to a continuous increase in the prices of raw materials, logistics, and labor; inflationary pressures in Europe; and skilled labor shortages. In addition, strict regulatory and environmental actions by the governments in China and Japan regarding the use of solvent-based technology have forced foam tape manufacturers to increase the final product prices.
Opportunity
Advancement in manufacturing technology and end-products
The demand for biodegradable and eco-friendly foam has increased in the past few years due to stringent environmental regulations and consumer preference. The innovation of hot-melt-based and UV hot-melt-based technologies enables foam tape manufacturers or converters to coat the tapes on PE, PU, and acrylic foam types without any release of solvents or water. The shift toward hot-melt-based and UV hot-melt-based technologies is increasing, especially in APAC. Innovations such as curable foam tape (UV and EB or both rubber and acrylic systems) are intended more for specialty tapes. All these factors are providing opportunities to the market players for manufacturing innovative products for various applications.
Ongoing product developments by various companies to manufacture high-performance and cost-efficient foam tapes is expected to drive the demand in the industries such as automotive, aerospace, solar power, and wind power during the forecast period.
Challenge
Implementation of stringent regulatory policies
The chemical industry is facing challenges from regulatory authorities such as COSHH EU, REACH, GHS, and EPA in Europe and North America. The manufacturers in these regions are following these regulations regarding the production as well as the use of foam tape in various applications to reduce VOC emissions. This has affected their manufacturing of foam tape through the solvent-based technology. The regulations require them to shift from solvent-based to water-based technology, which is a big challenge for the manufacturers.
Scope of the Report
|
Report Metric
|
Details |
|
Years considered for the study |
2016–2023 |
|
Base year |
2017 |
|
Forecast period |
2018–2023 |
|
Units considered |
Value (USD Billion) and Volume (MSM) |
|
Segments |
Resin Type, Technology, Foam Type, Tape type and End-use Industry |
|
Regions |
North America, Europe, Asia Pacific, South America, and Middle East & Africa |
|
Companies |
3M Company , Nitto Denko Corporation, Tesa SE, Avery Dennison, Intertape Polymer Group, Lintec Corporation |
This research report categorizes the foam tapes market based on resin type, technology, foam type, end-use industry, and region.
Foam Tape Market, By Resin Type:
- Acrylic
- Rubber
- Silicone
- Others (EVA and Polyurethane)
Foam Tape Market, By Technology:
- Solvent-based
- Water-based
- Hot-melt-based
Foam Tape Market, By Foam Type:
- PE backed
- PU backed
- Acrylic backed
- Others (Nitrile, EVA, Rubber, Polyester, Polyether, PVC, and Vinyl)
Foam Tape Market, By End-use Industry:
- Automotive
- Building & Construction
- Electrical & Electronics
- Paper & Printing
- Others (Packaging, Aerospace & Defense, Healthcare, Woodworking, Wind energy, Solar energy, and Sports)
Foam Tape Market, By Type:
- Single Sided foam tape
- Double Sided foam tape
Foam Tape Market, By Region:
- APAC
- Europe
- North America
- South America
- Middle East & Africa
The market is further analyzed for key countries in each of these regions.
Leading Players
3M Company offers a broad range of products, including foam tape, bonding materials, coatings, and specialty materials. The company operates through five business segments, namely, industrial, safety & graphics, electronics & energy, healthcare, and consumer. The company manufactures foam tapes for varied applications through its industrial and consumer segments.
The company has production sites in 65 countries around the world and offers products and solutions to customers in about 200 countries in the Americas, APAC, Europe, and the Middle East & Africa. With its foam tape business, 3M is getting stronger in terms of product width and depth. Its products in the industrial tapes segment have global brand recognition. The company has adopted organic and inorganic strategies such as investments & expansions and acquisitions to lead the foam tape business. This will contribute to its sales and help it expand the business.
Nitto Denko Corporation manufactures and sells foam tape, optical films, semiconductor devices, and electronic and medical products. The company operates through three segments, namely, optronics, industrial tape, and life science. The industrial tape segment provides products for bonding substrates such as plastic, metal, glass, wood, and others. The industrial tape segment provides foam tape for use in the medical sector.
Nitto Denko has a strong customer base and operates in APAC, the Americas, EMEA (Europe, Middle East & Africa), East Asia, and Southeast Asia & Oceania. Over the next three years, the company plans to invest in emerging countries such as China and India. For the next fiscal year, the company, through its industrial tape segment, plans to focus on new business development for a broad range of sectors such as consumer goods, aerospace, healthcare, and so on. The company is expanding its presence in North America and Europe with an intention to strengthen its hold over the solvent-less foam tape markets in these regions.
Recent Developments
- In July 2016, 3M Company will invest USD 135 million in its Tuas Plant (Singapore) over the next 10.5 years. Through this expansion, the company will manufacture acrylic foam tapes (Scotch Tape) which will be used in industries such as healthcare, packaging, and electrical & electronics.
- In March 2016, Nitto Denko merged its three subsidiaries named Nitoms Inc., Nitto Medical Corporation, and Nitto Lifted Corporation. The purpose of the merger was to reinforce, manufacture, and sell solvent-less, foam tapes for various end-use industries such as healthcare, automotive, and others.
Key Questions Addressed by the Report
- What is the mid-to-long term impact of the developments undertaken in the industry?
- What are the upcoming technologies used in foam tapes industry?
- Which segment has the potential to register the highest market share?
- What is the current competitive landscape in the foam tapes market in terms of new technologies, production, and sales?
- What will be the growth prospects of the foam tapes market?
Available customizations
With the given market data, MarketsandMarkets offers customizations according to the company’s specific needs. The following customization options are available for the report:
Product Analysis
- Product Matrix, which gives a detailed comparison of product portfolio of each company
Country-wise Analysis
- Further breakdown of Rest of APAC foam tape market into Thailand, the Philippines, Malaysia, Myanmar, Australia, and New Zealand
- Further breakdown of Rest of Europe foam tape market into Switzerland, Greece, Hungary, Romania, Croatia, Bulgaria, Denmark, Finland, Norway, Austria, Norway, and Ukraine
To speak to our analyst for a discussion on the above findings, click Speak to Analyst
 Exclusive indicates content/data unique to MarketsandMarkets and not available with any competitors.
#####
Table of Contents
1 Introduction (Page No. - 14)
1.1 Objectives of the Study
1.2 Market Definition
1.3 Market Scope
1.3.1 Years Considered for the Study
1.4 Currency
1.5 Unit Considered
1.6 Stakeholders
2 Research Methodology (Page No. - 18)
2.1 Research Data
2.1.1 Secondary Data
2.1.1.1 Key Data From Secondary Sources
2.1.2 Primary Data
2.1.2.1 Key Data From Primary Sources
2.1.2.2 Key Industry Insights
2.1.2.3 Breakdown of Primary Interviews
2.2 Market Size Estimation
2.3 Data Triangulation
2.4 Assumptions
2.5 Limitations
3 Executive Summary (Page No. - 26)
4 Premium Insights (Page No. - 31)
4.1 Significant Opportunities in the Foam Tape Market
4.2 Foam Tape Market, By Resin Type
4.3 Foam Tape Market, By Technology
4.4 Foam Tape Market, By Foam Type
4.5 Foam Tape Market, By End-Use Industry
4.6 Foam Tape Market, Developed vs Developing Nations
4.7 Foam Tape Market in APAC, By End-Use Industry and Country
4.8 Foam Tape Market, By Region
5 Market Overview (Page No. - 36)
5.1 Introduction
5.2 Market Dynamics
5.2.1 Drivers
5.2.1.1 Wide Usage of Foam Tape in Various Industries
5.2.1.2 High Demand for Foam Tape in APAC
5.2.1.3 High Demand for Acrylic-Backed Foam Tape
5.2.2 Restraints
5.2.2.1 Higher Prices of Raw Materials and End-Products
5.2.3 Opportunities
5.2.3.1 Advancement in Manufacturing Technology and End-Products
5.2.3.2 Growing Demand for Acrylic-Backed Foam Tape in the Automotive Industry
5.2.4 Challenges
5.2.4.1 Implementation of Stringent Regulatory Policies
5.3 Porter’s Five Forces Analysis
5.3.1 Threat of New Entrants
5.3.2 Threat of Substitutes
5.3.3 Bargaining Power of Suppliers
5.3.4 Bargaining Power of Buyers
5.3.5 Intensity of Competitive Rivalry
6 Macroeconomic Indicators (Page No. - 42)
6.1 Introduction
6.2 Trends and Forecast of GDP
6.3 Trends in the Automotive Industry
6.4 Construction Industry Spending Worldwide, 2017–2025
6.5 Estimated Growth Rate for the Global Electrical & Electronics Industry, By Region, 2018–2022
7 Foam Tape Market, By Resin Type (Page No. - 47)
7.1 Introduction
7.2 Acrylic
7.3 Rubber
7.4 Silicone
7.5 Other Resin Types
7.5.1 EVA
7.5.2 Polyurethane
8 Foam Tape Market, By Technology (Page No. - 58)
8.1 Introduction
8.2 Solvent-Based Foam Tape
8.3 Water-Based Foam Tape
8.4 Hot-Melt-Based Foam Tape
9 Foam Tape Market, By Foam Type (Page No. - 64)
9.1 Introduction
9.2 PE-Backed Foam Tape
9.2.1 Types of PE-Backed Foam Tape
9.3 Pu-Backed Foam Tape
9.4 Acrylic-Backed Foam Tape
9.5 Others
9.5.1 Nitrile
9.5.1 EVA
9.5.1 Rubber
9.5.1 Polyester
9.5.1 PVC
9.5.1 Vinyl
10 Foam Tape Market, By End-Use Industry (Page No. - 72)
10.1 Introduction
10.1.1 Automotive
10.1.2 Building & Construction
10.1.3 Electrical & Electronics
10.1.4 Paper & Printing
10.1.5 Others
10.1.5.1 Packaging
10.1.5.2 Aerospace & Defense
10.1.5.3 Healthcare
10.1.5.4 Woodworking
10.1.5.5 Wind Energy
10.1.5.6 Solar Energy
10.1.5.7 Sports
11 Foam Tape Market, By Type
11.1 Introduction
11.2 Single Sided Foam Tape
11.3 Double Sided Foam Tape
12 Foam Tape Market, By Region (Page No. - 81)
12.1 Introduction
12.2 APAC
12.2.1 China
12.2.2 India
12.2.3 Japan
12.2.4 South Korea
12.2.5 Taiwan
12.2.6 Indonesia
12.2.7 Vietnam
12.2.8 Rest of APAC
12.3 North America
12.3.1 US
12.3.2 Canada
12.3.3 Mexico
12.4 Europe
12.4.1 Germany
12.4.2 France
12.4.3 Russia
12.4.4 Italy
12.4.5 Spain
12.4.6 UK
12.4.7 Turkey
12.4.8 Netherlands
12.4.9 Rest of Europe
12.5 South America
12.5.1 Brazil
12.5.2 Argentina
12.5.3 Colombia
12.5.4 Rest of South America
12.6 Middle East & Africa
12.6.1 South Africa
12.6.2 Saudi Arabia
12.6.3 Rest of Middle East & Africa
13 Competitive Landscape (Page No. - 119)
13.1 Overview
13.2 Competitive Scenario
12.2.1 Mergers & Acquisitions
13.3 Investments & Expansions
14 Company Profiles (Page No. - 122)
(Business Overview, Products Offered, Recent Developments, SWOT Analysis, MnM View)*
14.1 3M Company
14.2 Nitto Denko Corporation
14.3 TESA SE
14.4 Lintec Corporation
14.5 Avery Dennison Corporation
14.6 Intertape Polymer Group, Inc.
14.7 Scapa Group PLC
14.8 Lohmann GmbH & Co. Kg
14.9 3F
14.10 Halco
*Details on Business Overview, Products Offered, Recent Developments, SWOT Analysis, MnM View Might Not Be Captured in Case of Unlisted Companies.
14.11 Other Key Companies
14.11.1 Mactac, LLC
14.11.2 Adchem Corporation
14.11.3 CCT Tapes
14.11.4 Tape-Rite Co. Inc.
14.11.5 Ajit Industries
14.11.6 Adere
14.11.7 Adhere Industrial Tapes LTD
14.11.8 Guangzhou Broadya Adhesive Products Co.
14.11.9 Saint-Gobain Performance Plastics
14.11.10 A-SPE
14.11.11 AVX
15 Appendix (Page No. - 146)
15.1 Insights From Industry Experts
15.2 Discussion Guide
15.3 Available Customizations
15.4 Related Reports
15.5 Author Details
List of Tables (105 Tables)
Table 1 Major End-Use Industries and Applications Considered in the Study
Table 2 Foam Tape Market Snapshot, 2018 Vs.2023
Table 3 Major Players Profiled in This Report
Table 4 GDP Percentage Change of Key Countries, 2018–2023
Table 5 Automotive Production in Key Countries, 2016–2017 (Million Units)
Table 6 Characteristics of Resins Used in Foam Tape
Table 7 Foam Tape Market Size, By Resin Type, 2016–2023 (USD Million)
Table 8 Foam Tape Market Size, By Resin Type, 2016–2023 (Million Square Meter)
Table 9 Acrylic Resin-Based Foam Tape Market Size, By Region, 2016–2023 (USD Million)
Table 10 Acrylic Resin-Based Foam Tape Market Size, By Region, 2016–2023 (Million Square Meter)
Table 11 Rubber Resin–Based Foam Tape Market Size, By Region, 2016–2023 (USD Million)
Table 12 Rubber Resin–Based Foam Tape Market Size, By Region, 2016–2023 (Million Square Meter)
Table 13 Silicone Resin-Based Foam Tape Market Size, By Region, 2016–2023 (USD Million)
Table 14 Silicone Resin-Based Foam Tape Market Size, By Region, 2016–2023 (Million Square Meter)
Table 15 Other Resins-Based Foam Tape Market Size, By Region, 2016–2023 (USD Million)
Table 16 Other Resins-Based Foam Tape Market Size, By Region, 2016–2023 (Million Square Meter)
Table 17 Compatibility of Manufacturing Technologies With Resins Used in Foam Tape
Table 18 Foam Tape Market Size, By Technology, 2016–2023 (USD Million)
Table 19 Foam Tape Market Size, By Technology, 2016–2023 (Million Square Meter)
Table 20 Solvent-Based Foam Tape Market Size, By Region, 2016–2023 (USD Million)
Table 21 Solvent-Based Foam Tape Market Size, By Region, 2016–2023 (Million Square Meter)
Table 22 Water-Based Foam Tape Market Size, By Region, 2016–2023 (USD Million)
Table 23 Water-Based Foam Tape Market Size, By Region, 2016–2023 (Million Square Meter)
Table 24 Hot-Melt-Based Foam Tape Market Size, By Region, 2016–2023 (USD Million)
Table 25 Hot-Melt-Based Foam Tape Market Size, By Region, 2016–2023 (Million Square Meter)
Table 26 Foam Tape Market Size, By Foam Type, 2016–2023 (USD Million)
Table 27 Foam Tape Market Size, By Foam Type, 2016–2023 (Million Square Meter)
Table 28 PE-Backed Foam Tape Market Size, By Region, 2016–2023 (USD Million)
Table 29 PE-Backed Foam Tape Market Size, By Region, 2016–2023 (Million Square Meter)
Table 30 PE-Backed Foam Tape Market Size, By Type, 2016–2023 (USD Million)
Table 31 PE-Backed Foam Tape Market Size, By Type, 2016–2023 (Million Square Meter)
Table 32 Pu-Backed Foam Tape Market Size, By Region, 2016–2023 (USD Million)
Table 33 Pu-Backed Foam Tape Market Size, By Region, 2016–2023 (Million Square Meter)
Table 34 Acrylic-Backed Foam Tape Market Size, By Region, 2016–2023 (USD Million)
Table 35 Acrylic-Backed Foam Tape Market Size, By Region, 2016–2023 (Million Square Meter)
Table 36 Other Foam Tapes Market Size, By Region, 2016–2023 (USD Million)
Table 37 Other Foam Tapes Market Size, By Region, 2016–2023 (Million Square Meter)
Table 38 Foam Tape Market Size, By End-Use Industry, 2016–2023 (USD Million)
Table 39 Foam Tape Market Size, By End-Use Industry, 2016–2023 (Million Square Meter)
Table 40 Foam Tape Market Size in Automotive End-Use Industry, By Region, 2016–2023 (USD Million)
Table 41 Foam Tape Market Size in Automotive End-Use Industry, By Region, 2016–2023 (Million Square Meter)
Table 42 Foam Tape Market Size in Building & Construction End-Use Industry, By Region, 2016–2023 (USD Million)
Table 43 Foam Tape Market Size in Building & Construction End-Use Industry, By Region, 2016–2023 (Million Square Meter)
Table 44 Foam Tape Market Size in Electrical & Electronics End-Use Industry, By Region, 2016–2023 (USD Million)
Table 45 Foam Tape Market Size in Electrical & Electronics End-Use Industry, By Region, 2016–2023 (Million Square Meter)
Table 46 Foam Tape Market Size in Paper & Printing End-Use Industry, By Region, 2016–2023 (USD Million)
Table 47 Foam Tape Market Size in Paper & Printing End-Use Industry, By Region, 2016–2023 (Million Square Meter)
Table 48 Foam Tape Market Size in Other End-Use Industries, By Region, 2016–2023 (USD Million)
Table 49 Foam Tape Market Size in Other End-Use Industries, By Region, 2016–2023 (Million Square Meter)
Table 50 Foam Tape Market Size, By Region, 2016–2023 (USD Million)
Table 51 Foam Tape Market Size, By Region, 2016–2023 (Million Square Meter)
Table 52 Foam Tape Market Size, By Category, 2016–2023 (USD Million)
Table 53 Foam Tape Market Size, By Category, 2016–2023 (Million Square Meter)
Table 54 APAC: Foam Tape Market Size, By Country, 2016–2023 (USD Million)
Table 55 APAC: Foam Tape Market Size, By Country, 2016–2023 (Million Square Meter)
Table 56 APAC: Foam Tape Market Size, By Resin Type, 2016–2023 (USD Million)
Table 57 APAC: Foam Tape Market Size, By Resin Type, 2016–2023 (Million Square Meter)
Table 58 APAC: Foam Tape Market Size, By Technology, 2016–2023 (USD Million)
Table 59 APAC: Foam Tape Market Size, By Technology, 2016–2023 (Million Square Meter)
Table 60 APAC: Foam Tape Market Size, By Foam Type, 2016–2023 (USD Million)
Table 61 APAC: Foam Tape Market Size, By Foam Type, 2016–2023 (Million Square Meter)
Table 62 APAC: Foam Tape Market Size, By End-Use Industry, 2016–2023 (USD Million)
Table 63 APAC: Foam Tape Market Size, By End-Use Industry, 2016–2023 (Million Square Meter)
Table 64 North America: Foam Tape Market Size, By Country, 2016–2023 (USD Million)
Table 65 North America: Foam Tape Market Size, By Country, 2016–2023 (Million Square Meter)
Table 66 North America: Foam Tape Market Size, By Resin Type, 2016–2023 (USD Million)
Table 67 North America: Foam Tape Market Size, By Resin Type, 2016–2023 (Million Square Meter)
Table 68 North America: Foam Tape Market Size, By Technology, 2016–2023 (USD Million)
Table 69 North America: Foam Tape Market Size, By Technology, 2016–2023 (Million Square Meter)
Table 70 North America: Foam Tape Market Size, By Foam Type, 2016–2023 (USD Million)
Table 71 North America: Foam Tape Market Size, By Foam Type, 2016–2023 (Million Square Meter)
Table 72 North America: Foam Tape Market Size, By End-Use Industry, 2016–2023 (USD Million)
Table 73 North America: Foam Tape Market Size, By End-Use Industry, 2016–2023 (Million Square Meter)
Table 74 Europe: Foam Tape Market Size, By Country, 2016–2023 (USD Million)
Table 75 Europe: Foam Tape Market Size, By Country, 2016–2023 (Million Square Meter)
Table 76 Europe: Foam Tape Market Size, By Resin Type, 2016–2023 (USD Million)
Table 77 Europe: Foam Tape Market Size, By Resin Type, 2016–2023 (Million Square Meter)
Table 78 Europe: Foam Tape Market Size, By Technology, 2016–2023 (USD Million)
Table 79 Europe: Foam Tape Market Size, By Technology, 2016–2023 (Million Square Meter)
Table 80 Europe: Foam Tape Market Size, By Foam Type, 2016–2023 (USD Million)
Table 81 Europe: Foam Tape Market Size, By Foam Type, 2016–2023 (Million Square Meter)
Table 82 Europe: Foam Tape Market Size, By End-Use Industry, 2016–2023 (USD Million)
Table 83 Europe: Foam Tape Market Size, By End-Use Industry, 2016–2023 (Million Square Meter)
Table 84 South America: Foam Tape Market Size, By Country, 2016–2023 (USD Million)
Table 85 South America: Foam Tape Market Size, By Country, 2016–2023 (Million Square Meter)
Table 86 South America: Foam Tape Market Size, By Resin Type, 2016–2023 (USD Million)
Table 87 South America: Foam Tape Market Size, By Resin Type, 2016–2023 (Million Square Meter)
Table 88 South America: Foam Tape Market Size, By Technology, 2016–2023 (USD Million)
Table 89 South America: Foam Tape Market Size, By Technology, 2016–2023 (Million Square Meter)
Table 90 South America: Foam Tape Market Size, By Foam Type, 2016–2023 (USD Million)
Table 91 South America: Foam Tape Market Size, By Foam Type, 2016–2023 (Million Square Meter)
Table 92 South America: Foam Tape Market Size, By End-Use Industry, 2016–2023 (USD Million)
Table 93 South America: Foam Tape Market Size, By End-Use Industry, 2016–2023 (Million Square Meter)
Table 94 Middle East & Africa: Foam Tape Market Size, By Country, 2016–2023 (USD Million)
Table 95 Middle East & Africa: Foam Tape Market Size, By Country, 2016–2023 (Million Square Meter)
Table 96 Middle East & Africa: Foam Tape Market Size, By Resin Type, 2016–2023 (Million Square Meter)
Table 97 Middle East & Africa: Foam Tape Market Size, By Resin Type, 2016–2023 (Million Square Meter)
Table 98 Middle East & Africa: Foam Tape Market Size, By Technology, 2016–2023 (USD Million)
Table 99 Middle East & Africa: Foam Tape Market Size, By Technology, 2016–2023 (Million Square Meter)
Table 100 Middle East & Africa: Foam Tape Market Size, By Foam Type, 2016–2023 (USD Million)
Table 101 Middle East & Africa: Foam Tape Market Size, By Foam Type, 2016–2023 (Million Square Meter)
Table 102 Middle East & Africa: Foam Tape Market Size, By End-Use Industry, 2016–2023 (USD Million)
Table 103 Middle East & Africa: Foam Tape Market Size, By End-Use Industry, 2016–2023 (Million Square Meter)
Table 104 Mergers & Acquisitions, 2015–2018
Table 105 Investments & Expansions, 2015–2018
List of Figures (54 Figures)
Figure 1 Foam Tape Market Segmentation
Figure 2 Foam Tape Market: Research Design
Figure 3 Market Size Estimation: Bottom-Up Approach
Figure 4 Market Size Estimation: Top-Down Approach
Figure 5 Foam Tape Market: Data Triangulation
Figure 6 Silicone to Be the Fastest-Growing Resin Type for Foam Tape
Figure 7 Acrylic-Backed Foam Tape to Register the Highest CAGR
Figure 8 Hot-Melt-Based Technology to Register the Highest CAGR
Figure 9 Automotive End-Use Industry to Register the Highest CAGR
Figure 10 APAC to Be the Fastest-Growing Market for Foam Tape
Figure 11 Foam Tape Market to Witness Moderate Growth Between 2018 and 2023
Figure 12 Silicone to Be the Fastest-Growing Resin Type for Foam Tape
Figure 13 Hot-Melt-Based to Be the Fastest-Growing Technology for Foam Tape
Figure 14 Acrylic to Be the Fastest-Growing Foam Type Between 2018 and 2023
Figure 15 Automotive to Be the Largest End-Use Industry of Foam Tape
Figure 16 Developing Nations to Grow Faster Than Developed Nations Between 2018 and 2023
Figure 17 Automotive Was the Largest End-Use Industry of Foam Tape in APAC
Figure 18 APAC LED the Foam Tape Market in 2017
Figure 19 Overview of Factors Governing the Foam Tape Market
Figure 20 Growth in the Electrical & Electronics Industry, 2018–2022
Figure 21 Acrylic Resin-Based Foam Tape LED the Market in 2017
Figure 22 Types of Acrylic Resin
Figure 23 Properties of Modified Acrylic Resin-Based Foam Tape
Figure 24 Properties of Pure Acrylic Resin-Based Foam Tape
Figure 25 Types of Rubber Resin
Figure 26 Properties of Rubber Resin-Based Foam Tape
Figure 27 Types of Silicone Resin
Figure 28 Properties of Silicone Resin-Based Foam Tape
Figure 29 Solvent-Based Technology Was the Dominating Segment of the Foam Tape Market in 2017
Figure 30 PE Was the Largest Segment of the Foam Tape Market in 2017
Figure 31 Automotive to Be the Largest End-Use Industry of Foam Tape
Figure 32 India to Register the Highest CAGR in the Foam Tape Market
Figure 33 APAC to Emerge as A High-Growth Foam Tape Market for All Technologies
Figure 34 APAC to Emerge as A High-Growth Foam Tape Market for All Foam Types
Figure 35 APAC to Emerge as A High-Growth Foam Tape Market for All Resin Types
Figure 36 APAC to Drive the Foam Tape Market in All End-Use Industries
Figure 37 APAC Foam Tape Market Snapshot
Figure 38 North American Foam Tape Market Snapshot
Figure 39 Automotive Industry to Drive the Foam Tape Market in Europe
Figure 40 Increasing Demand From the Automotive Industry to Drive the South American Foam Tape Market
Figure 41 Automotive Industry to Drive the Foam Tape Market in the Middle East & Africa
Figure 42 Companies Adopted Merger & Acquisition as the Key Growth Strategy Between 2015 and 2018
Figure 43 3M Company: Company Snapshot
Figure 44 3M Company: SWOT Analysis
Figure 45 Nitto Denko Corporation: Company Snapshot
Figure 46 Nitto Denko Corporation: SWOT Analysis
Figure 47 TESA SE: Company Snapshot
Figure 48 TESA SE: SWOT Analysis
Figure 49 Lintec Corporation: Company Snapshot
Figure 50 Lintec: SWOT Analysis
Figure 51 Avery Dennison Corporation: Company Snapshot
Figure 52 Avery Dennison Corporation: SWOT Analysis
Figure 53 Intertape Polymer Group, Inc.: Company Snapshot
Figure 54 Scapa Group PLC: Company Snapshot


Growth opportunities and latent adjacency in Foam Tape Market