Floating LNG Power Vessel Market by Component (Power Generation System and Power Distribution System), Power Output (Up to 72 MW, 72 MW-400 MW, Above 400 MW), Vessel Type (Power Barge and Power Ship), and Region - Global Forecast to 2023


[113 Report Pages] The global floating LNG power vessel market was valued at USD 484.8 million in 2017 and is projected to reach USD 931.6 million by 2023, at a CAGR of 1.61% during the forecast period. The years considered for the study are as follows:
- Base Year: 2017
- Estimated Year: 2018
- Projected Year: 2023
- Forecast Period: 2018�2023
The base year considered for company profiles is 2017. Whenever information was unavailable for the base year, the previous year was considered.
Objectives of the Study
- To define and segment the floating LNG power vessel market by component, power output, vessel type, and region
- To provide detailed information about major factors influencing the growth of the market (drivers, restraints, opportunities, and industry-specific challenges)
- To strategically analyze the market with respect to individual growth trends, future expansions, and contributions to the market
- To analyze market opportunities for stakeholders and details of a competitive landscape for market leaders
- To forecast the growth of the market with respect to the major regions (Asia Pacific, the Middle East & Africa, North America, and RoW)
- To strategically profile key players and comprehensively analyze their market rankings and core competencies
- To analyze competitive developments such as new product development, mergers & acquisitions, expansions & investments, and contracts & agreements in the market
Research Methodology
This research study involved the use of extensive secondary sources, directories, journals on power generation technologies and other related rental markets, newsletters and databases such as Hoover�s, Bloomberg, Businessweek, and Factiva to identify and collect information useful for a technical, market-oriented, and commercial study of the global floating LNG power vessel market. The primary sources include several industry experts from the core and related industries, vendors, preferred suppliers, technology developers, alliances, and organizations related to all the segments of this industry�s value chain. The research methodology has been explained below.
- Study of annual revenues and market developments of major players in floating LNG power vessel
- Analysis of the major end-users and applications of floating LNG power vessel
- Assessment of future trends and growth of market on the basis of investments
- Study of contracts & developments related to the market by key players across different regions
- Finalization of the overall market size by triangulating the supply-side data, which includes product developments, supply chains, and annual revenues of companies manufacturing floating LNG power vessel across the globe
After arriving at the overall market size, the floating LNG power vessel market was split into several segments and subsegments. The figure given below illustrates the breakdown of primary interviews conducted during the research study on the basis of company type, designation, and region.
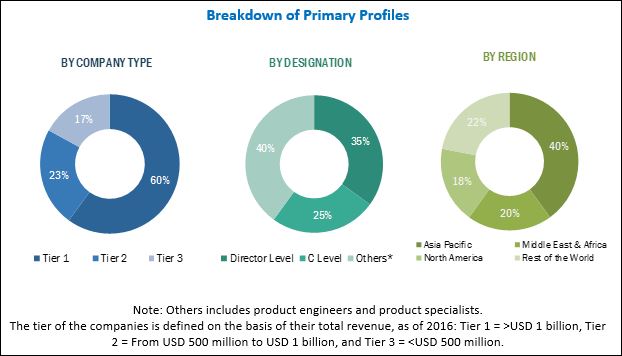
To know about the assumptions considered for the study, download the pdf brochure
The major players operating in the floating LNG power vessel market include Siemens AG (Germany), MAN Diesel & Turbo SE (Germany), W�rtsil� Corporation (Finland), General Electric Company (US), and Caterpillar Inc. (US).
Target Audience:
- Banks, venture capitalists, financial institutions, and other investors
- Consulting companies of the energy and power sector
- Electric utilities
- Electrical infrastructure providers
- Government and research organizations
- Industry, energy, and environmental associations
- Power distribution equipment manufacturers
- Power generation equipment manufacturers
- Public and private operators of power barges and power ships
Scope of the Report:
By Vessel Type
- Power Barge
- Power Ship
By Component
- Power Generation System
- Gas Turbine & IC Engine
- Steam Turbine & Generator
- Power Distribution System
- Transformer
- Switchboard
By Power Output
- Small Scale (Up to 72 MW)
- Medium Scale (72 MW to 400 MW)
- High Scale (Above 400 MW)
By Region
- Asia Pacific
- North America
- Middle East & Africa
- RoW
Available Customizations:
With the given market data, MarketsandMarkets offers customizations as per the client�s specific needs. The following customization options are available for this report:
Company Information
Detailed analyses and profiling of additional market players (up to five).
Drivers
Increasing demand for power, coupled with the lack of power infrastructure
The demand for power in the industrial sector exceeds the supply. Several industries are facing an acute shortage of power. The governments are therefore encouraging and mandating efficient power consumption for the industrial sector to reduce the demand and supply gap. Additional power plants have also been set up as a permanent power solution. However, establishing permanent power plants is capital-intensive and time-consuming. Such government initiatives have increased the demand for power. However, the grid infrastructure, particularly in most of the developing countries, is unable to meet the increasing demand for power. Several countries in the Asia Pacific, the Middle East, Africa, and South America have seen poor planning and shortfall in capital expenditure, which has created market opportunities for temporary power solutions and accentuated the need for non-renewable floating power plants. The lack of infrastructure has thus increased the demand for floating power plant solutions.
Benefits over land-based power plants
The average age of a power plant is estimated to be 40 years. Post decommissioning, a power plant leaves behind toxic residues, unfading fuel stains, and other forms of pollution that cannot be completely cleaned. Thus, power plant sites, which are polluted by the toxic residues, are sealed off from any further land use. Such degradation of land can be avoided with the help of floating LNG power vessel. According to research, floating power plants are safe from the effects of earthquakes and tsunamis, as the stretch of the ocean would shield the plant from seismic waves. When the floating power plants are moored in about 100 meters of water, the intensity of the tsunami is expected not to cause any serious damage. Thus, floating power plants can help to avoid accidents, such as the Fukushima Daiichi nuclear disaster in Japan in 2011 and the geothermal power plant damage in the Philippines in 2017. These benefits of floating power plants over land-based power plants are expected to drive the floating LNG power vessel market.
Restraints
High operating cost associated with transportation, logistics, & accessibility issues
Floating power plants, which are situated over water bodies, can be damaged by the harsh environment conditions. Any damage to equipment would require maintenance, which is slightly more expensive than that of land-based power plants. Also, floating power plants are usually located dozens of miles away from the shore and are difficult to access, especially in bad weather. So, rectifying a minor technical issue can be tricky and incurs a huge cost. The challenges with maintenance are higher in case of power ships based floating power plants when compared with power barge based power plants. Power ships based power plants have units located at the base of the ship. Thus, the maintenance and repair related issues would increase the non-productive time of the power plant. Other challenging factors in the floating power plant market are the grid interconnection and operation and the development of transmission infrastructure, which is simpler in onshore power plant installations. The high operating cost and issues associated with the operation, maintenance, and transportation and logistics can hinder the growth of the floating power plant market.
Price disparity across regional markets
Gas importers face disparity in prices as the production and supply of most of the world�s natural gas is concentrated in a few countries. While 40% of the total global natural gas production comes from the US and Russia, nearly two-thirds of the total global reserves are located in Russia, Iran, and Qatar. The trade of liquefied natural gas (LNG) is highly localized with only 14% traded in international markets, compared to more than 70% of crude oil. Hence, pricing negotiations are mostly carried out in a confidential manner for large supply agreements, such as the one between Russia's Gazprom and China National Petroleum Corporation (CNPC) in 2014. Utilities in North America pay a much lower cost for natural gas than those in other countries that heavily depend on imports, such as India. India has a natural gas-fired power plant capacity of nearly 24,000 MW, only 20% of which was operational in 2014 due to the high cost of imported natural gas. As a result, the price disparity in the international trade of natural gas is a restraint for the floating LNG Power Vessel market.
Competitive Landscape
Contracts & Agreements
|
Date |
Company |
Development |
|
December 2017 |
Karpowership |
Karpowership received a contract from Electricity Company of Ghana (ECG), to provide a FPP, to supply electric power in Ghana. As a part of this contract, Karpowership inaugurated its 470 MW Karadeniz Powership Osman Khan, in Tema Main Harbor, Ghana. |
|
July 2017 |
Karpowership |
Karpowership, under a strategic partnership with PT PAL Indonesia (Persero), received a contract to construct four floating power plants, which would have a power output ranging from 36 MW to 80 MW. |
Note: The developments mentioned above are for floating LNG power vessel manufacturers.
Source: Company Websites and Press Releases
New Product Launches
|
Date |
Company |
Development |
|
June 2017 |
Chiyoda Corporation |
Chiyoda Corporation developed a LNG-powered floating power plant. The power plant is an integration of the FSRU technology with that of a floating power plant. The company has received an approval in principal from the American Bureau of Shipping (ABS) for this product development. |
|
April 2017 |
MODEC, Inc. |
MODEC developed a floating power plant (power ship), which runs on LNG for power generation. The company targets the African, South & Central American, and the Asia Pacific regions. The power ship would be designed to provide a power output ranging from 84,000 kW to 720,000 kW. |
Note: The developments mentioned above are for the floating LNG power vessel manufacturers
Source: Company Websites and Press Releases
Partnerships, Collaborations, Alliances, And Joint Ventures
|
Date |
Company |
Development |
|
November 2017 |
Wison Group |
Wison Group entered into a strategic cooperation agreement with Shanghai Electric Power Generation Group to provide technical services, promote commercialization, and develop products for medium to large-scale floating LNG power generation barge. |
|
October 2017 |
Wison Group |
Wison Group entered into a strategic cooperation agreement with GTT to strengthen its position in offering floating LNG products in full range of capacities. |
Note: The developments mentioned above are for floating LNG power vessel manufacturers.
Source: Company Websites and Press Releases
The global floating LNG power vessel market is projected to reach a market size of USD 931.6 million by 2023 from an estimated USD 860.1 million in 2018, at a CAGR of 1.61%. This growth can be attributed to the increasing demand for power, lack of power infrastructure, and added benefits over land-based power plants.
The report segments the floating LNG power vessel, by vessel type, into power barge and power ship. The power ship segment is expected to hold the largest market share by 2023. The power ship is generally used in the energy leasing market for short- and mid-term contracts because of its self-propelling property. Karadeniz Holding (Turkey) dominates the supply of power ships in the market. Most of the projects use power between 100 MW and 150 MW and run on liquid fuel or natural gas, which are expected to witness high growth in the market.
The floating LNG power vessel, by component, is segmented into the power generation system and power distribution system. The power generation system segment is expected to dominate the floating LNG power vessel market by 2023. It is further classified into gas turbine & IC engine and steam turbine & generator. Gas turbine & IC engine are the two key components in the floating power generation system market. The gas engine technologies can be connected to the existing gas pipeline system to avoid diesel fuel supply issues that occur during natural calamities, whereas IC engines are used in floating LNG power applications with a power output between 5.0 MW and 20.0 MW.
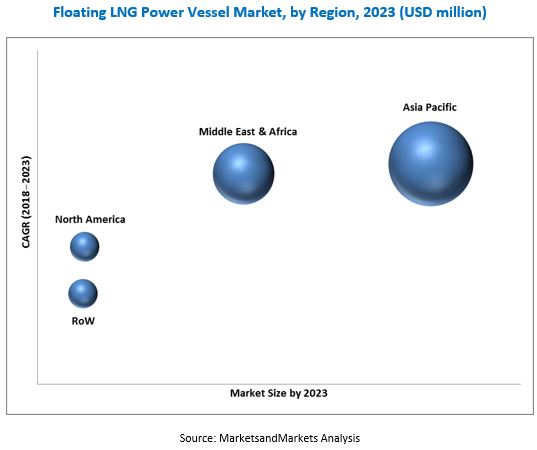
In this report, the floating LNG power vessel market has been analyzed with respect to 4 regions, namely, North America, the Middle East & Africa, Asia Pacific, and the RoW. The Asia Pacific market is estimated to be the largest floating LNG power vessels market from 2018 to 2023. The growth of population in the Asia Pacific region has increased the demand for electricity, which is one of the major factors driving the floating LNG power vessels market. Also, the governments of several countries are spending heavily to meet the increased demand for power. For instance, Karpowership, one of the leading players in the power ship market, was awarded a contract by Myanmar Electric Power Generation Enterprise to provide an FPP in Rangoon, Myanmar. Such activities are expected to drive the floating LNG power vessel market in the region.
The high capital cost associated with the operations, maintenance, transportation, and logistics, price disparity across regional markets, and increasing focus on renewable energy could act as restraints for the market. The leading players in the floating LNG power vessel market include Siemens AG (Germany), MAN Diesel & Turbo SE (Germany), W�rtsil� Corporation (Finland), General Electric Company (US), and Caterpillar Inc. (US). Contracts & agreements is the most commonly adopted strategy by the top players. It is followed by new product launches and partnerships, collaborations, alliances, and joint ventures.
Opportunities
Stringent emission norms for diesel engine powered marine gensets & rise in hybrid fuel engines
The demand for marine gensets operating on diesel fuel oil as well as natural gas (LNG) has increased. The gas and fuel oil hybrid increases fuel efficiency and lowers the cost of operations. The maintenance cost of operating hybrid gensets is also lesser as compared to single fuel oil powered marine genset. Operation & maintenance costs are an important factor for the end-user. Lower emissions than only-diesel gensets is another advantage of hybrid-fuel powered marine gensets, especially the ones with natural gas and diesel fuel option. Hybrid gensets produce a less volume of sulfur oxides (SOx) as well as NOx and particulate matter emissions. These advantages along with stringent emission norms have increased the demand for hybrid-fuel powered marine gensets and have created new opportunities for the component manufacturers in the floating LNG Power Vessel market.
Growth in adoption of LNG as an energy source
According to the International Energy Outlook 2017 (IEO2017), the world�s natural gas producers are expected to increase supplies by 42% from 2015 to 2040. In Russia, the production of natural gas is expected to increase mainly due to increasing development of resources in the country�s Arctic and eastern regions. The US production growth is mainly from shale resources. In China, production would increase due to the development of shale resources, which are projected to account for over half of the country�s total natural gas production by 2040. The comparatively lesser emissions of natural gas-fired power plants at costs that are lower than renewable energy generation are providing an alternative to utilities facing stringent emission regulations. Utilities in the US have responded to the tough emission regulations on coal plants by switching to natural gas-fired power generation. Policy makers are also seeking to leverage gas-fired plants as an option to help reduce overall emissions in the near term. Cleaner gas-fired electricity generation is expected to drive the LNG power generation market. The benefits of floating power plants would provide a growth opportunity for the floating LNG power vessel market.
Challenges
Growth in distributed energy generation
Distributed generation is the act of power generation carried out at or close to the point of end-use. Distributed generation systems are generally defined as being less than 100 MW in capacity (typically less than 50 MW) and can be stationary as well as mobile in nature. Distributed power technology includes solar panels, gas and diesel engines, small wind turbines, fuel cells, and gas turbines. The demand for energy from distributed energy resources has grown globally due to several reasons, such as planned rolling blackouts, power quality problems, unexpected utility power outages, and increases in power costs. Instead of relying totally on utilities for power needs, end-users, which include residential, commercial, and industrial customers, have started generating power from distributed energy sources. This approach is backed by incentives offered by governments, such as net metering and feed-in tariffs, among others. The General Electric Company (U.S.) estimates that annual distributed power capacity additions will rise from 142 GW in 2012 to 200 GW by 2020, while investments in distributed power technologies will grow to USD 206 billion by 2020. Meanwhile, utilities have also started shifting their business models from directly selling electricity to involving end-users as a part of their business to cater to the peak demand without large-scale capacity additions. This, in turn, will eliminate the need for the construction of a new power plant. Hence, the distributed generation resources could pose a challenge for the floating LNG Power Vessel market.
Gas Turbine
|
Company Names |
|
Kawasaki Heavy Industries (Japan) |
|
Mitsubishi Hitachi Power Systems, Ltd (MHPS) (Japan) |
|
Ansaldo (Italy) |
|
Harbin Electric (China) |
|
OPRA (Netherland) |
|
Vericor Power (US) |
|
Bharat Heavy Electricals Limited (BHEL) (India) |
|
Centrax (UK) |
|
Zorya (Ukraine) |
Note: The list mentioned are for companies which provide these components. They may or may not operate in the floating power plant industry.
Steam Turbine
|
Company Names |
|
Toshiba Corporation (Japan) |
|
Mitsubishi Hitachi Power Systems, Ltd (MHPS) (Japan) |
|
Eliott Group (Japan) |
|
Ansaldo Energia (Italy) |
|
Shanghai Electric Group Co. Ltd. (China) |
|
Dongfang Electric Corporation Limited (China) |
|
Harbin Electric International Company Limited (China) |
|
Doosan Skoda Power (Czech Republic) |
|
Bharat Heavy Electricals Limited (BHEL) (India) |
|
Fuji Electric Co., Ltd. (Japan) |
Note: The list mentioned are for companies which provide these components. They may or may not operate in the floating power plant industry.
Power Transformers
|
Company Names |
|
ABB (Switzerland) |
|
Crompton Greaves Ltd. (India) |
|
Toshiba Corporation (Japan) |
|
Hyundai Heavy Industries (South Korea) |
|
Mitsubishi Electric Corporation (Japan) |
|
Hyosung Corporation (South Korea) |
|
Bharat Heavy Electricals Limited (BHEL) (India) |
|
SPX Transformer Solutions, Inc. (US) |
Note: The list mentioned are for companies which provide these components. They may or may not operate in the floating power plant industry.
Switchboard
|
Company Names |
|
ABB (Switzerland) |
|
Mitsubishi Electric Corporation (Japan) |
|
Eaton Corporation (Republic of Ireland) |
|
Rockwell Automation (US) |
|
Schneider Electric (France) |
|
Emerson Electric Company (US) |
Note: The list mentioned are for companies which provide these components. They may or may not operate in the floating power plant industry.
To speak to our analyst for a discussion on the above findings, click Speak to Analyst
 Exclusive indicates content/data unique to MarketsandMarkets and not available with any competitors.
Table of Contents
1 Introduction (Page No. - 13)
1.1 Objectives of the Study
1.2 Definition
1.3 Market Scope
1.3.1 Markets Covered
1.4 Years Considered for the Study
1.5 Currency
1.6 Stakeholders
2 Research Methodology (Page No. - 16)
2.1 Research Data
2.1.1 Secondary Data
2.1.1.1 Key Data From Secondary Sources
2.1.2 Primary Data
2.1.2.1 Key Data From Primary Sources
2.1.2.2 Key Industry Insights
2.1.2.3 Breakdown of Primaries
2.2 Research Methodology Scope
2.3 Market Size Estimation
2.3.1 Ideal Demand Side Analysis
2.3.1.1 Assumptions
2.3.1.2 Calculation
2.3.2 Forecast
3 Executive Summary (Page No. - 23)
4 Premium Insights (Page No. - 28)
4.1 Attractive Opportunities in the Floating LNG Power Vessel Market
4.2 Floating LNG Power Vessel, By Vessel Type
4.3 Floating LNG Power Vessel, By Power Output
4.4 Floating LNG Power Vessel, By Component
4.5 Power Distribution System Segment, By Key Components (2018)
4.6 Power Generation System Segment, By Key Components (2018)
4.7 Floating LNG Power Vessel: Component & Region
5 Market Overview (Page No. - 32)
5.1 Introduction
5.2 Market Dynamics
5.2.1 Drivers
5.2.1.1 Increasing Demand for Power, Coupled With the Lack of Power Infrastructure
5.2.1.2 Benefits Over Land-Based Power Plants
5.2.2 Restraints
5.2.2.1 High Cost Associated With Conducting Operations and Maintenance at Floating Power Plants (FPPS)
5.2.2.2 Price Disparity Across Regional Markets
5.2.2.3 Increasing Focus on Renewable Energy�Floating Power Plants (FPPS)
5.2.3 Opportunities
5.2.3.1 Stringent Emission Norms for Diesel Engine-Powered Marine Gensets and Rise in Hybrid Fuel Engines
5.2.3.2 Growth in Adoption of LNG as an Energy Source
5.2.4 Challenges
5.2.4.1 Growth in Distributed Energy Generation
6 Floating LNG Power Vessel Market, By Vessel Type (Page No. - 39)
6.1 Introduction
6.2 Power Barge
6.3 Power Ship
7 Floating LNG Power Vessel Market, By Power Output (Page No. - 42)
7.1 Introduction
7.2 Small Scale (Up to 72 MW)
7.3 Medium Scale (> 72�400 MW)
7.4 High Scale (> 400 MW)
8 Floating LNG Power Vessel Market, By Component (Page No. - 46)
8.1 Introduction
8.2 Power Generation System
8.2.1 Gas Turbine & Ic Engine
8.2.2 Steam Turbine & Generator
8.3 Power Distribution System
8.3.1 Transformer
8.3.2 Switchboard
9 Floating LNG Power Vessel Market, By Region (Page No. - 54)
9.1 Introduction
9.2 Asia Pacific
9.2.1 By Component
9.2.1.1 Power Generation System: By Type
9.2.1.2 Power Distribution System: By Type
9.2.2 By Power Output
9.3 Middle East & Africa
9.3.1 By Component
9.3.1.1 Power Generation System: By Type
9.3.1.2 Power Distribution System: By Type
9.3.2 By Power Output
9.4 North America
9.4.1 By Component
9.4.1.1 Power Generation System: By Type
9.4.1.2 Power Distribution System: By Type
9.4.2 By Power Output
9.5 Rest of the World
9.5.1 By Component
9.5.1.1 Power Generation System: By Type
9.5.1.2 Power Distribution System: By Type
9.5.2 By Power Output
10 Competitive Landscape (Page No. - 67)
10.1 Overview
10.2 Key Players & Market Structure
10.3 Competitive Scenario
10.3.1 Contracts & Agreements
10.3.2 New Product Launches
10.3.3 Partnerships, Collaborations, Alliances, and Joint Ventures
10.4 List of Component Providers
10.4.1 Gas Turbine
10.4.2 Steam Turbine
10.4.3 Power Transformer
10.4.4 Switchboard
11 Company Profiles (Page No. - 74)
(Business Overview, Products Offered, Recent Developments, and MnM View)*
11.1 Floating Power Vessel Manufacturers
11.1.1 Benchmarking
11.1.2 Waller Marine, Inc.
11.1.3 Karpowership
11.1.4 Power Barge Corporation
11.1.5 Modec, Inc.
11.1.6 Chiyoda Corporation
11.1.7 Wison Group
11.1.8 Samsung Heavy Industries Co., Ltd
11.1.9 Sevan Marine ASA
11.1.10 Hyundai Heavy Industries Co., Ltd.
11.1.11 IHI Corporation
11.1.12 Mitsui O.S.K. Lines, Ltd.
11.1.13 Mitsubishi Heavy Industries, Ltd.
11.2 Component Provider
11.2.1 Benchmarking
11.2.2 General Electric Company
11.2.3 Siemens AG
11.2.4 W�rtsil� Corporation
11.2.5 Man Diesel & Turbo SE
11.2.6 Caterpillar, Inc.
*Details on Business Overview, Products Offered, Recent Developments, and MnM View Might Not Be Captured in Case of Unlisted Companies.
12 Appendix (Page No. - 106)
12.1 Insights of Industry Experts
12.2 Discussion Guide
12.3 Knowledge Store: Marketsandmarkets� Subscription Portal
12.4 Available Customizations
12.5 Related Reports
List of Tables (39 Tables)
Table 1 Global Floating LNG Power Vessel Market Snapshot
Table 2 Global Urban Population Overview, By Region, 1990, 2014, 2030, and 2050
Table 3 Global Access to Electricity, By Region (2016)
Table 4 Market Size, By Vessel Type, 2016�2023 (USD Million)
Table 5 Floating LNG Power Vessel Market, By Power Output, 2016�2023 (USD Million)
Table 6 Small Scale: Market Size, By Region, 2016�2023 (USD Million)
Table 7 Medium Scale: Market Size, By Region, 2016�2023 (USD Million)
Table 8 High Scale: Market Size, By Region, 2016�2023 (USD Million)
Table 9 Floating LNG Power Vessel Market Size, By Component, 2016�2023 (USD Million)
Table 10 Power Generation System: Market Size, By Region, 2016�2023 (USD Million)
Table 11 Power Generation System: Market Size, By Type, 2016�2023 (USD Million)
Table 12 Gas Turbine & Ic Engine: Market Size, By Region, 2016�2023 (USD Million)
Table 13 Steam Turbine & Generator: Market Size, By Region, 2016�2023 (USD Million)
Table 14 Power Distribution System: Market Size, By Region, 2016�2023 (USD Million)
Table 15 Power Distribution System: Market Size, By Type, 2016�2023 (USD Million)
Table 16 Transformer: Market Size, By Region, 2016�2023 (USD Million)
Table 17 Switchboard: Market Size, By Region, 2016�2023 (USD Million)
Table 18 Floating LNG Power Vessel Market Size, By Region, 2016�2023 (USD Million)
Table 19 Market Size, By Region, 2016�2023 (MW)
Table 20 Asia Pacific: Floating LNG Power Vessel Market Size, By Component, 2016�2023 (USD Million)
Table 21 Asia Pacific: Power Generation System Floating Market Size, By Type, 2016�2023 (USD Million)
Table 22 Asia Pacific: Power Distribution System Market Size, By Type, 2016�2023 (USD Million)
Table 23 Asia Pacific: Market Size, By Power Output, 2016�2023 (USD Million)
Table 24 Middle East & Africa: Floating LNG Power Vessel Market Size, By Component, 2016�2023 (USD Million)
Table 25 Middle East & Africa: Market Size, By Type, 2016�2023 (USD Million)
Table 26 Middle East & Africa: Power Distribution System Market Size, By Type, 2016�2023 (USD Million)
Table 27 Middle East & Africa: Market Size, By Power Output, 2016�2023 (USD Million)
Table 28 North America: Floating LNG Power Vessel Market Size, By Component, 2016�2023 (USD Million)
Table 29 North America: Power Generation System Market Size, By Type, 2016�2023 (USD Million)
Table 30 North America: Power Distribution System Market Size, By Type, 2016�2023 (USD Million)
Table 31 North America: Market Size, By Power Output, 2016�2023 (USD Million)
Table 32 Rest of the World: Market Size, By Component, 2016�2023 (USD Million)
Table 33 Rest of the World: Power Generation System Market Size, By Type, 2016�2023 (USD Million)
Table 34 Rest of the World: Power Distribution System Market Size, By Type, 2016�2023 (USD Million)
Table 35 Rest of the World: Market Size, By Power Output, 2016�2023 (USD Million)
Table 36 Karpowership Was the Most Active Player in the Market, January 2014�April 2018
Table 37 Contracts & Agreements
Table 38 New Product Launches
Table 39 Partnerships, Collaborations, Alliances, and Joint Ventures
List of Figures (40 Figures)
Figure 1 Floating LNG Power Vessel: Market Segmentation
Figure 2 Floating LNG Power Vessel Market: Research Design
Figure 3 Power Generation System Segment is Expected to Dominate the Floating LNG Power Vessel Market, By Component, From 2018 to 2023
Figure 4 High Scale (> 400 MW) Segment is Expected to Dominate the Floating LNG Power Vessel Market, By Power Output, From 2018 to 2023
Figure 5 Power Ship Segment is Expected to Dominate the Floating LNG Power Vessel Market, By Vessel Type, From 2018 to 2023
Figure 6 Asia Pacific is Expected to Dominate the Floating LNG Power Vessel Market (In Terms of Share), By 2023
Figure 7 Increasing Demand for Power and Lack of Power Infrastructure to Drive the Floating LNG Power Vessel Market During the Forecast Period
Figure 8 Power Ship Segment is Expected to Dominate the MarketFrom 2018 to 2023
Figure 9 Medium Scale (> 72�400 MW) Segment is Expected to Grow at the Highest Rate During the Forecast Period
Figure 10 Power Generation System Segment is Expected to Dominate the Floating LNG Power Vessel Market During the Forecast Period
Figure 11 Transformer Segment is Estimated to Hold the Largest Market Share in 2018
Figure 12 Gas Turbine & Ic Engine Segment is Estimated to Hold the Largest Market Share in 2018
Figure 13 Power Generation System Segment and Asia Pacific are Expected to Hold the Largest Share of the Floating LNG Power Vessel in 2018
Figure 14 Floating LNG Power Vessel Market: Drivers, Restraints, Opportunities, and Challenges
Figure 15 Electrical Network Expenditure, By Region, 2017 (%)
Figure 16 Power Ship Segment is Expected to Hold the Largest Share in the Floating LNG Power Vessel During the Forecast Period
Figure 17 High Scale Segment is Expected to Account for the Largest Market, 2018�2023
Figure 18 Power Distribution System Segment is Expected to Register the Highest Growth During the Forecast Period
Figure 19 Asia Pacific is Expected to Be the Largest Market in the Power Generation System Segment, 2018�2023
Figure 20 Asia Pacific is Expected to Be the Largest Market in the Power Distribution System Segment, 2018�2023
Figure 21 Middle East & Africa Dominated the Floating LNG Power Vessel in 2016
Figure 22 Floating LNG Power Vessel Market Size, By Region,2018�2023 (USD Million)
Figure 23 Market Size, By Region, 2018�2023 (MW)
Figure 24 Asia Pacific: Market Snapshot
Figure 25 Middle East & Africa: Market Snapshot
Figure 26 Key Developments in the Floating LNG Power Vessel, 2015�2018
Figure 27 Market Ranking of the Major Players in the Floating LNG Power Vessel, By Value, 2016
Figure 28 Modec, Inc.: Company Snapshot
Figure 29 Chiyoda Corporation: Company Snapshot
Figure 30 Samsung Heavy Industries Co., Ltd: Company Snapshot
Figure 31 Sevan Marine ASA: Company Snapshot
Figure 32 Hyundai Heavy Industries Co., Ltd.: Company Snapshot
Figure 33 IHI Corporation: Company Snapshot
Figure 34 Mitsui O.S.K. Lines, Ltd.: Company Snapshot
Figure 35 Mitsubishi Heavy Industries, Ltd.: Company Snapshot
Figure 36 General Electric Company: Company Snapshot
Figure 37 Siemens AG: Company Snapshot
Figure 38 W�rtsil� Corporation: Company Snapshot
Figure 39 Man Diesel & Turbo Se: Company Snapshot
Figure 40 Caterpillar, Inc.: Company Snapshot


Growth opportunities and latent adjacency in Floating LNG Power Vessel Market