European Drug Delivery Technologies Market (Metered Dose Inhalers, Needle-Free injectors, Auto-injectors, Nasal sprays, Transdermal Patches, Nebulizers, Infusion Pumps, Drug Eluting Stents, Sustained Release, Ocular Implants) - Forecasts to 2017


The European drug delivery technology market was worth $39.9 billion in the year 2012. The market is segmented on the basis of route of administration into nine categories - oral, pulmonary, transdermal, injectable, ocular, nasal, topical, implantable, and transmucosal drug delivery. Over the years, European drug delivery technology have grown phenomenally from plain drug reformulation and release technologies, to innovative platforms that hold a huge potential for the effective delivery of biologicals and novel drugs.
Patent expiries of certain blockbuster drugs, growing demand for self-administration and home healthcare devices, rising incidence of chronic diseases such as cardiovascular diseases, diabetes and cancer and growing focus on pediatric and geriatric patients are accelerating the growth of this market. However, drug failures and recalls and technical barriers are estimated to hamper the growth of this market. Over the years, European drug delivery technology have grown phenomenally from plain drug reformulation and release technologies to innovative platforms that hold a huge potential for the effective delivery of biologicals and novel drugs.
The growing number of elderly persons is a large consumer of home care drug delivery devices. Expanding applications of drug delivery into niche therapeutic areas, strategic collaborations and self-administration and home care drug delivery devices represent vast opportunities for key players in this market. According to a 2012 report published by the World Economic Forum (WEF), the total geriatric population of Switzerland (aged 60 years and older) was 23% of the total population. This number is expected to increase to 32% by 2030 and to 37% by 2050. An increase in the number of geriatric patients and rise in demand for convenient drug delivery options pose major opportunities for the development of innovative and easy-to-use systems.
The geographies covered in this study are Germany, France, United Kingdom, Spain, Italy, Russia and Rest of Europe (RoE). Germany is the largest market for drug delivery, followed by France and the U.K. However, these countries are expected to grow at a slower pace than Russia and RoE, primarily due to a certain amount of saturation in the market. The latter markets are poised to register maximum growth over the next five years, owing to the expansion of these economies, increase in disposable income, development of healthcare infrastructure, increasing penetration of health insurance, and rising prevalence of chronic diseases.
Scope of the Report
This research report categorizes the European drug delivery technology market into oral, pulmonary, transdermal, injectable, ocular, nasal, topical, implantable, and transmucosal drug delivery. These markets are broken down into segments and sub-segments, providing exhaustive value analysis for 2010, 2011 and 2012, as well as forecast up to 2017. Each of the markets is comprehensively analyzed at a granular level by geography (Germany, France, United Kingdom, Spain, Italy, Russia and Rest of Europe) to provide in-depth information on the European scenario of this market.
European drug delivery market, by technologies
- Oral
- Controlled Release
- Orodispersible Tablets (ODT) and Taste Masking
- Others
- Pulmonary
- Dry Powder Inhalers
- Metered Dose Inhalers
- Nebulizers
- Transdermal
- Passive
- Reservoir System
- Matrix System
- Active
- Iontophoresis
- Microporation
- Others
- Passive
- Injectable
- Conventional Injection Devices
- Fillable Syringes
- Prefilled Syringes
- Self-injection Devices
- Needle-free Injectors
- Auto-injectors or Safety Syringe Devices
- Pen Injectors
- Others
- Conventional Injection Devices
- Ocular
- Eye Drops
- Ointment and Gel
- Others
- Nasal
- Nasal Drops
- Nasal Sprays
- Nasal Inhalers
- Others
- Topical
- Liquid Formulations
- Semi-solid Formulations
- Solid Formulations
- Implantable
- Drug Eluting Stents
- Implantable Infusion Pumps
- Intravitreal Implants
- Brachytherapy Seeds
- Contraceptive Implants
- Transmucosal
- Oral (Buccal and Sublingual)
- Others (Rectal and Vaginal)
Geographic analysis
- Germany
- France
- United Kingdom
- Spain
- Italy
- Russia
- Rest of Europe (RoE)
Customer Interested in this report also can view
-
Drug Delivery Technologies Market (Metered Dose Inhalers, Needle-Free Injectors, Auto-Injectors, Nasal Sprays, Transdermal Patches, Nebulizers, Infusion Pumps, Drug Eluting Stents, Sustained Release, Ocular Implants) - Global Forecasts To 2017
-
North American Drug Delivery Technologies Market (Metered Dose Inhalers, Needle-Free Injectors, Auto-Injectors, Nasal Sprays, Transdermal Patches, Nebulizers, Infusion Pumps, Drug Eluting Stents, Sustained Release, Ocular Implants) � Forecasts To 2017
The European drug delivery market was worth $39.9 billion in the year 2012; Germany was the largest market, followed by France and the U.K. However, these countries are likely to grow at lower CAGRs compared to the Russia and Rest of Europe (RoE) markets due to a certain amount of saturation in the pharmaceutical markets of the former. Russia and RoE are poised to register maximum growth over the next five years, owing to the expansion of these economies, increase in disposable income, development of healthcare infrastructure, increasing penetration of health insurance, and rising prevalence of chronic diseases.
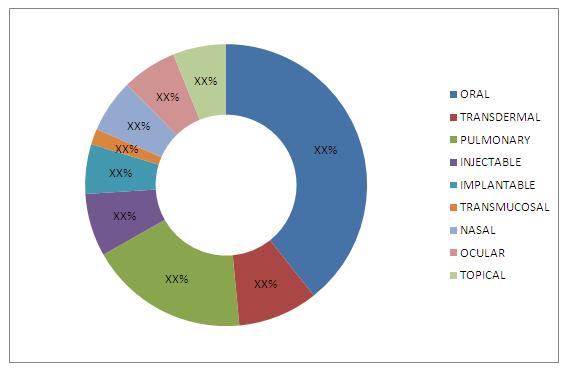
The European drug delivery technology market is segmented on the basis of route of administration into nine categories - oral, pulmonary, transdermal, injectable, ocular, nasal, topical, implantable, and transmucosal. Oral drug delivery is further classified as controlled release technology, orodispersible tablets (ODT) and taste-masking technology, and other technologies (effervescent tablets and chewable tablets). Pulmonary drug delivery is divided into metered dose inhalers, dry powder inhalers, and nebulizers. Transdermal drug delivery is segmented into passive and active delivery. Injectable drug delivery is categorized as conventional injections, self-injection and other injection devices
Ocular drug delivery is further divided into eye drops, ointments and gels and other formulations (ocular inserts and punctal plugs). Nasal drug delivery is classified as nasal sprays, inhalers drops, and others. Topical drug delivery is categorized into semi-solid, liquid and solid formulations. Implantable drug delivery is segmented as drug-eluting stents, infusion pumps, contraceptive implants, intraocular implants, and brachytherapy seeds. Transmucosal drug delivery is classified as oral and other (rectal and vaginal). Oral drug delivery is the largest segment, while pulmonary drug delivery is the fastest growing segment of the European drug delivery technology market.
The major drivers of this market are patent expiries of certain blockbuster drugs, growing demand for self administration and home healthcare devices, rising incidence of chronic diseases such as cardiovascular diseases, diabetes and cancer, growing focus on pediatric and geriatric patients, and advancing technology. However, drug failures and recalls, and technical barriers are expected to hamper the growth of this market.
Key players in the European drug delivery technology market are 3M Company (U.S.), Alkermes (Ireland), Aptalis Pharma, Inc. (U.S.), Baxter International, Inc. (U.S.), Becton Dickinson & Co. (U.S.), Catalent Pharma Solutions (U.S.), The Dow Chemical Company (U.S.), Endo Pharmaceuticals (U.S.), Johnson & Johnson (U.S.), Nektar Therapeutics (U.S.), SkyePharma PLC (U.K.), and Ypsomed Holding AG (Switzerland).
EUROPEAN DRUG DELIVERY TECHNOLOGY MARKET SHARE, BY SEGMENT, 2012
Source: Company Annual Reports, SEC Filings, International Society of Drug Delivery Sciences and Technology, International Association of Pharmaceutical Technology (APV � Mainz), World Health Organization (WHO), European Medicines Agency (EMEA), European Foundation for Clinical Nanomedicine, Drug Development & Delivery Publication, ONdrugDelivery Journal, European Journal of Pharmaceutics and Biopharmaceutics (EJPB), Expert Interviews, MnM Analysis
 Exclusive indicates content/data unique to MarketsandMarkets and not available with any competitors.
Table Of Contents
1 Introduction (Page No. - 22)
1.1 Key Take-Aways
1.2 Report Description
1.3 Markets Covered
1.4 Stakeholders
1.5 Research Methodology
1.5.1 Market Size
1.5.2 Market Share
1.5.3 Key Data Points From Secondary Sources
1.5.4 Key Data Points From Primary Sources
1.5.5 Assumptions
2 Executive Summary (Page No. - 29)
3 Market Overview (Page No. - 34)
3.1 Introduction
3.2 Market Dynamics
3.2.1 Drivers
3.2.1.1 Patent Cliff And Increased Competition To Increase Adoption Rate
3.2.1.2 Improving Patient Compliance And Acceptability, An Impetus To The Drug Delivery Systems Market
3.2.1.3 Increasing Focus On Pediatric And Geriatric Patients To Boost Overall Growth
3.2.1.4 Increasing Incidence Of Chronic Diseases Like Cancer And Diabetes To Enhance Demand For Drug Delivery Technologies
3.2.1.5 Higher Premature Mortality Rates In Eastern Europe And Russia Suggests Need For Better Medication
3.2.2 Restraints
3.2.2.1 Drug Failures And Recalls Mar Market Growth
3.2.2.2 Technical Barriers Restrict Growth
3.2.3 Opportunities
3.2.3.1 Collaborations Between Pharmaceutical Companies And Drug Delivery Firms
3.2.3.2 Self-Administration And Home Care Drug Delivery Devices
3.2.3.3 Expanding Therapeutic Applications Of Drug Delivery Technologies
3.2.4 Targeted Drug Delivery
3.2.4.1 Passive Systems Contribute 60% To The Targeted Drug Delivery Market
3.2.4.2 Active Targeted Drug Delivery Has Major Applications In Cancer Therapy
3.2.4.3 Companies Focus On Novel Targeted Drug Delivery
3.2.5 Burning Issues
3.2.5.1 Striking Right Partnerships
3.2.5.2 Improving The Bioavailability Of Drugs
3.3 Regulatory Affairs
3.3.1 European Union Regulatory Framework
3.3.2 Germany
3.3.2.1 Bundesministerium F�r Gesundheit (Ministry Of Health)
3.3.2.2 Bundesinstitut F�r Arzneimittel Und Medizinprodukte (Federal Institute For Drugs And Medical Devices)
3.3.3 U.K.
3.3.3.1 The Medicines And Healthcare Products Regulatory Agency (MHRA)
3.3.4 France
3.3.4.1 Agence Nationale De S�curit� Du M�dicament Et Des Produits De Sant� (National Agency For The Safety Of Medicines And Health Products)
3.3.5 Spain
3.3.5.1 Agencia Espagnola De Medicamentos Y Productos Sanitarios (Spanish Medicines And Health Products Agency)
3.3.6 Italy
3.3.6.1 Agenzia Italiana Del Farmaco (Italian Medicines Agency)
3.3.7 Russia
3.3.7.1 Association Of International Pharmaceutical Manufacturers (AIPM)
3.4 Reimbursement Scenario In The European Union
3.5 Market Segmentation
3.6 Porter�s Five Forces Analysis
3.7 Value Chain Analysis
3.8 Market Share Analysis
3.8.1 Pulmonary Drug Delivery
3.8.2 Injectable Drug Delivery
3.8.2.1 Conventional Injection Devices
3.8.2.2 Self-Injection Devices
4 Global Drug Delivery Market, By Technology (Page No. - 64)
4.1 Introduction
4.2 Opportunity Matrix
4.3 Oral Drug Delivery
4.3.1 Controlled Release
4.3.2 Orodispersible Tablets (ODT) And Taste Masking
4.3.3 Others
4.4 Pulmonary Drug Delivery
4.4.1 Therapeutic Applications Of Pulmonary Delivery
4.4.2 Metered Dose Inhalers (MDI)
4.4.3 Dry Powder Inhalers (DPI)
4.4.4 Nebulizers
4.5 Transdermal Drug Delivery
4.5.1 Passive Transdermal Drug Delivery
4.5.1.1 Matrix System
4.5.1.2 Reservoir System
4.5.2 Active Transdermal Drug Delivery
4.5.2.1 Microporation
4.5.2.2 Iontophoresis
4.5.2.3 Others
4.6 Injectable Drug Delivery
4.6.1 Conventional Injectable Drug Delivery Devices
4.6.1.1 Fillable
4.6.1.2 Prefilled
4.6.2 Self-Injection Devices
4.6.2.1 Pen Injectors
4.6.2.2 Needle-Free Injectors
4.6.2.3 Auto Injectors
4.6.3 Others
4.7 Ocular Drug Delivery
4.7.1 Eye Drops
4.7.2 Ointments And Gels
4.7.3 Others
4.8 Nasal Drug Delivery
4.8.1 Nasal Sprays
4.8.2 Nasal Inhalers
4.8.3 Nasal Drops
4.8.4 Others
4.9 Topical Drug Delivery
4.9.1 Semi-Solid Formulations
4.9.2 Liquid Formulations
4.9.3 Solid Formulations
4.10 Implantable Drug Delivery
4.10.1 Drug- Eluting Stents
4.10.2 Implantable Infusion Pumps
4.10.3 Contraceptive Implants
4.10.4 Intraocular Implants
4.10.5 Brachytherapy Seeds
4.11 Transmucosal Drug Delivery
4.11.1 Oral (Buccal And Sublingual)
4.11.2 Others (Rectal, Vaginal)
5 Geographic Analysis (Page No. - 150)
5.1 Introduction
5.2 Germany
5.3 France
5.4 U.K.
5.5 Spain
5.6 Italy
5.7 Russia
5.8 Rest Of Europe (ROE)
6 Competitive Landscape (Page No. - 230)
6.1 Introduction
6.2 New Product Launch
6.3 Agreements, Collaborations, Joint Ventures & Partnerships
6.4 Mergers & Acquisitions
6.5 Other Developments
7 Company Profiles (Overview, Financials, Products & Services, Strategy, & Developments)* (Page No. - 240)
7.1 3M Company
7.2 Alkermes, Inc.
7.3 Becton, Dickinson And Company
7.4 Cima Labs
7.5 Dali Medical Devices
7.6 Foamix
7.7 Johnson & Johnson, Inc.
7.8 Psivida Corporation
7.9 Skyepharma Plc
7.10 Valeant Pharmaceuticals
7.11 Ypsomed Holding AG
*Details On Financials, Product & Services, Strategy, & Developments Might Not Be Captured In Case Of Unlisted Companies.
List Of Tables (141 Tables)
Table 1 European drug delivery technology Market, By Technology, 2010 � 2017($Billion)
Table 2 European drug delivery technology Market, By Technology, 2010 � 2017($Billion)
Table 3 European Oral Drug Delivery technology Market, By Technology, 2010 � 2017 ($Million)
Table 4 European drug delivery technology Market, By Country, 2010 � 2017 ($Million)
Table 5 European Controlled Release Drug Delivery Market, By Country, 2010 � 2017 ($Million)
Table 6 European Odt &Taste-Masking Market, By Country, 2010 � 2017 ($Million)
Table 7 European Other Oral Drug Delivery Technologies Market, By Country, 2010 � 2017 ($Million)
Table 8 European Pulmonary Drug Delivery Market, By Device Type, 2010 � 2017 ($Million)
Table 9 European Market, By Country, 2010 � 2017 ($Million)
Table 10 Comparative Overview Of Pulmonary Drug Delivery Devices
Table 11 European Metered Dose Inhalation (Mdi) Market, By Country,2010 � 2017 ($Million)
Table 12 European Dry Powder Inhalation (Dpi) Market, By Country, 2010 � 2017 ($Million)
Table 13 European Nebulizers Market, By Country, 2010 � 2017 ($Million)
Table 14 European Transdermal Drug Delivery Market, By Mode Of Delivery, 2010 � 2017 ($Million)
Table 15 European Market, By Country, 2010 � 2017 ($Million)
Table 16 European Passive Transdermal Drug Delivery Market, By Product Type, 2010 � 2017 ($Million)
Table 17 European Market, By Country, 2010 � 2017 ($Million)
Table 18 European Active Transdermal Drug Delivery Market, By Technology, 2010 � 2017 ($Million)
Table 19 European Market, By Country, 2010 � 2017 ($Million)
Table 20 European Injectable Drug Delivery Market, By Product Type, 2010 � 2017 ($Million)
Table 21 European Market, By Country, 2010 � 2017 ($Million)
Table 22 European Conventional Injection Devices Market, By Product, 2010 � 2017 ($Million)
Table 23 European Market, By Country, 2010 � 2017 ($Million)
Table 24 European Self-Injection Devices Market, By Product, 2010 � 2017 ($Million)
Table 25 European Market, By Country, 2010 � 2017 ($Million)
Table 26 European Other Injectors Market, By Country, 2010 � 2017 ($Million)
Table 27 European Ocular Drug Delivery Market, By Formulation, 2010 � 2017 ($Million)
Table 28 European Market, By Country, 2010 � 2017 ($Million)
Table 29 European Eye Drops Market, By Country, 2010 � 2017 ($Million)
Table 30 Ointment & Gel Delivery Market, By Country, 2010 � 2017 ($Million)
Table 31 European Other Ocular Drug Delivery Market, By Country, 2010 � 2017 ($Million)
Table 32 European Nasal Drug Delivery Market, By Formulation, 2010 � 2017 ($Million)
Table 33 European Market, By Country, 2010 � 2017 ($Million)
Table 34 European Nasal Spray Market, By Country, 2010 � 2017 ($Million)
Table 35 European Nasal Inhaler Market, By Country, 2010 � 2017 ($Million)
Table 36 European Nasal Drops Market, By Country, 2010 � 2017 ($Million)
Table 37 European Other Nasal Delivery Formulations Market, By Country, 2010 � 2017 ($Million)
Table 38 European Topical Drug Delivery Market, By Formulation, 2010 � 2017 ($Million)
Table 39 European Market, By Country, 2010 � 2017 ($Million)
Table 40 European Semi-Solid Topical Formulation Market, By Country, 2010 � 2017 ($Million)
Table 41 European Liquid Topical Formulation Market, By Country, 2010 � 2017 ($Million)
Table 42 European Solid Topical Formulation Market, By Country, 2010 � 2017 ($Million)
Table 43 European Implantable Drug Delivery Market, By Device, 2010 � 2017 ($Million)
Table 44 European Market, By Country, 2010 � 2017 ($Million)
Table 45 European Drug-Eluting Stents Market, By Country, 2010 � 2017 ($Million)
Table 46 European Implantable Infusion Pumps Market, By Country, 2010 � 2017 ($Million)
Table 47 European Contraceptive Implants Market, By Country, 2010 � 2017 ($Million)
Table 48 European Intraocular Implants Market, By Country, 2010 � 2017 ($Million)
Table 49 European Brachytherapy Seeds Market, By Country, 2010 � 2017 ($Million)
Table 50 European Transmucosal Drug Delivery Market, By Mucosa Type, 2010 � 2017 ($Million)
Table 51 European Market, By Country, 2010 � 2017 ($Million)
Table 52 European Oral Transmucosal Drug Delivery Market, By Country, 2010 � 2017 ($Million)
Table 53 European Other Transmucosal Drug Delivery Technologies Market, By Country, 2010 � 2017 ($Million)
Table 54 Germany: Drug Delivery Technologies Market, By Route Of Administration, 2010 � 2017 ($Million)
Table 55 Germany: Oral Drug Delivery Market, By Technology, 2010 � 2017 ($Million)
Table 56 Germany: Pulmonary Drug Delivery Market, By Device Type, 2010 � 2017 ($Million)
Table 57 Germany: Transdermal Drug Delivery Market, By Mode Of Delivery, 2010 � 2017 ($Million)
Table 58 Germany: Injectable Drug Delivery Market, By Technology, 2010 � 2017 ($Million)
Table 59 Germany: Ocular Drug Delivery Market, By Formulation, 2010 � 2017 ($Million)
Table 60 Germany: Nasal Drug Delivery Market, By Formulation, 2010 � 2017 ($Million)
Table 61 Germany: Topical Drug Delivery Market, By Formulation, 2010 � 2017 ($Million)
Table 62 Germany: Implantable Drug Delivery Market, By Device Type, 2010 � 2017 ($Million)
Table 63 Germany: Transmucosal Drug Delivery Market, By Mucosa Type, 2010 � 2017 ($Million)
Table 64 France: Drug Delivery Technologies Market, By Route Of Administration, 2010 � 2017 ($Million)
Table 65 France: Oral Drug Delivery Market, By Technology, 2010 � 2017 ($Million)
Table 66 France: Pulmonary Drug Delivery Market, By Device Type, 2010 � 2017 ($Million)
Table 67 France: Transdermal Drug Delivery Market, By Mode Of Delivery, 2010 � 2017 ($Million)
Table 68 France: Injectable Drug Delivery Market, By Technology, 2010 � 2017 ($Million)
Table 69 France: Ocular Drug Delivery Market, By Formulation, 2010 � 2017 ($Million)
Table 70 France: Nasal Drug Delivery Market, By Formulation, 2010 � 2017 ($Million)
Table 71 France: Topical Drug Delivery Market, By Formulation, 2010 � 2017 ($Million)
Table 72 France: Implantable Drug Delivery Market, By Device Type, 2010 � 2017 ($Million)
Table 73 France: Transmucosal Drug Delivery Market, By Mucosa Type, 2010 � 2017 ($Million)
Table 74 U.K.: Drug Delivery Technologies Market, By Route Of Administration, 2010 � 2017 ($Million)
Table 75 U.K.: Oral Drug Delivery Market, By Technology, 2010 � 2017 ($Million)
Table 76 U.K.: Pulmonary Drug Delivery Market, By Device Type, 2010 � 2017 ($Million)
Table 77 U.K.: Transdermal Drug Delivery Market, By Mode Of Delivery, 2010 � 2017 ($Million)
Table 78 U.K.: Injectable Drug Delivery Market, By Technology, 2010 � 2017 ($Million)
Table 79 U.K.: Ocular Drug Delivery Market, By Formulation, 2010 � 2017 ($Million)
Table 80 U.K.: Nasal Drug Delivery Market, By Formulation, 2010 � 2017 ($Million)
Table 81 U.K.: Topical Drug Delivery Market, By Formulation, 2010 � 2017 ($Million)
Table 82 U.K.: Implantable Drug Delivery Market, By Device Type, 2010 � 2017 ($Million)
Table 83 U.K.: Transmucosal Drug Delivery Market, By Mucosa Type, 2010 � 2017 ($Million)
Table 84 Spain: Drug Delivery Technologies Market, By Route Of Administration, 2010 � 2017 ($Million)
Table 85 Spain: Oral Drug Delivery Market, By Technology, 2010 � 2017 ($Million)
Table 86 Spain: Pulmonary Drug Delivery Market, By Device Type, 2010 � 2017 ($Million)
Table 87 Spain: Transdermal Drug Delivery Market, By Mode Of Delivery, 2010 � 2017 ($Million)
Table 88 Spain: Injectable Drug Delivery Market, By Technology, 2010 � 2017 ($Million)
Table 89 Spain: Ocular Drug Delivery Market, By Formulation, 2010 � 2017 ($Million)
Table 90 Spain: Nasal Drug Delivery Market, By Formulation, 2010 � 2017 ($Million)
Table 91 Spain: Topical Drug Delivery Market, By Formulation, 2010 � 2017 ($Million)
Table 92 Spain: Implantable Drug Delivery Market, By Device Type, 2010 � 2017 ($Million)
Table 93 Spain: Transmucosal Drug Delivery Market, By Mucosa Type, 2010 � 2017 ($Million)
Table 94 Italy: Drug Delivery Technologies Market, By Route Of Administration, 2010 � 2017 ($Million)
Table 95 Italy: Oral Drug Delivery Market, By Technology, 2010 � 2017 ($Million)
Table 96 Italy: Pulmonary Drug Delivery Market, By Device Type, 2010 � 2017 ($Million)
Table 97 Italy: Transdermal Drug Delivery Market, By Mode Of Delivery, 2010 � 2017 ($Million)
Table 98 Italy: Injectable Drug Delivery Market, By Technology, 2010 � 2017 ($Million)
Table 99 Italy: Ocular Drug Delivery Market, By Formulation, 2010 � 2017 ($Million)
Table 100 Italy: Nasal Drug Delivery Market, By Formulation, 2010 � 2017 ($Million)
Table 101 Italy: Topical Drug Delivery Market, By Formulation, 2010 � 2017 ($Million)
Table 102 Italy: Implantable Drug Delivery Market, By Device Type, 2010 � 2017 ($Million)
Table 103 Italy: Transmucosal Drug Delivery Market, By Mucosa Type, 2010 � 2017 ($Million)
Table 104 Russia: Drug Delivery Technologies Market, By Route Of Administration, 2010 � 2017 ($Million)
Table 105 Russia: Oral Drug Delivery Market, By Technology, 2010 � 2017 ($Million)
Table 106 Russia: Pulmonary Drug Delivery Market, By Device Type, 2010 � 2017 ($Million)
Table 107 Russia: Transdermal Drug Delivery Market, By Mode Of Delivery, 2010 � 2017 ($Million)
Table 108 Russia: Injectable Drug Delivery Market, By Technology, 2010 � 2017 ($Million)
Table 109 Russia: Ocular Drug Delivery Market, By Formulation, 2010 � 2017 ($Million)
Table 110 Russia: Nasal Drug Delivery Market, By Formulation, 2010 � 2017 ($Million)
Table 111 Russia: Topical Drug Delivery Market, By Formulation, 2010 � 2017 ($Million)
Table 112 Russia: Implantable Drug Delivery Market, By Device Type, 2010 � 2017 ($Million)
Table 113 Russia: Transmucosal Drug Delivery Market, By Mucosa Type, 2010 � 2017 ($Million)
Table 114 ROE: Drug Delivery Technologies Market, By Route Of Administration, 2010 � 2017 ($Million)
Table 115 ROE: Oral Drug Delivery Market, By Technology, 2010 � 2017 ($Million)
Table 116 ROE: Pulmonary Drug Delivery Market, By Device Type, 2010 � 2017 ($Million)
Table 117 ROE: Transdermal Drug Delivery Market, By Mode Of Delivery, 2010 � 2017 ($Million)
Table 118 ROE: Injectable Drug Delivery Market, By Technology, 2010 � 2017 ($Million)
Table 119 ROE: Ocular Drug Delivery Market, By Formulation, 2010 � 2017 ($Million)
Table 120 ROE: Nasal Drug Delivery Market, By Formulation, 2010 � 2017 ($Million)
Table 121 ROE: Topical Drug Delivery Market, By Formulation, 2010 � 2017 ($Million)
Table 122 ROE: Implantable Drug Delivery Market, By Device Type, 2010 � 2017 ($Million)
Table 123 ROE: Transmucosal Drug Delivery Market, By Mucosa Type, 2010 � 2017 ($Million)
Table 124 New Product Launch, 2010 � 2012
Table 125 Agreements, Collaborations, Joint Ventures & Partnerships, 2011 �2012
Table 126 Mergers & Acquisitions, 2011 �2013
Table 127 Other Developments, 2010 � 2013
Table 128 3M Company: Total Revenue, By Segment, 2009 � 2011 ($Million)
Table 129 3M Company: Total Revenue, By Geography, 2009 � 2011 ($Million)
Table 130 Alkermes: Total Revenue, By Geography, 2009 � 2011 ($Million)
Table 131 Becton, Dickinson: Total Revenue, By Segment, 2010 � 2012 ($Million)
Table 132 Becton, Dickinson: Medical Division Total Revenue, By Segment, 2010 � 2012 ($Million)
Table 133 Becton, Dickinson: Total Revenue, By Geography, 2010 � 2012($Million)
Table 134 Teva Pharmaceutical Industries Limited: Total Revenue, By Segment, 2010 � 2012 ($Million)
Table 135 Teva Pharmaceutical Industries Limited: Total Revenue, By Geography, 2010 � 2012 ($Million)
Table 136 Johnson & Johnson, Inc.: Total Revenue, By Segment, 2010 � 2012 ($Million)
Table 137 Johnson & Johnson, Inc.: Total Revenue, By Geography, 2010 � 2012 ($Million)
Table 138 Valeant Pharmaceuticals: Total Revenue, By Geography, 2010 � 2012 ($Million)
Table 139 Ypsomed: Total Revenue, By Segment, 2009 � 2011 ($Million)
Table 140 Ypsomed: Total Revenue, By Geography, 2009 ($Million)
Table 141 Ypsomed: Total Revenue, By Geography, 2010 � 2011 ($Million)
List Of Figures (20 Figures)
Figure 1 European Drug Delivery Technology Market, By Route Of Administration, 2012 � 2017
Figure 2 European Drug Delivery Technology Market, By Country, 2010 � 2017 ($Billion)
Figure 3 Market Dynamics
Figure 4 European Drug Delivery Technology Market Segmentation
Figure 5 Porter�s Five Forces Analysis For Drug Delivery Market
Figure 6 Value Chain Analysis
Figure 7 European Pulmonary Drug Delivery: Market Share Analysis, By Key Player, 2012
Figure 8 European Conventional Injection Devices: Market Share Analysis, By Key Player, 2012
Figure 9 European Conventional Injectable Drug Delivery: Market Share Analysis, By Key Player, 2012
Figure 10 Opportunity Matrix: European Drug Delivery Technologies Market (2012)
Figure 11 Key Growth Strategies, 2010 � 2013
Figure 12 3M Company: Total Revenue And R&D Expenses, 2009 � 2011 ($Million)
Figure 13 Alkermes: Total Revenue And R&D Expenditure, 2009 � 2011 ($Million)
Figure 14 Becton, Dickinson: Total Revenue And R&D Expenditure, 2010 � 2012 ($Million)
Figure 15 Teva Pharmaceutical Industries Limited: Total Revenue And R&D Expenses, 2010 � 2012 ($Million)
Figure 16 Johnson & Johnson, Inc.: Total Revenue And R&D Expenses, 2010 � 2012 ($Million)
Figure 17 Psivida Corporation: Total Revenue, 2009 � 2011 ($Million)
Figure 18 Skyepharma Plc: Total Revenue And R&D Expenses, 2009 � 2011 ($Million)
Figure 19 Valeant Pharmaceuticals: Total Revenue And R&D Expenses, 2010 � 2012 ($Million)
Figure 20 Ypsomed: Total Revenue And R&D Expenses, 2009 � 2011 ($Million)

 Generating Response ...


Growth opportunities and latent adjacency in European Drug Delivery Technologies Market