Electronic Access Control Systems (Authentication Systems, Biometrics, Card Based, Touch Screens & Keypads, Door Contacts, Intruder Alarms & Perimeter Security) Market: Global Forecast & Analysis (2012 � 2017), By Application & Geography


The EACS (Electronic Access Control Systems) market comprising authentication systems, intruder alarm, and perimeter security system has recovered post recession and is showing a promising growth; owing to revived commercial projects and technical advancement in the field. EACS is being employed across various fields; ranging from defense to commercial sectors. Authentication systems’ market is poised to grow at a higher pace owing to increased security concerns and inflating security budgets all over the world as compared to the intruder alarm and perimeter security systems market. Biometrics is the major contributor to authentication systems market. Biometrics technology improves the effectiveness of identification and authentication processes, refurbishes control access to physical and electronic resources, and advances the security of information systems. An emerging trend with respect to the EACS market is the demand for integrated solutions that integrate immediate onsite response with electronic security and alarm systems.
Global EACS market is estimated to reach $16.3 billion by 2017, growing at a CAGR of 7.0% from 2012 to 2017. This growth is mainly attributed to heightened security concerns backed by government and regulatory mandates. The market is, however, facing the issues of technological dormancy and high cost. At the same time, an increasing number of regional regulatory compliances are seen as the major impediment to market growth. There is also a detailed analysis of growth opportunities, key drivers, and restraints of the market; along with emerging industry trends. As a result of the advancement in technologies, there is a renewed interest in upgrading perimeter security systems; both - at the government and enterprise level.
The major players in the market include Bosch Security Systems (Germany), Siemens Building Technologies (Switzerland), Honeywell international Inc. (U.S.), Schneider Electric (France), Assa Abloy AB (Sweden), Tyco International (Switzerland), Magal Security Systems Ltd. (Israel), and Future Fibre Technology (Australia) among others.
Revenue estimates and forecasts for each technology segment; along with geographical specifics, are provided in the report. America is leading the total EACS market; followed by APAC and Europe respectively. The key market players across the value chain are identified, profiled, and analyzed to understand the competitive landscape.
Scope of the report
This research report categorizes the global EACS market; based on technology and applications; it also covers the forecasted revenue and future growth area of global energy EACS market. The report analyzes the growth drivers and restraints and undertakes a detailed analysis across all the major geographies.
On the basis of technology
Global EACS market is categorized into three basic systems; intruder alarm systems, perimeter security systems, and access control systems. The authentication system is further segmented into four categories on the basis of technology such as “biometrics”, “card-based”, “touch screens and keypads”, and “door contacts”. The intruder alarm systems comprise “detection systems”, “alarm panels”, and “communication devices”. The sub segments of perimeter security systems include “free standing”, “fence and wall mounted”, and “buried” perimeter security system.
On the basis of application areas
Global EACS market is categorized into homeland security, commercial, industrial residential and other. Homeland security covers defense and government buildings. The commercial segment encompasses airports, financial institutions and healthcare.
On the basis of geography
Geographical analysis covers America, Europe, Asia-Pacific, and ROW. America is further segmented into South America and North America. Middle East and Africa are considered under “ROW”.
Electronic Access Control System (EACS) market is highly fragmented and comprises a large number of players across the value chain. The industry is highly competitive due to the presence of both - multinational and local players at huge. The EACS market has shown tremendous growth recovery post recession. The growth in the market is attributed to the heightened security needs, advancement of technologies, government mandates, and insurance regulations. EACS report categorizes the global market; based on technology and applications; it also covers the forecasted revenue and future growth area of global EACS market.
Global EACS technology market is categorized into three basic systems; intruder alarm systems, perimeter security systems, and access control systems. The authentication system is further segmented into four categories on the basis of technology such as “biometrics”, “card-based”, “touch screens and keypads”, and “door contacts”. The intruder alarm systems comprise “detection systems”, “alarm panels”, and “communication devices”. The sub segments of perimeter security systems include “free standing”, “fence and wall mounted”, and “buried” perimeter security system.
EACS market is categorized into homeland security, commercial, industrial residential and other. Homeland security covers defense and government buildings. The commercial segment encompasses airports, financial institutions and healthcare.
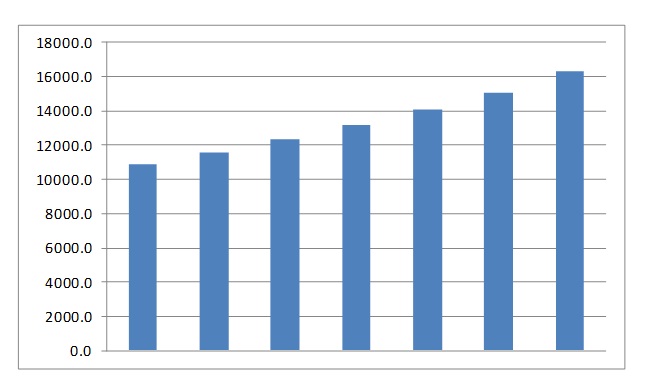
GROWTH OF EACS MARKET, 2011 - 2017
Source: MarketsandMarkets Analysis
The figure above depicts the growth of EACS market from 2011 to 2017. The intruder alarm systems and perimeter security system market is expected to witness a moderate growth rate during the forecasted period, while the “authentication system” is the high growing market segment. The authentication system commanded the largest market share and is expected to remain so during the forecasted period. The EACS market growth is backed by high demand for enhanced security, revived construction of stalled projects post recession, and also by the technological advancement in the field.
 Exclusive indicates content/data unique to MarketsandMarkets and not available with any competitors.
TABLE OF CONTENTS
1 INTRODUCTION
1.1 KEY TAKE-AWAYS
1.2 REPORT DESCRIPTION
1.3 MARKETS COVERED
1.4 STAKEHOLDERS
1.5 RESEARCH METHODOLOGY
1.5.1 MARKET SIZE
1.5.2 MARKET CRACKDOWN
1.5.3 KEY DATA POINTS TAKEN FROM SECONDARY SOURCES
1.5.4 KEY DATA POINTS TAKEN FROM PRIMARY SOURCES
1.5.5 ASSUMPTIONS
1.5.6 LIST OF COMPANIES COVERED IN THE PRIMARY RESEARCH
2 EXECUTIVE SUMMARY
3 MARKET OVERVIEW
3.1 SECURITY MARKET OVERVIEW
3.2 HISTORY & EVOLUTION
3.3 MARKET DEFINITION
3.4 MARKET DYNAMICS
3.4.1 DRIVERS
3.4.1.1 DEMAND FOR ENHANCED SECURITY
3.4.1.2 GOVERNMENT REGULATIONS REQUIRING INCREASED SECURITY LEVELS
3.4.1.3 EASY TO SETUP WITH WIRELESS TECHNOLOGY
3.4.1.4 HIGH COST OF MANNED SECURITY
3.4.2 RESTRAINTS
3.4.2.1 HIGH INSTALLATION COST
3.4.2.2 LACK OF AWARENESS
3.4.2.3 STEADY ADVANCEMENT IN DETECTION TECHNOLOGY
3.4.2.4 FALSE OR NUISANCE ALARMS
3.4.3 OPPORTUNITIES
3.4.3.1 BIOMETRICS ENABLED SMARTPHONES
3.5 BURNING ISSUES
3.5.1 LACK OF INTEROPERABILITY
3.5.2 INTERACTIVE SERVICES
3.6 WINNING IMPERATIVE
3.6.1 IP-BASED EACS
3.7 VALUE CHAIN ANALYSIS
3.7.1 COMPONENT MANUFACTURERS
3.7.2 ORIGINAL EQUIPMENT MANUFACTURERS
3.7.3 DISTRIBUTORS /INSTALLERS
3.7.4 SYSTEM INTEGRATORS
3.8 PORTER’S FIVE FORCE MODEL
3.8.1 SUPPLIER’S POWER
3.8.2 BUYER’S POWER
3.8.3 DEGREE OF COMPETITION
3.8.4 THREAT FROM NEW ENTRANTS
3.8.5 THREAT FROM SUBSTITUTES
4 TECHNOLOGY MARKET
4.1 INTRODUCTION
4.2 AUTHENTICATION SYSTEMS
4.2.1 BIOMETRICS
4.2.1.1 FACE RECOGNITION
4.2.1.2 FINGERPRINT RECOGNITION
4.2.1.3 IRIS RECOGNITION
4.2.1.4 PALM PRINT RECOGNITION
4.2.1.5 VOICE RECOGNITION
4.2.1.6 SIGNATURE RECOGNITION
4.2.1.7 VEIN RECOGNITION
4.2.1.8 OTHER BIOMETRIC TECHNOLOGIES
4.2.1.8.1 DNA RECOGNITION
4.2.1.8.2 KEYSTROKE RECOGNITION
4.2.1.8.3 GAIT RECOGNITION
4.2.2 CARD BASED
4.2.3 TOUCH SCREENS AND KEYPADS
4.2.4 DOOR CONTACTS
4.3 INTRUDER ALARM SYSTEMS
4.3.1 DETECTION SYSTEMS
4.3.1.1 MOTION DETECTOR
4.3.1.2 GLASS BREAK DETECTOR
4.3.1.3 DOOR/WINDOW SENSOR
4.3.2 ALARM PANELS
4.3.3 COMMUNICATION DEVICES
4.4 PERIMETER SECURITY SYSTEMS
4.4.1 FREE STANDING PERIMETER SECURITY
4.4.2 FENCE MOUNTED PERIMETER SECURITY
4.4.3 BURIED PERIMETER SECURITY
5 APPLICATION MARKET
5.1 INTRODUCTION
5.2 HOMELAND SECURITY
5.2.1 DEFENSE
5.2.2 GOVERNMENT BUILDINGS
5.3 COMMERCIAL
5.3.1 AIRPORTS
5.3.2 FINANCIAL INSTITUTIONS
5.3.3 HEALTHCARE
5.3.4 TELECOMMUNICATION
5.3.5 STADIUMS
5.4 INDUSTRIAL
5.5 RESIDENTIAL
5.6 OTHER
6 GEOGRAPHIC ANALYSIS
6.1 INTRODUCTION
6.2 AMERICAS
6.2.1 NORTH AMERICA
6.2.2 SOUTH AMERICA
6.3 EUROPE
6.4 APAC
6.5 ROW
7 COMPETITIVE LANDSCAPE
7.1 INTRODUCTION
7.1.1 MARKET PLAYERS REVENUE & MARKET RANKINGS
7.2 COMPETITIVE LANDSCAPE
7.2.1 MERGERS & ACQUISITIONS
7.2.2 NEW PRODUCT LAUNCH
7.2.3 COLLABORATIONS & PARTNERSHIPS
7.2.4 OTHERS
8 COMPANY PROFILES (OVERVIEW, FINANCIALS, PRODUCTS & SERVICES, STRATEGY, & DEVELOPMENTS)*
8.1 AIPHONE CO., LTD.
8.2 ALARM.COM
8.3 ASSA ABLOY AB
8.4 BIO-KEY INTERNATIONAL INC.
8.5 BOSCH SECURITY SYSTEMS
8.6 CISCO SYSTEMS, INC.
8.7 COGNITEC SYSTEMS GMBH
8.8 CONTROL4
8.9 EVERSPRING INDUSTRY CO., LTD
8.10 DIGITALPERSONA, INC.
8.11 FUJITSU LIMITED
8.12 FUTURE FIBRE TECHNOLOGY
8.13 GODREJ AND BOYCE MANUFACTURING COMPANY LIMITED
8.14 HONEYWELL INTERNATIONAL INC.
8.15 INGERSOLL-RAND PLC
8.16 JOHNSON CONTROLS, INC
8.17 LINEAR LLC.
8.18 MAGAL SECURITY SYSTEMS LTD.
8.19 NEC CORPORATION
8.2 PANASONIC CORPORATION
8.21 SIEMENS BUILDING TECHNOLOGIES
8.22 SCHNEIDER ELECTRIC
8.23 TOUCHLESS BIOMETRICS SYSTEMS
8.24 TYCO INTERNATIONAL LIMITED
8.25 UNITED TECHNOLOGIES CORPORATION (UTC)
*DETAILS ON FINANCIALS, PRODUCT & SERVICES, STRATEGY, AND DEVELOPMENTS MIGHT NOT BE CAPTURED IN CASE OF UNLISTED COMPANIES.
LIST OF TABLES
TABLE 1 EACS MARKET SEGMENTATION
TABLE 2 GLOBAL EACS MARKET REVENUE, BY GEOGRAPHY,2011 – 2017 ($MILLION)
TABLE 3 COUNTRY WISE NUMBER OF CRIMES & BURGLARIES, 2010 – 2011
TABLE 4 EACS MARKET REVENUES, BY TECHNOLOGY, 2011 – 2017 ($MILLION)
TABLE 5 BIOMETRICS MARKET REVENUE, BY TECHNOLOGY,2011 – 2017 ($MILLION)
TABLE 6 AUTHENTICATION SYSTEMS MARKET REVENUES, BY GEOGRAPHY,2011 – 2017 ($MILLION)
TABLE 7 DATA TYPES AND RESPECTIVE BIOMETRIC TECHNOLOGIES
TABLE 8 BIOMETRIC PROGRAMS USED BY U.S. GOVERNMENT
TABLE 9 BIOMETRICS MARKET REVENUES, BY GEOGRAPHY,2011 – 2017 ($MILLION)
TABLE 10 FACE RECOGNITION MARKET REVENUES, BY GEOGRAPHY,2011 – 2017 ($MILLION)
TABLE 11 FINGER PRINT MARKET REVENUES, BY GEOGRAPHY,2011 – 2017 ($MILLION)
TABLE 12 DEPLOYED APPLICATIONS OF IRIS RECOGNITION
TABLE 13 IRIS RECOGNITION MARKET REVENUE, BY GEOGRAPHY,2011 – 2017 ($MILLION)
TABLE 14 PALM RECOGNITION MARKET REVENUE, BY GEOGRAPHY,2011 – 2017 ($MILLION)
TABLE 15 VOICE RECOGNITION MARKET REVENUE, BY GEOGRAPHY,2011 – 2017 ($MILLION)
TABLE 16 SIGNATURE RECOGNITION MARKET REVENUE, BY GEOGRAPHY,2011 – 2017 ($MILLION)
TABLE 17 VEIN RECOGNITION MARKET REVENUES, BY GEOGRAPHY,2011 – 2017 ($MILLION)
TABLE 18 OTHER BOIMETRICS MARKET REVENUE, BY GEOGRAPHY,2011 – 2017 ($MILLION)
TABLE 19 CARD BASED AUTHENTICATION SYSTEMS MARKET REVENUES,BY GEOGRAPHY, 2011 – 2017 ($MILLION)
TABLE 20 TOUCH SCREENS & KEYPADS MARKET REVENUE, BY GEOGRAPHY,2011 – 2017 ($MILLION)
TABLE 21 DOOR CONTACTS MARKET REVENUE, BY GEOGRAPHY,2011 – 2017 ($MILLION)
TABLE 22 INTRUDER ALARMS MARKET REVENUES, BY COMPONENT,2011 – 2017 ($MILLION)
TABLE 23 INTRUDER ALARM SYSTEM MARKET REVENUE, BY GEOGRAPHY,2011 – 2017 ($MILLION)
TABLE 24 PERIMETER SECURITY SYSTEMS MARKET REVENUES, BY TECHNOLOGY TYPE, 2011 – 2017 ($MILLION)
TABLE 25 PERIMETER SECURITY SYSTEMS, BY GEOGRAPHY,2011 – 2017 ($MILLION)
TABLE 26 FREE STANDING PERIMETER SECURITY MARKET REVENUES,BY GEOGRAPHY, 2011 – 2017 ($MILLION)
TABLE 27 FENCE MOUNTED PERIMETER SECURITY SYSTEMS MARKET REVENUE, BY GEOGRAPHY, 2011 – 2017 ($MILLION)
TABLE 28 BURIED PERIMETER SECURITY SYSTEMS MARKET REVENUE,BY GEOGRAPHY, 2011 – 2017 ($MILLION)
TABLE 29 EACS MARKET REVENUE, BY APPLICATIONS, 2011 – 2017 ($MILLION)
TABLE 30 PID & PS MARKET REVENUE FOR HOMELAND SECURITY,2011 – 2017 ($MILLION)
TABLE 31 EACS MARKET FOR HOMELAND SECURITY, BY GEOGRAPHY,2011 – 2017 ($MILLION)
TABLE 32 EACS MARKET FOR DEFENSE APPLICATIONS, BY GEOGRAPHY,2011 – 2017 ($MILLION)
TABLE 33 EACS MARKET FOR GOVERNMENT BUILDINGS, BY GEOGRAPHY,2011 – 2017 ($MILLION)
TABLE 34 EACS MARKET FOR COMMERCIAL APPLICATIONS,2011 – 2017 ($MILLION)
TABLE 35 EACS MARKET FOR COMMERCIAL APPLICATIONS, BY GEOGRAPHY,2011 – 2017 ($MILLION)
TABLE 36 EACS MARKET FOR AIRPORTS, BY GEOGRAPHY,2011 – 2017 ($MILLION)
TABLE 37 EACS MARKET FOR FINANCIAL INSTITUTIONS, BY GEOGRAPHY,2011 – 2017 ($MILLION)
TABLE 38 EACS MARKET FOR HEALTHCARE APPLICATIONS, BY GEOGRAPHY,2011 – 2017 ($MILLION)
TABLE 39 EACS MARKET FOR TELECOMMUNICATION, BY GEOGRAPHY,2011 – 2017 ($MILLION)
TABLE 40 EACS MARKET FOR STADIUMS, BY GEOGRAPHY,2011 – 2017 ($MILLION)
TABLE 41 EACS MARKET FOR INDUSTRIAL APPLICATIONS, BY GEOGRAPHY,2011 – 2017 ($MILLION)
TABLE 42 EACS MARKET FOR RESIDENTIAL APPLICATIONS, BY GEOGRAPHY,2011 – 2017 ($MILLION)
TABLE 43 EACS MARKET FOR OTHER APPLICATION, BY GEOGRAPHY,2011 – 2017 ($MILLION)
TABLE 44 EACS MARKET REVENUE, BY GEOGRAPHY, 2011 – 2017 ($MILLION)
TABLE 45 AMERICAS: EACS MARKET REVENUE, BY APPLICATIONS,2011 – 2017 ($MILLION)
TABLE 46 AMERICAS: EACS HOMELAND SECURITY MARKET REVENUE,BY APPLICATIONS, 2011 – 2017 ($MILLION)
TABLE 47 AMERICAS: COMMERCIAL EACS MARKET REVENUE, BY APPLICATIONS, 2011 – 2017 ($MILLION)
TABLE 48 AMERICAS: EACS MARKET REVENUE, BY GEOGRAPHY,2011 – 2017 ($MILLION)
TABLE 49 AMERICAS: EACS MARKET REVENUE, BY TECHNOLOGY TYPES,2011 – 2017 ($MILLION)
TABLE 50 AMERICAS: EACS AUTHENTICATION SYSTEMS MARKET REVENUE,BY TECHNOLOGY, 2011 – 2017 ($MILLION)
TABLE 51 AMERICAS: EACS PERIMETER SECURITY MARKET REVENUE,BY TECHNOLOGY TYPES, 2011 – 2017 ($MILLION)
TABLE 52 NORTH AMERICA: EACS MARKET REVENUE BY COUNTRY,2011 – 2017 ($MILLION)
TABLE 53 SOUTH AMERICA: EACS MARKET REVENUE, BY REGION,2011 – 2017 ($MILLION)
TABLE 54 EUROPE: EACS MARKET REVENUE, BY APPLICATIONS,2011 – 2017 ($MILLION)
TABLE 55 EUROPE: EACS HOMELAND SECURITY MARKET REVENUE,BY APPLICATIONS, 2011 – 2017 ($MILLION)
TABLE 56 EUROPE: COMMERCIAL EACS MARKET REVENUE, BY APPLICATIONS, 2011 – 2017 ($MILLION)
TABLE 57 EUROPE: EACS MARKET REVENUE, BY REGION,2011 – 2017 ($MILLION)
TABLE 58 EUROPE EACS MARKET REVENUE, BY TECHNOLOGY,2011 – 2017 ($MILLION)
TABLE 59 EUROPE: EACS AUTHENTICATION SYSTEMS MARKET REVENUE,BY TECHNOLOGY, 2011 – 2017 ($MILLION)
TABLE 60 EUROPE: EACS PERIMETER SECURITY MARKET REVENUE,BY TECHNOLOGY 2011 – 2017 ($MILLION)
TABLE 61 APAC: EACS MARKET REVENUE, BY APPLICATIONS,2011 – 2017 ($MILLION)
TABLE 62 APAC: EACS HOMELAND SECURITY MARKET REVENUE,BY APPLICATIONS, 2011 – 2017 ($MILLION)
TABLE 63 APAC: COMMERCIAL EACS MARKET REVENUE, BY APPLICATION,2011 – 2017 ($MILLION)
TABLE 64 APAC: EACS MARKET REVENUE, BY REGION, 2011 – 2017 ($MILLION)
TABLE 65 APAC: EACS MARKET REVENUE, BY TECHNOLOGY TYPES,2011 – 2017 ($MILLION)
TABLE 66 APAC: EACS AUTHENTICATION SYSTEMS MARKET REVENUE,BY TECHNOLOGY, 2011 – 2017 ($MILLION)
TABLE 67 APAC: EACS PERIMETER SECURITY MARKET REVENUE,BY TECHNOLOGY, 2011 – 2017 ($MILLION)
TABLE 68 ROW: EACS MARKET REVENUE, BY APPLICATIONS,2011 – 2017 ($MILLION)
TABLE 69 ROW: EACS HOMELAND SECURITY MARKET REVENUE,BY APPLICATIONS, 2011 – 2017 ($MILLION)
TABLE 70 ROW: COMMERCIAL EACS MARKET REVENUE, BY APPLICATIONS,2011 -2017 ($MILLION)
TABLE 71 ROW: EACS MARKET REVENUE, BY REGION, 2011 – 2017 ($MILLION)
TABLE 72 ROW: EACS MARKET REVENUE, BY TECHNOLOGY,2011 – 2017 ($MILLION)
TABLE 73 ROW: EACS AUTHENTICATION SYSTEMS MARKET REVENUE,BY TECHNOLOGY, 2011 – 2017 ($MILLION)
TABLE 74 ROW: EACS PERIMETER SECURITY MARKET REVENUE,BY TECHNOLOGY, 2011 – 2017 ($MILLION)
TABLE 75 GLOBAL SECURITY SOLUTION MARKET: EACS MARKET RANKINGS OF KEY PLAYERS ($BILLION)
TABLE 76 MERGERS & ACQUISITIONS, 2011 – 2012
TABLE 77 NEW PRODUCT LAUNCH, 2008 – 2012
TABLE 78 COLLABORATION & PARTNERSHIP, 2010 – 2012
TABLE 79 OTHERS, 2008 – 2012
TABLE 80 AIPHONE: FINANCIALS, 2011 – 2012
TABLE 81 ASSA ABLOY AB: FINANCIALS ($MILLION)
TABLE 82 BIO-KEY: OVERALL REVENUE, 2010-2011 ($MILLION)
TABLE 83 BOSCH GROUP - FINANCIALS ($MILLION)
TABLE 84 CISCO: REVENUE & INCOME, ($MILLION)
TABLE 85 EVERSPRING: FINANCIALS, 2010 – 2011 ($MILLION)
TABLE 86 FUJITSU: OVERALL REVENUE, 2011 – 2012 ($BILLION)
TABLE 87 HONEYWELL INTERNATIONAL: REVENUE, 2010 – 2011 ($MILLION)
TABLE 88 JOHNSON CONTROL: REVENUE, 2010 – 2011 ($MILLION)
TABLE 89 NORTEK: FINANCIALS, 2010- 2011 ($MILLION)
TABLE 90 MAGAL SECURITY SOLUTIONS: REVENUE, 2010 – 2011 ($MILLION)
TABLE 91 NEC: FINANCIALS, 2011 – 2012 ($BILLION)
TABLE 92 PANASONIC: FINANCIALS, 2011 – 2012 ($MILLION)
TABLE 93 SIEMENS BUILDING TECHNOLOGIES: FINANCIALS,2010 – 2011 ($MILLION)
TABLE 94 SIEMENS BUILDING TECHNOLOGIES: PROFIT,2010 – 2011 ($MILLION)
TABLE 95 SCHNEIDER ELECTRIC: REVENUE, 2010 – 2011 ($MILLION)
TABLE 96 TYCO INTERNATIONAL: REVENUE, BY SEGMENTS, 2011 ($BILLION)
TABLE 97 TYCO INTERNATIONAL: ADT AND FIRE & SECURITY REVENUE,2009 – 2011 ($BILLION)
TABLE 98 TYCO INTERNATIONAL: REVENUE, BY GEOGRAPHY, 2011 ($MILLION)
TABLE 99 UNITED TECHNOLOGIES: FINANCIALS, 2011 ($MILLION)
TABLE 100 UNITED TECHNOLOGIES: R&D EXPENDITURE, 2011 ($MILLION)
LIST OF FIGURES
FIGURE 1 EACS MARKET RESEARCH METHODOLOGY
FIGURE 2 MARKET SIZE ESTIMATION
FIGURE 3 MARKET CRACKDOWN STRATEGY
FIGURE 4 SIGNIFICANT SHIFT IN SECURITY MARKET
FIGURE 5 EVOLUTION OF INTRUSION DETECTION & PREVENTION SYSTEMS
FIGURE 6 INDUSTRY LIFE CYCLE
FIGURE 7 EACS MARKET SEGMENTS
FIGURE 8 DRIVERS: IMPACT ANALYSIS
FIGURE 9 RESTRAINTS: IMPACT ANALYSIS
FIGURE 10 EACS MARKET VALUE CHAIN
FIGURE 11 PORTER’S FIVE FORCES MODEL
FIGURE 12 AUTHENTICATION SYSTEMS SEGMENTATION
FIGURE 13 CONVENTIONAL & NEXT GENERATION BIOMETRIC TECHNOLOGY
FIGURE 14 PERCENTAGE DISTRIBUTION OF BIOMETRIC TECHNOLOGY TYPES,2011 AND 2017
FIGURE 15 APPLICATIONS OF BIOMETRIC SIGNATURES
FIGURE 16 PERIMETER INTRUSION DETECTION PROCESS
FIGURE 17 PERIMETER SECURITY SYSTEM TYPES BY DEPLOYMENT
FIGURE 18 ASSA ABLOY AB: SALES, BY PRODUCTS, 2011
FIGURE 19 CISCO: REVENUE, BY GEOGRAPHY ,2011
FIGURE 20 CISCO: REVENUE, BY BUSINESS SEGMENTS, 2011
FIGURE 21 PRODUCTLINE OF DIGITAL PERSONA
FIGURE 22 HONEYWELL: REVENUE, BY PRODUCT SEGMENTS, 2011
FIGURE 23 INGERSOLL- RAND: REVENUE, BY SECTORS, 2011
FIGURE 24 INGERSOLL- RAND PLC, REVENUE, BY GEOGRAPHY, 2011
FIGURE 25 MAGAL SECURITY SOLUTIONS: BUSINESS SEGMENT REVENUE, 2009 – 2011 ($THOUSAND)
FIGURE 26 NEC: REVENUE SPLIT, BY BUSINESS SEGMENTS, 2012
FIGURE 27 SIEMENS BUILDING TECHNOLOGIES: REVENUE, BY GEOGRAPHY, 2011
FIGURE 28 SCHNEIDER ELECTRIC: SALES BY GEOGRAPHY, 2011
FIGURE 29 UNITED TECHNOLOGIES: REVENUE, BY BUSINESS SEGMENTS, 2011


Growth opportunities and latent adjacency in Electronic Access Control Systems (Authentication Systems, Biometrics, Card Based, Touch Screens & Keypads, Door Contacts, Intruder Alarms & Perimeter Security) Market: Global Forecast & Analysis (2012
I am interested in this electronic access control systems market report. Can you please tell me if there is any information regarding the ratio of revenue earned from repair versus service contracts in the file, ideally broken down by country?
Can I see a sample of the industry life cycle. I am looking for information to do a industry value analysis.
Could You please call once? I am interest to understand the electronic access control systems market. Also, want to understand the company profiles of leading players with focus on their annual turnover?
I'm a co-founder of an access control systems startup but don't have the funds to buy the report at this high price. Is there something that can be done?