Electric Van Market

Electric Van Market by Range (up to 100 miles, 100-200 miles, & above 200 miles), Battery Capacity (up to 50 kWh & above 50 kWh), Battery Type, Propulsion (BEV, FCEV, & PHEV), End Use and Region - Global Forecast to 2030

Report Code: AT 8502 Nov, 2022, by marketsandmarkets.com

[195 Pages Report] The global electric van market was valued at 106.8 thousand units in 2022 and is expected to reach 1,082.9 thousand units by 2030 at a CAGR of 33.6 % during the forecast period 2022-2030. Countries like the US, Japan, China, Germany, and the UK have a significant share of electric vans due to rising demand for environment-friendly vehicles. However, in India, South Korea, and other developing countries, electric vans are still at the initial stage of adoption. The lack of charging stations and the high cost of electric vans can hinder the market’s growth in these countries. The electric van market growth is significantly being fueled by the rising demand from the Europe region.

Europe has stringent emission regulation standards, and the governments of countries in this region are providing huge incentives to promote electric vehicles. As a result, the demand for electric vans has increased tremendously in the region. Electric vans are extensively used in various sectors, such as logistics, e-commerce, and public transportation.
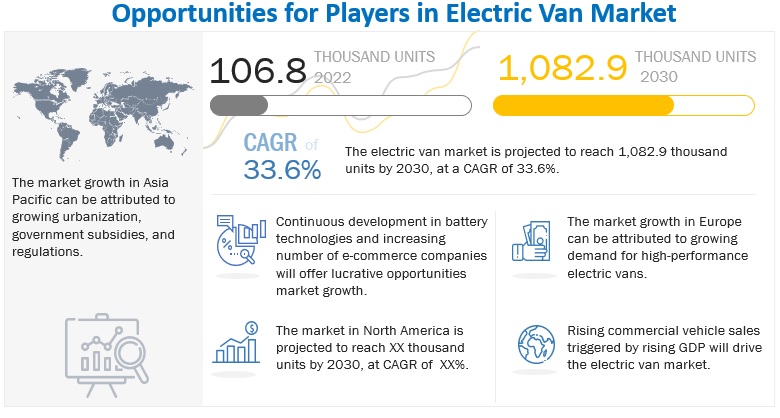
Electric Van Market

To know about the assumptions considered for the study, Request for Free Sample Report

Market Dynamics:

Driver: Increasing demand for emission-free and energy-efficient mass transit solutions

The transport sector is one of the largest contributors to global greenhouse gas (GHG) emissions. According to the United Nations Environment Program (UNEP), the transport sector contributes around one-quarter of greenhouse gas (GHG) emissions and is one of the largest sources of air pollution. Vehicle emissions are responsible for discharging 29% of ozone-depleting substances that bring air pollution and are dangerous to the atmosphere. Various governments across the globe have introduced initiatives to make their urban public transport system more sustainable and fuel-efficient with the use of electric vans. The introduction of electric vans will change mass transit worldwide in the coming years by improving air quality, reducing noise levels, and increasing fuel efficiency.

Restraint: Low vehicle range hampers long-distance logistics

Many electric commercial vehicle fleet owners are concerned about the range or distance covered in a single charge. The driving range of electric vans is shorter than that of ICE commercial vans. Many ECVs cover distances between 80 miles and 120 miles because of the low energy density of batteries. The maximum coverage of an ECV is ~300 miles. Users prefer covering long distances without interruptions, especially for long trips, and a long-range EV is significantly high priced. This factor could inhibit the growth of the electric van market. Various R&D efforts are undertaken to reduce the space required for housing and contacts so that more batteries can be accommodated, and the van range can be increased to approximately 600 miles. FCEVs have a huge opportunity for electric vans due to the less demand for frequent charging (which hampers commercial use in many cases).

Opportunity: Government support for electrification of public transport

In order to drive the commitment to reduce greenhouse gas (GHG) emissions and improve air quality in urban areas, governments across the globe have been providing lucrative fiscal incentives to promote shared mobility and clean transportation. Governments across the globe have launched attractive initiatives and schemes to facilitate the adoption of electric vehicles. Governments in developed countries have begun the tender process to increase the use of ev vans in their cities. For instance, as of March 2022, Royal Mail conducted its delivery using 3,000 electric vans. The roll-out largely follows cities with low-emission zones, including London, Bristol, Glasgow, Cambridge, and Oxford. The induction of e-vans will add to the emission reduction commitments at the local level. The benefits will be much greater with the simultaneous greening of electricity generation in highly populated cities like China, Japan, and India.

Challenge: Lack of charging infrastructure

The growth of the electric van market has been restrained due to the limited availability of supporting infrastructure. Every electric vehicle periodically requires a battery charging facility. Charging infrastructure is installed in urban areas in Europe, North America, and other developed regions. However, the number of charging stations is insufficient. The number of charging stations in Eastern Europe is lesser than that in Northern Europe. In Asia Pacific, China is leading in terms of the availability of charging stations. The time taken to recharge a vehicle further adds to the inconvenience. As of 2022, only a few companies provide fast chargers. As chargers are available in different designs and every charger uses a different connector, finding a suitable charger can be cumbersome. The lack of charging infrastructure is a major problem in developing economies such as India, South Africa, and South Korea. India has adequate infrastructure for internal combustion engine vehicles with as many as 77,000 fuel stations across the country.

Increasing focus on healthcare facilities to drive electric van market for field services

Field services include maintenance, installation, or repair of hardware equipment at the customer’s site. These services are required in sectors such as gas utilities (to repair suspected leaks), healthcare, property maintenance, HVAC (for installation management), telecommunications (for cable installation or other issues), transportation, heavy engineering, and mining. Companies are keen on adopting electric commercial vehicles such as electric vans for daily field operations, maintenance, repair, other field services, and replacing diesel fleets. In March 2022, London Electric Vehicle Company announced its plan to supply 22 VN5 electric vans to Sunbelt Rentals for fleet operations.

Asia Pacific to be major contributor to electric van market growth

Governments in the Asia Pacific region have recognized the growth potential of the automotive industry and have consequently taken different initiatives to encourage major OEMs to enter their domestic markets. Several European and American automobile manufacturers, such as Volkswagen (Germany), Mercedes Benz (Germany), and General Motors (US), have shifted their production plants to emerging economies. Hence, the electric vans market will grow. The Chinese government is also encouraging state governments and public organizations to increase the use of electric vehicles for logistics purposes to more than 50% by 2025. In India, the market is at a nascent stage. However, the government is undertaking various initiatives to promote the use and sale of electric vehicles. These include the National Electric Mobility Mission Plan (NEMMP) and Faster Adoption and Manufacturing of Hybrid & Electric Vehicles (FAME).
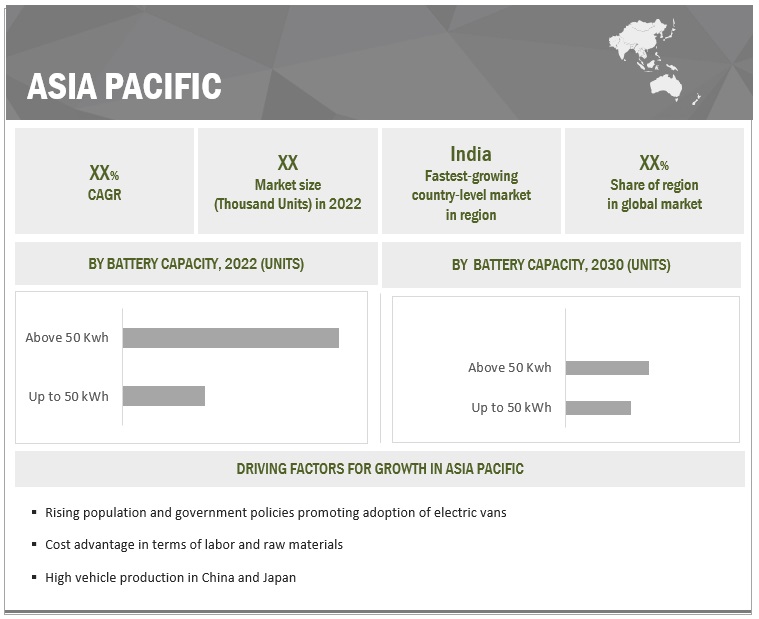
Electric Van Market Size, and Share

To know about the assumptions considered for the study, download the pdf brochure

Key Market Players

The key players considered in the analysis of the electric van market are General Motors (US), Renault (France), Toyota Motor Corporation (Japan), BYD (China), and Ford Motor Company (US). These companies offer extensive products for the automotive industry and have strong distribution networks, and they invest heavily in R&D to develop new products.

Want to explore hidden markets that can drive new revenue in Electric Van Market?

Scope of the Report

Report Metric

Details

Market Revenue in 2022

106.8 thousand units

Estimated Value by 2027

1,082.9 thousand units

Growth Rate

Poised to grow at a CAGR of 33.6%

Market Segmentation

By range (up to 100 miles, 100-200 miles, and above 200 miles), battery capacity (up to 50 kWh and above 50 kWh), battery type, propulsion, and end use

Market Driver

Increasing demand for emission-free and energy-efficient mass transit solutions

Market Opportunity

Government support for electrification of public transport

Geographies covered

North America, Europe, Asia Pacific, and Rest of the World

This research report categorizes the electric van market based on range, battery capacity, battery type, propulsion, end use, and region

By Range
  • Up to 100 Miles
  • 100–200 Miles
  • Above 200 Miles
By Battery Capacity
  • Up to 50 kWh
  • Above 50 kWh
By Battery Type
  • Nickel Manganese Cobalt
  • Lithium-Ion
  • Others
By Propulsion
  • BEV
  • FCEV
  • PHEV
By End Use
  • Last Mile Delivery
  • Refrigerated Services
  • Field Services
  • Distribution Services
By Region
  • North America
  • Asia Pacific
  • Europe

Recent Developments

  • In May 2022, Ford Motor Company launched E-Transit in Europe with a range of 236 miles.
  • In October 2021, BYD launched ETP3 Panel Van with a load capacity of 780 kg and a driving range of 275 km. It is also equipped with a 44.9 kWh battery, a 35 kW rated electric motor, and a top speed of 100 km/hour.
  • In April 2021, Toyota Motor Corporation launched the Proace Electric van which offers a battery capacity of 75 kWh and a range of 175 km.

Frequently Asked Questions (FAQ):

To speak to our analyst for a discussion on the above findings, click Speak to Analyst


Exclusive indicates content/data unique to MarketsandMarkets and not available with any competitors.

TABLE OF CONTENTS
 
1 INTRODUCTION (Page No. - 18)
    1.1 STUDY OBJECTIVES 
    1.2 MARKET DEFINITION 
           1.2.1 ELECTRIC VAN MARKET, BY END USE
           1.2.2 MARKET, BY PROPULSION
           1.2.3 MARKET, BY BATTERY TYPE
    1.3 MARKET: INCLUSIONS AND EXCLUSIONS 
    1.4 MARKET SCOPE 
           1.4.1 MARKETS COVERED
                    FIGURE 1 MARKET SEGMENTATION
           1.4.2 YEARS CONSIDERED
    1.5 CURRENCY CONSIDERED 
           TABLE 1 CURRENCY EXCHANGE RATES (PER USD)
    1.6 STAKEHOLDERS 
 
2 RESEARCH METHODOLOGY (Page No. - 23)
    2.1 RESEARCH DATA 
           FIGURE 2 ELECTRIC VAN MARKET: RESEARCH DESIGN
           2.1.1 SECONDARY DATA
                    2.1.1.1 Key data from secondary sources
                    2.1.1.2 List of secondary sources
           2.1.2 PRIMARY DATA
                    2.1.2.1 Key data from primary sources
                    2.1.2.2 List of participating companies for primary research
                    2.1.2.3 Key industry insights
                    2.1.2.4 Breakdown of primary interviews
                               FIGURE 3 BREAKDOWN OF PRIMARY INTERVIEWS: BY COMPANY, DESIGNATION, AND REGION
    2.2 MARKET SIZE ESTIMATION 
           FIGURE 4 MARKET SIZE ESTIMATION: BOTTOM-UP APPROACH
           2.2.1 BOTTOM-UP APPROACH
                    FIGURE 5 MARKET SIZE ESTIMATION METHODOLOGY FOR MARKET: BOTTOM-UP APPROACH
           2.2.2 TOP-DOWN APPROACH
                    FIGURE 6 MARKET SIZE ESTIMATION METHODOLOGY FOR MARKET: TOP-DOWN APPROACH
    2.3 FACTOR ANALYSIS 
           2.3.1 FACTOR ANALYSIS FOR MARKET SIZING: DEMAND AND SUPPLY SIDES
    2.4 DATA TRIANGULATION 
           FIGURE 7 DATA TRIANGULATION
    2.5 ASSUMPTIONS 
    2.6 RISK ASSESSMENT 
    2.7 RESEARCH LIMITATIONS 
 
3 EXECUTIVE SUMMARY (Page No. - 34)
    FIGURE 8 ELECTRIC VAN MARKET: MARKET DYNAMICS 
    FIGURE 9 MARKET, BY REGION, 2022 VS. 2030 (UNITS) 
    FIGURE 10 MARKET, BY PROPULSION, 2022 VS. 2030 (UNITS) 
 
4 PREMIUM INSIGHTS (Page No. - 37)
    4.1 ATTRACTIVE OPPORTUNITIES FOR PLAYERS IN ELECTRIC VAN MARKET 
           FIGURE 11 INCREASED GOVERNMENT SUBSIDIES FOR ELECTRIC VEHICLES TO DRIVE MARKET
    4.2 MARKET, BY PROPULSION 
           FIGURE 12 BEV PROJECTED TO BE LARGER MARKET (2022–2030) (UNITS)
    4.3 MARKET, BY BATTERY CAPACITY 
           FIGURE 13 ABOVE 50 KWH PROJECTED TO BE LARGEST SEGMENT IN MARKET (2022–2030) (UNITS)
    4.4 MARKET, BY END USE 
           FIGURE 14 LAST MILE DELIVERY SEGMENT TO HAVE HIGHEST GROWTH DURING FORECAST PERIOD (UNITS)
    4.5 MARKET, BY BATTERY TYPE 
           FIGURE 15 LITHIUM-ION SEGMENT TO ACQUIRE LARGER MARKET SHARE, (2022–2030) (UNITS)
    4.6 MARKET, BY RANGE 
           FIGURE 16 100–200 MILES SEGMENT PROJECTED TO BE LARGER SEGMENT OF MARKET, (2022–2030) (UNITS)
    4.7 MARKET, BY REGION 
           FIGURE 17 ASIA PACIFIC ESTIMATED TO ACCOUNT FOR LARGEST MARKET SHARE IN 2022
 
5 MARKET OVERVIEW (Page No. - 41)
    5.1 INTRODUCTION 
           FIGURE 18 ROLE OF STARTUPS IN ELECTRIC VEHICLE ECOSYSTEM
           TABLE 2 IMPACT OF MARKET DYNAMICS
    5.2 MARKET DYNAMICS 
           FIGURE 19 ELECTRIC VAN MARKET: MARKET DYNAMICS
           5.2.1 DRIVERS
                    5.2.1.1 Increased demand for emission-free and energy-efficient mass transit solutions
                               FIGURE 20 EU E-VANS EMISSION TARGETS FOR 2027
                    5.2.1.2 Reduction in battery prices
                               FIGURE 21 DECLINE IN BATTERY PRICE/KWH, 2010–2020
                    5.2.1.3 Lower emissions compared to other vehicles
           5.2.2 RESTRAINTS
                    5.2.2.1 High development cost
                    5.2.2.2 Concerns over battery safety
                               FIGURE 22 BATTERY SAFETY ARCHITECTURE
                    5.2.2.3 Lower vehicle range to hamper long-distance logistics
                               TABLE 3 ELECTRIC VAN DATA BASED ON RANGE
           5.2.3 OPPORTUNITIES
                    5.2.3.1 Government support for electrification of public transport
                               TABLE 4 GOVERNMENT PROGRAMS TO PROMOTE EVS
                    5.2.3.2 Implementation of stringent emission norms and environmental regulations
                               TABLE 5 KEY COUNTRIES: EMISSION REGULATION SPECIFICATIONS OVERVIEW, BY FUEL TYPE, 2016–2021
                    5.2.3.3 Use of electric vans for fleets and commercial applications
                               TABLE 6 MAJOR EV FLEET TARGETS
           5.2.4 CHALLENGES
                    5.2.4.1 Limited battery capacity
                               TABLE 7 BATTERY CAPACITIES OF POPULAR ELECTRIC VANS
                    5.2.4.2 Lack of charging infrastructure
                               TABLE 8 INDIA: SPECIFICATIONS OF CHARGING INFRASTRUCTURE
    5.3 PORTER’S FIVE FORCES 
           FIGURE 23 PORTER’S FIVE FORCES: ELECTRIC VAN MARKET
           TABLE 9 MARKET: IMPACT OF PORTER’S FIVE FORCES
           5.3.1 THREAT OF SUBSTITUTES
           5.3.2 THREAT OF NEW ENTRANTS
           5.3.3 BARGAINING POWER OF BUYERS
           5.3.4 BARGAINING POWER OF SUPPLIERS
           5.3.5 INTENSITY OF COMPETITIVE RIVALRY
    5.4 MACROECONOMIC INDICATORS 
           5.4.1 GDP TRENDS AND FORECAST FOR MAJOR ECONOMIES
                    TABLE 10 GDP TRENDS AND FORECAST, BY MAJOR ECONOMIES, 2018–2026 (USD BILLION)
    5.5 MARKET ECOSYSTEM 
           FIGURE 24 MARKET: ECOSYSTEM ANALYSIS
           5.5.1 OEM
           5.5.2 RAW MATERIAL SUPPLIERS
           5.5.3 COMPONENT MANUFACTURERS
           5.5.4 CHARGING INFRASTRUCTURE
                    TABLE 11 MARKET: ROLE OF COMPANIES IN ECOSYSTEM
    5.6 VALUE CHAIN ANALYSIS 
           FIGURE 25 VALUE CHAIN ANALYSIS
    5.7 PRICING ANALYSIS 
           TABLE 12 MARKET: AVERAGE PRICE (USD), 2022
    5.8 PATENT ANALYSIS 
           TABLE 13 MARKET: PATENTED DOCUMENTS ANALYSIS, BY PUBLISHED, FILED, AND GRANTED (2015–2021)
    5.9 REGULATORY OVERVIEW 
           5.9.1 NORTH AMERICA
                    TABLE 14 NORTH AMERICA: POLICIES AND INITIATIVES SUPPORTING HYDROGEN-POWERED VEHICLES AND HYDROGEN INFRASTRUCTURE
           5.9.2 EUROPE
                    TABLE 15 EUROPE: POLICIES AND INITIATIVES SUPPORTING HYDROGEN-POWERED VEHICLES AND HYDROGEN INFRASTRUCTURE
           5.9.3 ASIA PACIFIC
                    TABLE 16 ASIA PACIFIC: POLICIES AND INITIATIVES SUPPORTING HYDROGEN-POWERED VEHICLES AND HYDROGEN INFRASTRUCTURE
    5.10 CASE STUDIES 
           5.10.1 ADOPTION OF ELECTRIC MOBILITY FOR PUBLIC TRANSPORT IN INDIA
           5.10.2 ELECTRIC VEHICLE FLEETS IN PUBLIC SECTOR
    5.11 TRENDS AND DISRUPTIONS IN MARKET 
                    FIGURE 26 TRENDS AND DISRUPTIONS IN MARKET
    5.12 TECHNOLOGY ANALYSIS 
           5.12.1 SMART CHARGING SYSTEM
                    FIGURE 27 SMART EV CHARGING SYSTEM
           5.12.2 IOT IN ELECTRIC VEHICLES
           5.12.3 PACKAGED FUEL CELL SYSTEM MODULES
                    FIGURE 28 NEW PACKAGED FUEL CELL SYSTEM MODULE BY TOYOTA
           5.12.4 METHANE FUEL CELLS
    5.13 KEY STAKEHOLDERS AND BUYING CRITERIA 
           5.13.1 KEY STAKEHOLDERS IN BUYING PROCESS
                    TABLE 17 INFLUENCE OF INSTITUTIONAL BUYERS ON PURCHASE OF ELECTRIC VANS
           5.13.2 BUYING CRITERIA
    5.14 DETAILED LIST OF CONFERENCES AND EVENTS, 2022–2023 
                    TABLE 18 ELECTRIC VAN MARKET: DETAILED LIST OF CONFERENCES AND EVENTS
    5.15 LIST OF REGULATORY BODIES, GOVERNMENT AGENCIES, AND OTHER ORGANIZATIONS 
                    TABLE 19 ASIA PACIFIC: LIST OF REGULATORY BODIES, GOVERNMENT AGENCIES, AND OTHER ORGANIZATIONS
                    TABLE 20 NORTH AMERICA: LIST OF REGULATORY BODIES, GOVERNMENT AGENCIES, AND OTHER ORGANIZATIONS
                    TABLE 21 EUROPE: LIST OF REGULATORY BODIES, GOVERNMENT AGENCIES, AND OTHER ORGANIZATIONS
    5.16 MARKET, SCENARIOS (2022–2030) 
           5.16.1 MARKET, MOST LIKELY SCENARIO
                    TABLE 22 MARKET (MOST LIKELY), BY REGION, 2022–2030 (UNITS)
           5.16.2 MARKET, OPTIMISTIC SCENARIO
                    TABLE 23 MARKET (OPTIMISTIC), BY REGION, 2022–2030 (UNITS)
           5.16.3 MARKET, PESSIMISTIC SCENARIO
                    TABLE 24 MARKET (PESSIMISTIC), BY REGION, 2022–2030 (UNITS)
 
6 ELECTRIC VAN MARKET, BY RANGE (Page No. - 76)
    6.1 INTRODUCTION 
           FIGURE 29 ABOVE 200 MILES SEGMENT TO REGISTER HIGHER CAGR
           TABLE 25 MARKET, BY RANGE, 2018–2021 (UNITS)
           TABLE 26 MARKET, BY RANGE, 2022–2030 (UNITS)
           6.1.1 OPERATIONAL DATA
                    TABLE 27 ELECTRIC VAN DATA BASED ON RANGE
           6.1.2 ASSUMPTIONS
                    TABLE 28 ASSUMPTIONS: BY RANGE
           6.1.3 RESEARCH METHODOLOGY
    6.2 UP TO 100 MILES 
           6.2.1 AFFORDABLE ELECTRIC VANS TO BOOST SEGMENT
                    TABLE 29 UP TO 100 MILES ELECTRIC VAN MARKET, BY REGION, 2018–2021 (UNITS)
                    TABLE 30 UP TO 100 MILES ELECTRIC VAN MARKET, BY REGION, 2022–2030 (UNITS)
    6.3 100–200 MILES 
           6.3.1 AIDS LONG-DISTANCE TRANSPORT
                    TABLE 31 100–200 MILES ELECTRIC VAN MARKET, BY REGION, 2018–2021 (UNITS)
                    TABLE 32 100–200 MILES ELECTRIC VAN MARKET, BY REGION, 2022–2030 (UNITS)
    6.4 ABOVE 200 MILES 
           6.4.1 ADVANCED BATTERY TECHNOLOGY
                    TABLE 33 ABOVE 200 MILES ELECTRIC VAN MARKET, BY REGION, 2022–2030 (UNITS)
    6.5 KEY PRIMARY INSIGHTS 
 
7 ELECTRIC VAN MARKET, BY BATTERY TYPE (Page No. - 83)
    7.1 INTRODUCTION 
           FIGURE 30 LITHIUM-ION TO DOMINATE MARKET DURING FORECAST PERIOD
           TABLE 34 MARKET, BY BATTERY TYPE, 2018–2021 (UNITS)
           TABLE 35 MARKET, BY BATTERY TYPE, 2022–2030 (UNITS)
           7.1.1 OPERATIONAL DATA
                    TABLE 36 ELECTRIC VAN DATA, BATTERY TYPE
           7.1.2 ASSUMPTIONS
           7.1.3 RESEARCH METHODOLOGY
    7.2 NICKEL MANGANESE COBALT 
           7.2.1 LOW COST AND HIGHER LIFE CYCLE OF NICKEL CELLS TO DRIVE MARKET
                    TABLE 37 NICKEL MANGANESE COBALT BATTERIES MARKET, BY REGION, 2018–2021 (UNITS)
                    TABLE 38 NICKEL MANGANESE COBALT BATTERIES MARKET, BY REGION, 2022–2030 (UNITS)
    7.3 LITHIUM-ION 
           7.3.1 LOW COST OF LITHIUM-ION BATTERIES TO DRIVE MARKET
                    TABLE 39 LITHIUM-ION BATTERIES MARKET, BY REGION, 2018–2021 (UNITS)
                    TABLE 40 LITHIUM-ION BATTERIES MARKET, BY REGION, 2022–2030 (UNITS)
    7.4 OTHERS 
           7.4.1 DEVELOPMENT OF HIGH ENERGY DENSITY AND LOW WEIGHT BATTERIES TO DRIVE MARKET
                    TABLE 41 OTHER BATTERIES MARKET, BY REGION, 2018–2021 (UNITS)
                    TABLE 42 OTHER BATTERIES MARKET, BY REGION, 2022–2030 (UNITS)
    7.5 KEY INDUSTRY INSIGHTS 
 
8 ELECTRIC VAN MARKET, BY END USE (Page No. - 90)
    8.1 INTRODUCTION 
           FIGURE 31 LAST MILE DELIVERY MARKET SEGMENT TO DOMINATE MARKET DURING FORECAST PERIOD
           TABLE 43 MARKET, BY END USE, 2018–2021 (UNITS)
           TABLE 44 MARKET, BY END USE, 2022–2030 (UNITS)
           8.1.1 OPERATIONAL DATA
                    TABLE 45 ELECTRIC VAN DATA, END USE
           8.1.2 ASSUMPTIONS
           8.1.3 RESEARCH METHODOLOGY
    8.2 LAST MILE DELIVERY 
           8.2.1 PRESENCE OF E-COMMERCE COMPANIES TO BOOST MARKET
    8.3 FIELD SERVICES 
           8.3.1 INCREASED USE IN HEALTHCARE FACILITIES
    8.4 DISTRIBUTION SERVICES 
           8.4.1 GROWTH OF LOGISTICS SECTOR TO DRIVE MARKET
    8.5 REFRIGERATED SERVICES 
           8.5.1 NEED TO DISTRIBUTE GOODS AT SPECIFIC TEMPERATURES TO FUEL MARKET
    8.6 KEY INDUSTRY INSIGHTS 
 
9 ELECTRIC VAN MARKET, BY BATTERY CAPACITY (Page No. - 96)
    9.1 INTRODUCTION 
           FIGURE 32 ABOVE 50 KWH SEGMENT TO LEAD MARKET
           TABLE 46 MARKET, BY BATTERY CAPACITY, 2018–2021 (UNITS)
           TABLE 47 MARKET, BY BATTERY CAPACITY, 2022–2030 (UNITS)
           9.1.1 OPERATIONAL DATA
                    TABLE 48 ELECTRIC VAN VEHICLE MODELS, BY BATTERY CAPACITY
           9.1.2 ASSUMPTIONS
                    TABLE 49 ASSUMPTIONS: BY BATTERY CAPACITY
           9.1.3 RESEARCH METHODOLOGY
    9.2 UP TO 50 KWH 
           9.2.1 INTRACITY DELIVERY USING ELECTRIC VANS TO DRIVE SEGMENT
                    TABLE 50 UP TO 50 KWH: MARKET, BY REGION, 2018–2021 (UNITS)
                    TABLE 51 UP TO 50 KWH: MARKET, BY REGION, 2022–2030 (UNITS)
    9.3 ABOVE 50 KWH 
           9.3.1 HEAVY-DUTY ELECTRIC VANS TO LEAD MARKET
                    TABLE 52 ABOVE 50 KWH: MARKET, BY REGION, 2018–2021 (UNITS)
                    TABLE 53 ABOVE 50 KWH: MARKET, BY REGION, 2022–2030 (UNITS)
    9.4 KEY INDUSTRY INSIGHTS 
 
10 ELECTRIC VAN MARKET, BY PROPULSION (Page No. - 103)
     10.1 INTRODUCTION 
               FIGURE 33 BEV SEGMENT TO ACQUIRE MAJOR MARKET SHARE DURING FORECAST PERIOD
               TABLE 54 MARKET, BY PROPULSION, 2018–2021 (UNITS)
               TABLE 55 MARKET, BY PROPULSION, 2022–2030 (UNITS)
             10.1.1 OPERATIONAL DATA
                       TABLE 56 ELECTRIC VAN DATA BASED ON PROPULSION TYPE
             10.1.2 ASSUMPTIONS
             10.1.3 RESEARCH METHODOLOGY
     10.2 BEV 
             10.2.1 INCREASED DEMAND FOR ZERO-EMISSION VEHICLES TO BOOST SEGMENT
                       TABLE 57 BEV MARKET, BY REGION, 2018–2021 (UNITS)
                       TABLE 58 BEV MARKET, BY REGION, 2022–2030 (UNITS)
     10.3 FCEV 
             10.3.1 SHIFT TOWARD FUEL CELL ELECTRIC VEHICLES TO DRIVE SEGMENT
                       TABLE 59 FCEV MARKET, BY REGION, 2022–2030 (UNITS)
     10.4 PHEV 
             10.4.1 IMPROVEMENT IN CHARGING INFRASTRUCTURE TO DRIVE SEGMENT
                       TABLE 60 PHEV MARKET, BY REGION, 2018–2021 (UNITS)
                       TABLE 61 PHEV MARKET, BY REGION, 2022–2030 (UNITS)
     10.5 KEY INDUSTRY INSIGHTS 
 
11 ELECTRIC VAN MARKET, BY REGION (Page No. - 110)
     11.1 INTRODUCTION 
               FIGURE 34 EUROPE TO ACCOUNT FOR LARGEST SIZE OF ELECTRIC VAN MARKET, 2022 VS. 2030 (UNITS)
               TABLE 62 MARKET, BY REGION, 2018–2021 (UNITS)
               TABLE 63 MARKET, BY REGION, 2022–2030 (UNITS)
     11.2 ASIA PACIFIC 
               TABLE 64 ASIA PACIFIC: MARKET, BY COUNTRY, 2018–2021 (UNITS)
               TABLE 65 ASIA PACIFIC: MARKET, BY COUNTRY, 2022–2030 (UNITS)
               FIGURE 35 ASIA PACIFIC: MARKET SNAPSHOT
             11.2.1 CHINA
                       11.2.1.1 High production of vehicles to boost market
                                   TABLE 66 CHINA: MARKET, BY PROPULSION, 2018–2021 (UNITS)
                                   TABLE 67 CHINA: MARKET, BY PROPULSION, 2022–2030 (UNITS)
             11.2.2 JAPAN
                       11.2.2.1 Driven by technological advancements
                                   TABLE 68 JAPAN: MARKET, BY PROPULSION, 2018–2021 (UNITS)
                                   TABLE 69 JAPAN: MARKET, BY PROPULSION, 2022–2030 (UNITS)
             11.2.3 SOUTH KOREA
                       11.2.3.1 Increased investments in electric vehicles
                                   TABLE 70 SOUTH KOREA: MARKET, BY PROPULSION, 2018–2021 (UNITS)
                                   TABLE 71 SOUTH KOREA: MARKET, BY PROPULSION, 2022–2030 (UNITS)
             11.2.4 INDIA
                       11.2.4.1 Increased market for last mile delivery
                                   TABLE 72 INDIA: MARKET, BY PROPULSION, 2022–2030 (UNITS)
     11.3 EUROPE 
               TABLE 73 EUROPE: MARKET, BY COUNTRY, 2018–2021 (UNITS)
               TABLE 74 EUROPE: MARKET, BY COUNTRY, 2022–2030 (UNITS)
             11.3.1 GERMANY
                       11.3.1.1 Presence of major players
                                   TABLE 75 GERMANY: MARKET, BY PROPULSION, 2018–2021 (UNITS)
                                   TABLE 76 GERMANY: MARKET, BY PROPULSION, 2022–2030 (UNITS)
             11.3.2 UK
                       11.3.2.1 Investments in ultra-low emission vehicles
                                   TABLE 77 UK: MARKET, BY PROPULSION, 2018–2021 (UNITS)
                                   TABLE 78 UK: MARKET, BY PROPULSION, 2022–2030 (UNITS)
             11.3.3 NETHERLANDS
                       11.3.3.1 Heavy investments by OEMs to increase production bases
                                   TABLE 79 NETHERLANDS: MARKET, BY PROPULSION, 2018–2021 (UNITS)
                                   TABLE 80 NETHERLANDS: MARKET, BY PROPULSION, 2022–2030 (UNITS)
             11.3.4 NORWAY
                       11.3.4.1 Logistics industry to replace conventional means of transport with electric vans
                                   TABLE 81 NORWAY: MARKET, BY PROPULSION, 2018–2021 (UNITS)
                                   TABLE 82 NORWAY: MARKET, BY PROPULSION, 2022–2030 (UNITS)
             11.3.5 FRANCE
                       11.3.5.1 Purchase grants by government
                                   TABLE 83 FRANCE: MARKET, BY PROPULSION, 2018–2021 (UNITS)
                                   TABLE 84 FRANCE: MARKET, BY PROPULSION, 2022–2030 (UNITS)
             11.3.6 ITALY
                       11.3.6.1 Government focus on greener vehicles
                                   TABLE 85 ITALY: MARKET, BY PROPULSION, 2018–2021 (UNITS)
                                   TABLE 86 ITALY: MARKET, BY PROPULSION, 2022–2030 (UNITS)
             11.3.7 DENMARK
                       11.3.7.1 Government promotion of private infrastructure
                                   TABLE 87 DENMARK: MARKET, BY PROPULSION, 2018–2021 (UNITS)
                                   TABLE 88 DENMARK: MARKET, BY PROPULSION, 2022–2030 (UNITS)
             11.3.8 PORTUGAL
                       11.3.8.1 Expansion of electric vehicle charging infrastructure
                                   TABLE 89 PORTUGAL: MARKET, BY PROPULSION, 2018–2021 (UNITS)
                                   TABLE 90 PORTUGAL: MARKET, BY PROPULSION, 2022–2030 (UNITS)
             11.3.9 IRELAND
                       11.3.9.1 Presence of popular e-van manufacturers
                                   TABLE 91 IRELAND: MARKET, BY PROPULSION, 2018–2021 (UNITS)
                                   TABLE 92 IRELAND: MARKET, BY PROPULSION, 2022–2030 (UNITS)
             11.3.10 BELGIUM
                       11.3.10.1 High adoption rate of electric commercial vehicles
                                   TABLE 93 BELGIUM: MARKET, BY PROPULSION, 2018–2021 (UNITS)
                                   TABLE 94 BELGIUM: MARKET, BY PROPULSION, 2022–2030 (UNITS)
             11.3.11 SWITZERLAND
                       11.3.11.1 Increased awareness of vehicle emissions
                                   TABLE 95 SWITZERLAND: MARKET, BY PROPULSION, 2018–2021 (UNITS)
                                   TABLE 96 SWITZERLAND: MARKET, BY PROPULSION, 2022–2030 (UNITS)
             11.3.12 AUSTRIA
                       11.3.12.1 Increasing postal services
                                   TABLE 97 AUSTRIA: MARKET, BY PROPULSION, 2018–2021 (UNITS)
                                   TABLE 98 AUSTRIA: MARKET, BY PROPULSION, 2022–2030 (UNITS)
             11.3.13 SPAIN
                       11.3.13.1 Increasing market for B2C services
                                   TABLE 99 SPAIN: MARKET, BY PROPULSION, 2018–2021 (UNITS)
                                   TABLE 100 SPAIN: MARKET, BY PROPULSION, 2022–2030 (UNITS)
             11.3.14 SWEDEN
                       11.3.14.1 Increased market for refrigerated services
                                   TABLE 101 SWEDEN: MARKET, BY PROPULSION, 2018–2021 (UNITS)
                                   TABLE 102 SWEDEN: MARKET, BY PROPULSION, 2022–2030 (UNITS)
     11.4 NORTH AMERICA 
               TABLE 103 NORTH AMERICA: MARKET, BY COUNTRY, 2018–2021 (UNITS)
               TABLE 104 NORTH AMERICA: MARKET, BY COUNTRY, 2022–2030 (UNITS)
               FIGURE 36 NORTH AMERICA: MARKET SNAPSHOT
             11.4.1 US
                       11.4.1.1 Increased production capacity of electric vehicles
                                   TABLE 105 US: MARKET, BY PROPULSION, 2018–2021 (UNITS)
                                   TABLE 106 US: MARKET, BY PROPULSION, 2022–2030 (UNITS)
             11.4.2 CANADA
                       11.4.2.1 Increased use of LCVs
                                   TABLE 107 CANADA: MARKET, BY PROPULSION, 2018–2021 (UNITS)
                                   TABLE 108 CANADA: MARKET, BY PROPULSION, 2022–2030 (UNITS)
 
12 COMPETITIVE LANDSCAPE (Page No. - 138)
     12.1 OVERVIEW 
     12.2 MARKET SHARE ANALYSIS FOR ELECTRIC VAN MARKET 
               TABLE 109 MARKET SHARE ANALYSIS, 2021
               FIGURE 37 MARKET SHARE ANALYSIS, 2021
             12.2.1 GENERAL MOTORS
             12.2.2 RENAULT
             12.2.3 TOYOTA MOTOR CORPORATION
             12.2.4 BYD
             12.2.5 FORD MOTOR COMPANY
     12.3 KEY PLAYER STRATEGIES 
               TABLE 110 OVERVIEW OF STRATEGIES ADOPTED BY PLAYERS IN MARKET
     12.4 REVENUE ANALYSIS OF TOP LISTED/PUBLIC PLAYERS 
               FIGURE 38 TOP PUBLIC/LISTED PLAYERS DOMINATING MARKET DURING LAST FIVE YEARS
     12.5 COMPETITIVE SCENARIO 
             12.5.1 NEW PRODUCT LAUNCHES
                       TABLE 111 NEW PRODUCT LAUNCHES, 2018–2022
             12.5.2 DEALS
                       TABLE 112 DEALS, 2018–2022
             12.5.3 OTHERS
                       TABLE 113 OTHERS, 2018–2022
     12.6 COMPANY EVALUATION QUADRANT 
             12.6.1 STARS
             12.6.2 EMERGING LEADERS
             12.6.3 PERVASIVE PLAYERS
             12.6.4 PARTICIPANTS
                       FIGURE 39 MARKET: COMPANY EVALUATION QUADRANT, 2022
                       TABLE 114 MARKET: COMPANY FOOTPRINT, 2022
                       TABLE 115 MARKET: PRODUCT FOOTPRINT, 2022
                       TABLE 116 MARKET: REGIONAL FOOTPRINT, 2022
     12.7 STARTUP/SME EVALUATION QUADRANT 
             12.7.1 PROGRESSIVE COMPANIES
             12.7.2 RESPONSIVE COMPANIES
             12.7.3 DYNAMIC COMPANIES
             12.7.4 STARTING BLOCKS
                       FIGURE 40 MARKET: STARTUP/SME EVALUATION QUADRANT, 2022
                       TABLE 117 MARKET: DETAILED LIST OF KEY STARTUPS/SMES
                       TABLE 118 MARKET: COMPETITIVE BENCHMARKING OF KEY PLAYERS [STARTUPS/SMES]
 
13 COMPANY PROFILES (Page No. - 152)
(Business overview, Products offered, Recent developments & MnM View)*
     13.1 KEY PLAYERS 
             13.1.1 GENERAL MOTORS
                       TABLE 119 GENERAL MOTORS: BUSINESS OVERVIEW
                       FIGURE 41 GENERAL MOTORS: COMPANY SNAPSHOT
                       TABLE 120 GENERAL MOTORS: PRODUCTS OFFERED
                       TABLE 121 GENERAL MOTORS: NEW PRODUCT DEVELOPMENTS
                       TABLE 122 GENERAL MOTORS: DEALS
                       TABLE 123 GENERAL MOTORS: OTHERS
             13.1.2 RENAULT
                       TABLE 124 RENAULT: BUSINESS OVERVIEW
                       FIGURE 42 RENAULT: COMPANY SNAPSHOT
                       TABLE 125 RENAULT: PRODUCTS OFFERED
                       TABLE 126 RENAULT: NEW PRODUCT DEVELOPMENTS
                       TABLE 127 RENAULT: DEALS
                       TABLE 128 RENAULT: OTHERS
             13.1.3 TOYOTA MOTOR CORPORATION
                       TABLE 129 TOYOTA MOTOR CORPORATION: BUSINESS OVERVIEW
                       FIGURE 43 TOYOTA MOTOR CORPORATION: COMPANY SNAPSHOT
                       FIGURE 44 GLOBAL DATA BY REGION
                       TABLE 130 TOYOTA MOTOR CORPORATION: PRODUCTS OFFERED
                       TABLE 131 TOYOTA MOTOR CORPORATION: NEW PRODUCT DEVELOPMENTS
                       TABLE 132 TOYOTA MOTOR CORPORATION: DEALS
                       TABLE 133 TOYOTA MOTOR CORPORATION: OTHERS
             13.1.4 BYD
                       TABLE 134 BYD: BUSINESS OVERVIEW
                       FIGURE 45 BYD: COMPANY SNAPSHOT
                       TABLE 135 BYD: PRODUCTS OFFERED
                       TABLE 136 BYD: NEW PRODUCT DEVELOPMENTS
                       TABLE 137 BYD: DEALS
                       TABLE 138 BYD: OTHERS
             13.1.5 FORD MOTOR COMPANY
                       TABLE 139 FORD MOTOR COMPANY: BUSINESS OVERVIEW
                       FIGURE 46 FORD MOTOR COMPANY: COMPANY SNAPSHOT
                       TABLE 140 FORD MOTOR COMPANY: PRODUCTS OFFERED
                       TABLE 141 FORD MOTOR COMPANY: NEW PRODUCT DEVELOPMENTS
                       TABLE 142 FORD MOTOR COMPANY: DEALS
                       TABLE 143 FORD MOTOR COMPANY: OTHERS
             13.1.6 NISSAN MOTOR CORPORATION
                       TABLE 144 NISSAN MOTOR CORPORATION: BUSINESS OVERVIEW
                       FIGURE 47 NISSAN MOTOR CORPORATION: COMPANY SNAPSHOT
                       FIGURE 48 GLOBAL VEHICLE RETAIL SALES (2021)
                       TABLE 145 NISSAN MOTOR CORPORATION: PRODUCTS OFFERED
                       TABLE 146 NISSAN MOTOR CORPORATION: NEW PRODUCT DEVELOPMENTS
                       TABLE 147 NISSAN MOTOR CORPORATION: DEALS
                       TABLE 148 NISSAN MOTOR CORPORATION: OTHERS
             13.1.7 MAHINDRA & MAHINDRA LTD.
                       TABLE 149 MAHINDRA & MAHINDRA LTD.: BUSINESS OVERVIEW
                       FIGURE 49 MAHINDRA & MAHINDRA LTD.: COMPANY SNAPSHOT
                       FIGURE 50 MAHINDRA & MAHINDRA LTD.: MANUFACTURING PLANTS IN INDIA
                       FIGURE 51 MANUFACTURING FACILITIES GLOBALLY
                       TABLE 150 MAHINDRA & MAHINDRA LTD.: PRODUCTS OFFERED
                       TABLE 151 MAHINDRA & MAHINDRA LTD: DEALS
                       TABLE 152 MAHINDRA & MAHINDRA LTD.: OTHERS
             13.1.8 IVECO
                       TABLE 153 IVECO: BUSINESS OVERVIEW
                       TABLE 154 IVECO: PRODUCTS OFFERED
                       TABLE 155 IVECO: NEW PRODUCT DEVELOPMENTS
                       TABLE 156 IVECO: DEALS
             13.1.9 LONDON ELECTRIC VEHICLE COMPANY
                       TABLE 157 LONDON ELECTRIC VEHICLE COMPANY: BUSINESS OVERVIEW
                       TABLE 158 LONDON ELECTRIC VEHICLE COMPANY: PRODUCTS OFFERED
                       TABLE 159 LONDON ELECTRIC VEHICLE COMPANY: NEW PRODUCT DEVELOPMENTS
                       TABLE 160 LONDON ELECTRIC VEHICLE COMPANY: DEALS
             13.1.10 FIAT
                       TABLE 161 FIAT: BUSINESS OVERVIEW
                       TABLE 162 FIAT: PRODUCTS OFFERED
                       TABLE 163 FIAT: NEW PRODUCT DEVELOPMENTS
                       TABLE 164 FIAT: DEALS
*Details on Business overview, Products offered, Recent developments & MnM View might not be captured in case of unlisted companies.
     13.2 OTHER PLAYERS 
             13.2.1 YINLONG ENERGY
             13.2.2 GOLDEN DRAGON
             13.2.3 RIVIAN
             13.2.4 ZENITH MOTORS
             13.2.5 WORKHORSE GROUP
             13.2.6 ARRIVAL
             13.2.7 KINGSTAR VEHICLE CO., LTD.
             13.2.8 CHANJE ENERGY
             13.2.9 LIGHTNING EMOTORS
             13.2.10 KING LONG
             13.2.11 CHANGSHA SUNDA NEW ENERGY TECHNOLOGY CO., LTD.
 
14 RECOMMENDATIONS BY MARKETSANDMARKETS (Page No. - 188)
     14.1 BATTERY ELECTRIC VEHICLES TO BE KEY FOCUS MARKET FOR ELECTRIC VANS 
     14.2 REFRIGERATED SERVICES SEGMENT TO BE MAJOR MARKET FOR ELECTRIC VANS 
     14.3 CONCLUSION 
 
15 APPENDIX (Page No. - 189)
     15.1 KEY INSIGHTS FROM INDUSTRY EXPERTS 
     15.2 DISCUSSION GUIDE 
     15.3 KNOWLEDGESTORE: MARKETSANDMARKETS’ SUBSCRIPTION PORTAL 
     15.4 CUSTOMIZATION OPTIONS 
     15.5 RELATED REPORTS 
     15.6 AUTHOR DETAILS 

The study involved four major activities in estimating the current size of the electric van market. Exhaustive secondary research was carried out to collect information on the market, the peer market, and the parent market. The next step was to validate these findings, assumptions, and sizing with the industry experts across value chains through primary research. The top-down and bottom-up approaches were employed to estimate the complete market size. Thereafter, market breakdown and data triangulation processes were used to estimate the market size of segments and subsegments.

Secondary Research

In the secondary research process, various secondary sources such as company annual reports/presentations, press releases, and industry association publications [for example, International Council on Clean Transportation (ICCT); Society of Manufacturers of Electric Vehicles (SMEV); corporate filings, such as annual reports, investor presentations, and financial statements; and trade, business] were used to identify and collect information useful for an extensive commercial study of the electric van market.

Primary Research

Extensive primary research was conducted after acquiring an understanding of the electric van market scenario through secondary research. Several primary interviews were conducted with market experts from both the demand (electric van manufacturers, country-level government associations, and trade associations) and supply (OEMs and component manufacturers) sides across major regions, namely, Asia Pacific, Europe, and North America, and primary interviews were conducted from the demand and supply sides, respectively. Primary data was collected through questionnaires, emails, and telephonic interviews. In the canvassing of primaries, various departments within organizations, such as sales, operations, and administration, were covered to provide a holistic viewpoint in this report.

After interacting with industry experts, brief sessions with highly experienced independent consultants were conducted to reinforce the findings from the primaries. This, along with the in-house subject-matter experts’ opinions, led to the findings described in the remainder of this report.
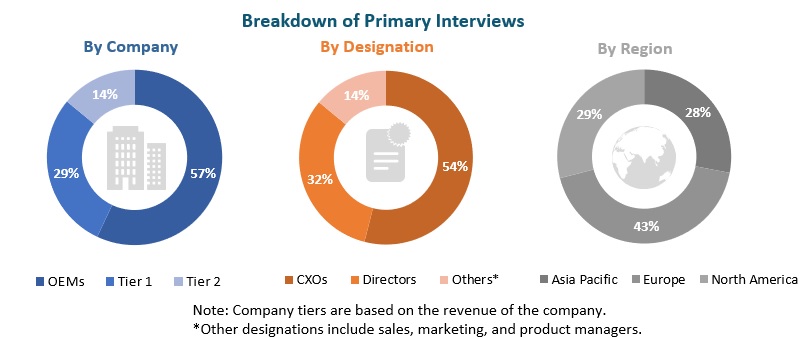
Electric Van Market Size, and Share

To know about the assumptions considered for the study, download the pdf brochure

Market Size Estimation

A detailed market estimation approach was followed to estimate and validate the volume of the electric van market and other dependent submarkets, as mentioned below:

  • Key players in the market were identified through secondary research, and their market shares were determined through primary and secondary research
  • The research methodology included the study of the annual and quarterly financial reports & regulatory filings of major market players, as well as interviews with industry experts for detailed market insights
  • All major penetration rates, percentage shares, splits, and breakdowns for the market were determined using secondary sources and verified through primary sources
  • All key macro indicators affecting the revenue growth of the market segments and subsegments were accounted for, viewed in extensive detail, verified through primary research, and analyzed to get the validated and verified quantitative & qualitative data
  • The gathered market data was consolidated and added with detailed inputs, analyzed, and presented in this report

Data Triangulation

After arriving at the overall market size—using the market size estimation processes as explained above—the market was split into several segments and subsegments. To complete the overall market engineering process and arrive at the exact statistics of each market segment and subsegment, data triangulation and market breakdown procedures were employed, wherever applicable. The data was triangulated by studying various factors and trends from both the demand and supply sides.

Report Objectives

  • To analyze the electric van market and forecast its size, in terms of volume (from 2022 to 2030)
  • To provide detailed information regarding major factors influencing the growth of the market (drivers, restraints, opportunities, and challenges)
  • To segment the market and forecast its size, by volume, based on range
  • To segment the market and forecast its size, by volume, based on battery capacity
  • To segment the market and forecast its size, by volume, based on battery type
  • To segment the market and forecast its size, by volume, based on propulsion
  • To segment the market and forecast its size, by volume, based on end use
  • To segment the market and forecast its size, by volume, based on region (Asia Pacific, Europe, and North America)
  • To strategically profile key players and comprehensively analyze their market shares and core competencies
  • To track and analyze competitive developments such as new product developments, deals, and other activities carried out by key industry participants.

Available Customizations

With the given market data, MarketsandMarkets offers customizations in line with company-specific needs.

  • Electric Van Market, by end use, by country
  • Electric Van Market, by battery type, by country
  • Electric Van Market, by battery capacity, by country
Custom Market Research Services

We will customize the research for you, in case the report listed above does not meet with your exact requirements. Our custom research will comprehensively cover the business information you require to help you arrive at strategic and profitable business decisions.

Request Customization

Instant Answers with GPT - Ask Now!

Ask real questions. Get complete answers !
Report Code
AT 8502
Published ON
Nov, 2022
Choose License Type
BUY NOW
  • SHARE
X
Request Customization
Speak to Analyst
Speak to Analyst
OR FACE-TO-FACE MEETING
PERSONALIZE THIS RESEARCH
  • Triangulate with your Own Data
  • Get Data as per your Format and Definition
  • Gain a Deeper Dive on a Specific Application, Geography, Customer or Competitor
  • Any level of Personalization
REQUEST A FREE CUSTOMIZATION
LET US HELP YOU!
  • What are the Known and Unknown Adjacencies Impacting the Electric Van Market
  • What will your New Revenue Sources be?
  • Who will be your Top Customer; what will make them switch?
  • Defend your Market Share or Win Competitors
  • Get a Scorecard for Target Partners
CUSTOMIZED WORKSHOP REQUEST
knowledgestore logo

Want to explore hidden markets that can drive new revenue in Electric Van Market?

Find Hidden Markets
  • Call Us
  • +1-888-600-6441 (Corporate office hours)
  • +1-888-600-6441 (US/Can toll free)
  • +44-800-368-9399 (UK office hours)
CONNECT WITH US
ABOUT TRUST ONLINE
©2024 MarketsandMarkets Research Private Ltd. All rights reserved
DMCA.com Protection Status
Website Feedback