Digital Holography Market by Offering (Hardware and Software), Application (Microscopy, Holographic Display, Holographic Telepresence), Vertical (Commercial, Medical, Automotive), Technique, Process, Region - Global Forecast to 2024


The digital holography market is expected to grow from USD 2.7 billion in 2020 to USD 5.4 billion by 2024, at a CAGR of 19.8%. The factors such as rising demand for digital holography in medical and commercial applications, growing adoption of digital holography in financial sector for security purposes, and increasing use of digital holography microscopy for precise measurement drive the demand for digital holography.

Digital Holography Market Dynamics
Driver: Increasing use of digital holography microscopy for precise measurment
Digital holography allows the quantitative measurement of shape and displacements of objects by recording holograms with digital cameras and reconstructing them numerically. The technology enables fast and highly precise measurement of 3D geometries. The technology is being increasingly used for the inspection of turbine engine components as holography inspection has eliminated compressor seal bond failures, yielded large financial savings to manufacturers and greatly enhanced customer satisfaction and cost savings. With diminishing fault tolerance in automobile production, digital holography is becoming suitable for the inspection and detection of faults. Thus, all these benefits of digital holography microscopy are expected to boost the market in the coming years.
Restraint: High cost of digital holographic products
The initial capital investment required for acquiring digital holographic microscopy devices or holographic displays is too high. The technology is typically expensive, with high costs driven by objective lenses and the use of specialized digital imaging devices. Moreover, due to the high computational cost of processing holograms, the technology has a limited number of applications. When holography is used for 3D imaging techniques, large amounts of processing power, memory, and storage are required for computing holographic reconstructions.
Opportunity: Latent opportunities for digital holographic solutions from countries in APAC
In APAC, digital holography (DH) has emerged as a front-runner for phase imaging by providing the quantitative phase measurements of wavefields with high accuracy and in near real-time. Digital holography (DH) is used to investigate engineered surfaces at the microscale level owing to its high precision and fast reconstruction rate. The technology is widely being used in industrial applications. APAC has a number of economies with varying development levels and a wide variety of industries. Major emerging economies such as India, Indonesia, and China have huge potential to adopt the technology as there has been an increasing growth of consumer electronics & automotive industries in the region.
Challenge: Lack of technological awareness in market
There has been a growing demand for digital holography in different applications. However, there is a startling gap in awareness about key technologies among professionals. Despite numerous technological advancements in the particular field, certain issues such as the positioning and assembling of the setup for an exact projection of holographic display still present a challenge for this market. There are only a few skilled technicians in the field of holographic displays. Another challenge is to build a true 3D display based on holographic technology that is practical, as well as commercially viable. The deflection of light requires features that are similar to the wavelength of light that is less than a micron. This is a major technical concern and poses a challenge for the display design from the point of view of manufacturing, computation, and bandwidth.
Market for software segment is expected to grow at higher CAGR during forecast period
Software algorithms are used in computers for the reconstruction of holographic images. In advanced systems, these algorithms produce high-quality images with 3D visualization in less time. In digital holographic display and holographic telepresence, computerized algorithms are increasingly being used for image processing. This is expected to boost the development of software packages for projection, imaging, and reconstruction purposes.
Digital holographic display to hold largest share of the digital holograpy market during forecast period
Rapid improvements in spatial light modulators and fast computers offer high-pixel density, which enables natural, colorful, and high-quality 3D motion-picture image formation on a holographic display without using lenses. These displays tailor light fields to resemble realistic 3D images with motion parallax and continuous depth cues. However, holographic displays available today can only provide a subset of the required visual cues due to inherent limitations such as low resolutions and angular Field-of- View (FoV). Yet improvements and steady developments in photonics, microelectronics, and computer engineering are expected to lead to the development of full parallax digital holography displays with acceptable rendering quality.
Commercial vertical expected to hold largest market share during forecast period
The commercial vertical includes education, banking, hospitality, retail, and corporate. Digital holographic technology offers spectacular results with regard to visual effects when used in shows, live events, product launches, advertising, and promotions using digital signage and interactive kiosks, exhibitions, presentations, and conferences. Digital electroholographic display technology is an ultimate solution for 3- dimensional displays as it offers perfect 3-dimensional visual cues. Retailers are focusing on the methods of differentiating themselves to attract more customers. Thus, they are adopting digital holographic displays to improve engagement with their customers through alluring and memorable experiences. Utilizing holographic point of sale (POS) visuals helps to increase and improve customer flow and engagement.
North America expected to account for largest market share from 2020 to 2025
North America is technologically advanced, and an early adopter of emerging technologies is expected to be a front runner in the global digital holography market. Additionally, North America is home to major vendors of digital holography solutions; the high demand for holographic solutions in various industries such as commercial, aerospace & defense, medical, and other is a dominant driving force substantiating the market growth in the region. There has been an escalated demand for holographic displays for commercial applications by retailers.

Key Market Players
Some of the major players operating in the market are Lyncee Tec (Switzerland), Holoxica Limited (UK), RealView Imaging (Israel), HoloTech Switzerland AG (Switzerland), EON Reality (US), Geola Technologies (Lithuania), Holmarc Opto- Mechatronics (India), Ovizio Imaging Systems (Belgium), Leia (US), and Phase Holographic Imaging (Sweden).
Scope of the Report
|
Report Metric |
Details |
|
Market size available for years |
2016�2024 |
|
Base year considered |
2018 |
|
Forecast period |
2019�2024 |
|
Forecast units |
Value (USD) |
|
Segments covered |
Offering, Application, Vertical, Process Type, Techniques, and Region |
|
Geographies covered |
North America, Europe, APAC, and RoW |
|
Companies covered |
Lyncee Tec (Switzerland), Holoxica Limited (UK), RealView Imaging (Israel), HoloTech Switzerland AG (Switzerland), EON Reality (US), Geola Technologies (Lithuania), Holmarc Opto- Mechatronics (India), Ovizio Imaging Systems (Belgium), Leia (US), and Phase Holographic Imaging (Sweden), MetroLaser (US), MDH Hologram (UK), Holotronica (UK), Light Logics Holography and Optics (India), Digitos Technologies (India), Realfiction (Denmark), Intelligent Imaging Innovations (US), Metrolaser (US), Jasper Display Corp. (Taiwan), HOLOEYE Photonics (Germany), and Trimos (Switzerland). |
In this research report, the digital holography market has been segmented on the basis of offering, application, vertical, process type, techniques, and geography.
Digital Holography Market, by Process Type
- Digital Recording
- Reconstruction
Digital Holography Market, by Techniques
- Off-axis Holography
- In-line (Gabor) Holography
Digital Holography Market, by Offering
- Hardware
- Software
Digital Holography Market, by Application
- Digital Holography Microscopy
- Digital Holographic Displays
- Holographic Telepresence
Digital Holography Market, by Vertical
- Medical
- Commercial
- Aerospace & Defense
- Automotive
- Consumer
- Others (Industrial, Metrology, etc.)
Digital Holography Market, by Geography
- North America
- Europe
- APAC
- RoW
Recent Developments
- In October 2019, Eon Reality partnered with SUS Co., Ltd. (Kyoto) and its subsidiary, Cross Reality Co., Ltd to establish VR Innovation Academy in Kyoto, Japan. The VR Innovation Academy will develop the required capabilities and capacities in the field of Augmented and Virtual Reality (AVR) solutions in the Kansai region.
- In June 2019, Holoxica demonstrated Looking Glass 3D display at Heriot Watt. The display offers full color 3D images in real time. No glasses or headsets are required, and multiple viewers can see the 3D image simultaneously (typically 3 to 5 people). It can directly replace current AR/VR headsets, which are inconvenient, uncomfortable, and a big barrier to 3D visualization.
- In January 2019, Lyncee signed an agreement with Elliot Scientific (UK). The agreement allows Elliot Scientific to distribute Lync�e Tec�s range of holographic microscopes for different applications. The agreement will help Lyncee to enhance its geographic reach and effectively cater to different markets.
- In June 2018,Lyncee introduced Digital Holographic Camera. The camera provides marker-free non-invasive images of cells and allows to characterize them without perturbation. The launch helped the company to further strengthen its product portfolio.
- In August 2017, Realview imaging partnered with Intel Corp. (US) to power its HOLOSCOPE-I with Intel�s RealSense SR300-Series Camera. By combining Intel�s computer vision technology with RealView imaging�s holographic technology, the HOLOSCOPE- uniquely enables close-range, direct manipulation of holograms.
Frequently Asked Questions (FAQ):
Where will be the latent opportunities for digital holography market?
In APAC, digital holography (DH) has emerged as a front-runner for phase imaging by providing the quantitative phase measurements of wavefields with high accuracy and in near real-time. The technology is widely being used in industrial applications. APAC has a number of economies with varying development levels and a wide variety of industries. Major emerging economies such as India, Indonesia, and China have huge potential to adopt the technology as there has been an increasing growth of consumer electronics & automotive industries in the region.
Who are the important players in the digital holography market?
The digital holography market is highly competitive, with a large number of global and regional players operating in the ecosystem. Lyncee Tec (Switzerland), Holoxica Limited (UK), RealView Imaging (Israel), HoloTech Switzerland AG (Switzerland), EON Reality (US), Geola Technologies (Lithuania), Holmarc Opto- Mechatronics (India), Ovizio Imaging Systems (Belgium), Leia (US), and Phase Holographic Imaging (Sweden) are a few of the leading players in this market.
Which are the prevalent applications of digital holography?
Digital holography is used today for various purposes, such as microscopy, interferometry, surface measurements, storage, and three-dimensional (3D) display systems. Several companies in the holographic display market are developing advanced holographic displays for high-definition 3D visualization. The demand for these displays is expected to be high in different sectors such as medical, retail, entertainment, public administration, and others. This is expected to boost the digital holographic display market in the future.
Digital holography is prominently used across which sector?
Commercial vertical is the largest end use sector for digital holography. The largest share is attributed to the adoption of digital holographic displays in the commercial vertical for advertising and marketing. Holograms and holographic displays have powerful 3D rendering capabilities with volumetric 3D images looking much like real objects. As visual media has become pervasive in our day-to-day life, visual information is increasingly used for effective communication among masses, owing to which many new techniques such as digital holography is emerging to offer the realistic representation of visual content for exchanging information. Thus, retailers and vendors are adopting display holography for advertising, marketing, promoting, and other activities. .
To speak to our analyst for a discussion on the above findings, click Speak to Analyst
 Exclusive indicates content/data unique to MarketsandMarkets and not available with any competitors.
Table of Contents
1 Introduction (Page No. - 19)
1.1 Study Objectives
1.2 Market Definition & Scope
1.2.1 Inclusions and Exclusions
1.3 Study Scope
1.3.1 Markets Covered
1.3.2 Years Considered
1.4 Currency
1.5 Stakeholders
2 Research Methodology (Page No. - 22)
2.1 Research Data
2.1.1 Secondary Data
2.1.1.1 Key Data From Secondary Sources
2.1.2 Primary Data
2.1.2.1 Breakdown of Primaries
2.1.2.2 Key Data From Primary Sources
2.1.2.3 Key Industry Insights
2.1.3 Secondary and Primary Research
2.2 Market Size Estimation
2.2.1 Bottom-Up Approach
2.2.1.1 Approach for Capturing Market Size By Bottom-Up Analysis
2.2.2 Top-Down Approach
2.2.2.1 Approach for Capturing Market Size By Top-Down Analysis
2.3 Market Breakdown and Data Triangulation
2.4 Research Assumptions
3 Executive Summary (Page No. - 32)
4 Premium Insights (Page No. - 36)
4.1 Attractive Opportunities for Growth of Digital Holography Market
4.2 Global Market, By Offering
4.3 Global Market, By Application
4.4 Global Market, By Vertical
4.5 Global Market, By Geography
5 Market Overview (Page No. - 39)
5.1 Introduction
5.2 Market Dynamics
5.2.1 Drivers
5.2.1.1 Rising Demand for Digital Holography in Medical and Commercial Applications
5.2.1.2 Growing Adoption of Digital Holography in Financial Sector for Security Purposes
5.2.1.3 Increasing Use of Digital Holography Microscopy for Precise Measurements
5.2.2 Restraints
5.2.2.1 High Cost of Digital Holographic Products
5.2.3 Opportunities
5.2.3.1 Potential Demand for Holographic Displays for Near to Eye Applications
5.2.3.2 Latent Opportunities for Digital Holographic Solutions From Countries in APAC Particularly, China, Japan, and South Korea
5.2.4 Challenges
5.2.4.1 Computational Complexities in Acquisition and Reconstruction of Holograms
5.2.4.2 Lack of Technological Awareness in Market
6 Industry Analysis (Page No. - 45)
6.1 Introduction
6.2 Value Chain Analysis
6.2.1 Research and Development
6.2.2 Component Manufacturing
6.2.3 Assembly and Product Integration
6.2.4 Distribution
6.2.5 End Users
6.3 Strategic Partnerships/Collaborations
6.4 Adjacent/Connected Markets
6.4.1 Introduction
6.4.2 Microdisplay
7 Digital Holography Market, By Process Type (Page No. - 56)
7.1 Introduction
7.2 Digital Recording
7.2.1 Owing to Availability of CCDs With Suitable Pixels and High-Speed Computers, Recording of Digital Holograms has Become More Feasible
7.3 Reconstruction
7.3.1 in Reconstruction, Hologram is Illuminated By Laser Beam
8 Digital Holography Techniques (Page No. - 59)
8.1 Overview
8.2 Off-Axis Holography
8.2.1 in Off-Axis Technique, Reference Beam and Object Beam Come From Different Directions
8.3 In-Line (Gabor) Holography
8.3.1 In-Line Holography is Process of Recording A Hologram By Illuminating A Photographic Plate With Two In-Line Waves
8.4 Others
9 Digital Holography Market, By Offering (Page No. - 61)
9.1 Introduction
9.2 Hardware
9.2.1 Laser
9.2.1.1 Laser Holographic Techniques Can Be Used to Detect Small Deformations of Three-Dimensional Objects
9.2.2 Beam Splitter
9.2.2.1 Beam Splitters Divide Laser Light Into Two Separate Beams
9.2.3 CCD/CMOS Camera
9.2.3.1 CCD Image Sensors are Used in This Camera to Obtain High-Quality Images
9.2.4 Other Components
9.3 Software
9.3.1 Increasing Demand for Data Analytics and Automation to Drive Market for Software Offering
10 Digital Holography Market, By Application (Page No. - 69)
10.1 Introduction
10.2 Digital Holographic Microscopy
10.2.1 Increasing Adoption & Utility of 3D Medical and Surgical Imaging Platforms to Create Opportunities for DHM Vendors
10.3 Digital Holographic Displays
10.3.1 Increasing Adoption of Digital Holographic Displays By Commercial Vertical to Drive Said Market
10.4 Holographic Telepresence
10.4.1 Advent of 5G to Create Opportunities for Holographic Telepresence
11 Digital Holography Market, By Vertical (Page No. - 76)
11.1 Introduction
11.2 Medical
11.2.1 Increasing Demand of DHM for Biomedical/Clinical/Medical Applications to Drive Market
11.3 Commercial
11.3.1 Growing Adoption of Digital Holographic Displays in Commercial Vertical to Propel Said Market During Forecast Period
11.4 Aerospace & Defense
11.4.1 Rising Government Funding to Drive Market for Aerospace & Defense Vertical
11.5 Automotive
11.5.1 Accelerating Demand for Measuring Vibratory and Static Deformations to Propel Said Market Growth
11.6 Consumer
11.6.1 North America to Hold the Largest Size of Market for Consumer Vertical
11.7 Others
12 Geographic Analysis (Page No. - 85)
12.1 Introduction
12.2 North America
12.2.1 US
12.2.1.1 Growing Commercial Spaces Coupled With Escalated Demand for Holographic Displays to Propel Said Market
12.2.2 Rest of North America
12.2.2.1 Increasing Demand for Digital Holography Systems in Commercial and Medical Verticals to Propel DH Market in Region
12.3 Europe
12.3.1 UK
12.3.1.1 Strong Government Support and Presence of Major Digital Holography System Vendors to Boost Market Growth
12.3.2 Germany
12.3.2.1 Established Automotive and Medical Sectors to Create Opportunities for Digital Holography System Vendors in Germany
12.3.3 France
12.3.3.1 Rising Adoption of DHM for Industrial Inspection and Measurement to Drive Market in France
12.3.4 Italy
12.3.4.1 Growing Adoption of Digital Holography in Commercial Vertical to Drive Italian DH Market
12.3.5 Rest of Europe
12.3.5.1 Commercial, Medical, and Industrial Verticals are Key Contributors of DH Market in Rest of Europe
12.4 APAC
12.4.1 China
12.4.1.1 Digital Holographic Microscopy to Exhibit High Growth in China
12.4.2 Japan
12.4.2.1 DH Market in Japan to Be Driven By Increasing Adoption of Digital Holography in Automotive and Medical Verticals
12.4.3 South Korea
12.4.3.1 Surge in Demand for Holographic Displays From Retail Sector to Boost South Korean Market
12.4.4 India
12.4.4.1 High Demand for Holographic Displays to Be Witnessed in India During Forecast Period
12.4.5 Rest of APAC
12.4.5.1 Market in Region to Be Propelled By Increasing Commercial Space Coupled With Increasing Spending on Improving Medical Imaging
12.5 RoW
12.5.1 South America
12.5.1.1 Emerging Economies Such as Brazil, Chile, and Argentina are Among Key Contributors in South American Market
12.5.2 Middle East & Africa
12.5.2.1 Market in Middle East & Africa is Driven By Rising Demand for Digital Holography Systems in Medical, Commercial, and Oil & Gas Applications
13 Competitive Landscape (Page No. - 121)
13.1 Overview
13.2 Digital Holography Market: Market Ranking Analysis 2019
13.3 Competitive Situations and Trends
13.3.1 Product Developments & Launches, and Expansions
13.3.2 Agreements, Partnerships, Collaborations, & Contracts
13.3.3 Acqusitions
13.4 Competitive Leadership Mapping
13.4.1 Visionary Leaders
13.4.2 Innovators
13.4.3 Dynamic Differentiators
13.4.4 Emerging Companies
14 Company Profiles (Page No. - 128)
14.1 Introduction
14.2 Key Players
(Business Overview, Products Offered, Recent Developments, SWOT Analysis, and MnM View)*
14.2.1 Lyncee TEC SA
14.2.2 Holoxica Limited
14.2.3 Realview Imaging
14.2.4 Eon Reality
14.2.5 Phase Holographic Imaging AB (PHI)
14.2.6 Holotech Switzerland AG (Zebra Imaging)
14.2.7 Holmarc Opto-Mechatronics
14.2.8 Geola Digital Uab
14.2.9 Ovizio Imaging Systems
14.2.10 Leia Inc
* Business Overview, Products Offered, Recent Developments, SWOT Analysis, and MnM View Might Not Be Captured in Case of Unlisted Companies.
14.3 Other Key Players
14.3.1 Realfiction
14.3.2 Intelligent Imaging Innovations (3I)
14.3.3 MetRoLAser
14.3.4 MDH Hologram
14.3.5 Holotronica
14.3.6 Light Logics Holography and Optics
14.3.7 Digitos Technologies
14.3.8 Trimos
14.4 Key Innovators
14.4.1 Jasper Display Corp. (JDC)
14.4.2 Holoeye Photonics
14.4.3 Mit Media Lab (Massachusetts Institute of Technology)
14.4.4 Fraunhofer IPM
15 Appendix (Page No. - 153)
15.1 Discussion Guide
15.2 Knowledge Store: Marketsandmarkets� Subscription Portal
15.3 Available Customizations
15.4 Related Reports
15.5 Author Details
List of Tables (101 Tables)
Table 1 Advantages of Holographic Displays Over Binocular Vision Displays and Light-Field Displays
Table 2 Use-Cases of Vr in Consumer Application
Table 3 Use-Cases of Augmented Reality in Enterprise Application
Table 4 List of Companies With Scientific Partners
Table 5 Comparison of Microdisplays
Table 6 Global Microdisplay Market, 2016�2024 (Million Units)
Table 7 Microdisplay Market, By Technology, 2016�2024 (USD Million)
Table 8 LCD Microdisplay Market, By Region, 2016�2024 (USD Million)
Table 9 LCOS Microdisplay Market, By Region, 2016�2024 (USD Million)
Table 10 OLED Microdisplay Market, By Region, 2016�2024 (USD Million)
Table 11 DLP Microdisplay Market, By Region, 2016�2024 (USD Million)
Table 12 Microdisplay Market, By Industry, 2016�2024 (USD Million)
Table 13 Microdisplay Market for Consumer Industry, By Product Type, 2016�2024 (USD Million)
Table 14 Microdisplay Market for Industrial and Enterprise Industry, By Product, 2016�2024 (USD Million)
Table 15 Microdisplay Market for Automotive Industry, By Product, 2016�2024 (USD Million)
Table 16 Microdisplay Market for Military, Defense, and Aerospace Industry, By Product, 2016�2024 (USD Million)
Table 17 Microdisplay Market for Sports and Entertainment Industry, By Product, 2016�2024 (USD Million)
Table 18 Microdisplay Market for Retail and Hospitality Industry, By Product, 2016�2024 (USD Million)
Table 19 Microdisplay Market for Medical Industry, By Product, 2016�2024 (USD Million)
Table 20 Microdisplay Market for Education Industry, By Product, 2016�2024 (USD Million)
Table 21 Microdisplay Market for Other Industries, By Product, 2016�2024 (USD Million)
Table 22 Microdisplay Market, By Region, 2016�2024 (USD Million)
Table 23 Microdisplay Market in APAC, By Country, 2015�2024 (USD Million)
Table 24 Microdisplay Market in North America, By Country (USD Million)
Table 25 Microdisplay Market in Europe, By Country (USD Million)
Table 26 Microdisplay Market in RoW, By Region (USD Million)
Table 27 Categories of Holography
Table 28 General Properties of Recording Materials Used in Holography
Table 29 Digital Holography Market, By Offering, 2016�2024 (USD Million)
Table 30 Market for Hardware, By Region, 2016�2024 (USD Million)
Table 31 Laser Technology Market, By Laser Type, 2015�2024 (USD Billion)
Table 32 Comparison Between CCD and CMOS Cameras for Digital Holographic Microscopy Applications
Table 33 Market for Software, By Region, 2016�2024 (USD Million)
Table 34 Market, By Application, 2016�2024 (USD Million)
Table 35 Digital Holographic Microscopy Market, By Region, 2016�2024 (USD Million)
Table 36 Digital Holographic Display Market, By Region, 2016�2024 (USD Million)
Table 37 Digital Holographic Telepresence Market, By Region, 2016�2024 (USD Million)
Table 38 Digital Holography Market, By Vertical, 2016�2024 (USD Million)
Table 39 Market for Medical Vertical, By Region, 2016�2024 (USD Million)
Table 40 Market for Commercial Vertical, By Region, 2016�2024 (USD Million)
Table 41 Market for Aerospace & Defense, By Region, 2016�2024 (USD Million)
Table 42 Market for Automotive, By Region, 2016�2024 (USD Million)
Table 43 Market for Consumer Vertical, By Region, 2016�2024 (USD Million)
Table 44 Market for Other Verticals, By Region, 2016�2024 (USD Million)
Table 45 Market, By Region, 2016�2024 (USD Million)
Table 46 Market in North America, By Offering, 2016�2024 (USD Million)
Table 47 Market in North America, By Vertical, 2016�2024 (USD Million)
Table 48 Market in North America, By Application, 2016�2024 (USD Million)
Table 49 North American Digital Holography Market for Digital Holographic Display, By Country, 2016�2024 (USD Million)
Table 50 North American Digital Holographic Microscopy Market, By Country, 2016�2024 (USD Million)
Table 51 North American Digital Holographic Telepresence Market, By Country, 2016�2024 (USD Million)
Table 52 Market in North America, By Country, 2016�2024 (USD Million)
Table 53 Market in US, By Offering, 2016�2024 (USD Million)
Table 54 Market in US, By Application, 2016�2024 (USD Million)
Table 55 Market in Rest of North America, By Offering, 2016�2024 (USD Million)
Table 56 Market in Rest of North America, By Application, 2016�2024 (USD Million)
Table 57 Market in Europe, By Offering, 2016�2024 (USD Million)
Table 58 Market in Europe, By Vertical, 2016�2024 (USD Million)
Table 59 Market in Europe, By Application, 2016�2024 (USD Million)
Table 60 European Digital Holography for Digital Holographic Display, By Country, 2016�2024 (USD Million)
Table 61 European Digital Holography for Digital Holographic Microscopy, By Country, 2016�2024 (USD Million)
Table 62 European Digital Holography Market for Holographic Telepresence, By Country, 2016�2024 (USD Million)
Table 63 Market in Europe, By Country, 2016�2024 (USD Million)
Table 64 Market in UK, By Offering, 2016�2024 (USD Million)
Table 65 Market in UK, By Application, 2016�2024 (USD Million)
Table 66 Market in Germany, By Offering, 2016�2024 (USD Million)
Table 67 Market in Germany, By Application, 2016�2024 (USD Million)
Table 68 Market in France, By Offering, 2016�2024 (USD Million)
Table 69 Market in France, By Application, 2016�2024 (USD Million)
Table 70 Market in Italy, By Offering, 2016�2024 (USD Million)
Table 71 Market in Italy, By Application, 2016�2024 (USD Million)
Table 72 Market in Rest of Europe, By Offering, 2016�2024 (USD Million)
Table 73 Market in Rest of Europe, By Application, 2016�2024 (USD Million)
Table 74 Market in APAC, By Offering, 2016�2024 (USD Million)
Table 75 Market in APAC, By Vertical, 2016�2024 (USD Million)
Table 76 Market in APAC, By Application, 2016�2024 (USD Million)
Table 77 Market in APAC for Digital Holographic Display, By Country, 2016�2024 (USD Million)
Table 78 Market in APAC for Digital Holographic Microscopy, By Country, 2016�2024 (USD Million)
Table 79 Market in APAC for Holographic Telepresence, By Country, 2016�2024 (USD Million)
Table 80 Market in APAC, By Country, 2016�2024 (USD Million)
Table 81 Market in China, By Offering, 2016�2024 (USD Million)
Table 82 Market in China, By Application, 2016�2024 (USD Million)
Table 83 Market in Japan, By Offering, 2016�2024 (USD Million)
Table 84 Market in Japan, By Application, 2016�2024 (USD Million)
Table 85 Market in South Korea, By Application, 2016�2024 (USD Million)
Table 86 Market in South Korea, By Offering, 2016�2024 (USD Million)
Table 87 Market in India, By Offering, 2016�2024 (USD Million)
Table 88 Market in India, By Application, 2016�2024 (USD Million)
Table 89 Market in Rest of APAC, By Application, 2016�2024 (USD Million)
Table 90 Market in Rest of APAC, By Offering, 2016�2024 (USD Million)
Table 91 Market in RoW, By Offering, 2016�2024 (USD Million)
Table 92 Market in RoW, By Vertical, 2016�2024 (USD Million)
Table 93 Market in RoW, By Application, 2016�2024 (USD Million)
Table 94 Market for Digital Holographic Display in RoW, By Region, 2016�2024 (USD Million)
Table 95 Market for Digital Holographic Microscopy in RoW, By Region, 2016�2024 (USD Million)
Table 96 Market for Holographic Telepresence in RoW, By Region, 2016�2024 (USD Million)
Table 97 Market in RoW, By Region, 2016�2024 (USD Million)
Table 98 Market in South America, By Offering, 2016�2024 (USD Million)
Table 99 Market in South America, By Application, 2016�2024 (USD Million)
Table 100 Market in Middle East & Africa, By Application, 2016�2024 (USD Million)
Table 101 Market in Middle East and Africa, By Offering, 2016�2024 (USD Million)
List of Figures (48 Figures)
Figure 1 Digital Holography Market Segmentation
Figure 2 Market: Process Flow of Market Size Estimation
Figure 3 Market: Research Design
Figure 4 Market Size Estimation Methodology: Approach 1 (Supply Side): Revenue Generated By Companies From Solutions/Products/ Services Offered in Digital Holography Market
Figure 5 Market Size Estimation Methodology: Approach 2 (Demand Side): Adoption Level of Digital Holography Solutions, By Vertical
Figure 6 Market Size Estimation Methodology: Bottom-Up Approach
Figure 7 Market Size Estimation Methodology: Top-Down Approach
Figure 8 Data Triangulation
Figure 9 Global Digital Holography Market 2016�2024 (USD Billion)
Figure 10 Software to Register Higher CAGR During Forecast Period
Figure 11 Digital Holographic Display to Hold Largest Size of Digital Holography Market During Forecast Period
Figure 12 Commercial Vertical to Hold Largest Size of Market During Forecast Period
Figure 13 APAC to Register Highest CAGR During Forecast Period
Figure 14 Digital Holography Market Expected to Exhibit High Growth From 2019 to 2024
Figure 15 Hardware Offering to Hold Larger Size of Digital Holography Market in 2024
Figure 16 Digital Holographic Display to Account for Largest Share By 2024
Figure 17 Medical Vertical to Exhibit Highest CAGR in Digital Holography Market During Forecast Period
Figure 18 APAC to Exhibit Highest CAGR in Digital Holography Market During Forecast Period
Figure 19 Market: Drivers, Restraints, Opportunities, and Challenges
Figure 20 Market Drivers and Their Impact
Figure 21 Market: Value Chain Analysis
Figure 22 Market, By Process Type
Figure 23 Brief History of Holography
Figure 24 Digital Holography Techniques
Figure 25 Market, By Offering
Figure 26 Hardware Segment to Hold Larger Size of Market During Forecast Period
Figure 27 Global Laser Technology Market (USD Billion)
Figure 28 CMOS Sensors to Dominate Market During Forecast Period
Figure 29 Market for 3D Image Sensors to Grow at Higher CAGR During Forecast Period
Figure 30 Market, By Application
Figure 31 Digital Holographic Display to Lead Market, in Terms of Size, By 2024
Figure 32 Evolution of Displays
Figure 33 Digital Holography Market, By Vertical
Figure 34 Commercial Vertical to Dominate Market, in Terms of Size, During Forecast Period
Figure 35 Market, By Region
Figure 36 Market, Geographic Snapshot
Figure 37 North America to Continue to Hold Largest Size of Market By 2024
Figure 38 North America: Snapshot of Market
Figure 39 US to Dominate North American Market During Forecast Period
Figure 40 Digital Holography Application Impact in US Commercial Sector (2019 vs 2024)
Figure 41 Europe: Snapshot of Market
Figure 42 Market in Rest of Europe to Grow at Highest CAGR During Forecast Period
Figure 43 APAC: Snapshot of Market
Figure 44 Market in China to Register Highest Growth Rate During Forecast Period
Figure 45 Middle East and Africa to Register Higher Growth Rate During Forecast Period
Figure 46 Key Developments By Leading Players in Market From 2016 to 2019
Figure 47 Market Ranking of Top 3 Players in Market, 2018
Figure 48 Digital Holography Market (Global) Competitive Leadership Mapping, 2018
The study involved 4 major activities to estimate the current size of the digital holography market. Exhaustive secondary research was done to collect information on the market, including the peer market and parent market. The next step was to validate these findings, assumptions, and sizing with industry experts across the value chain through primary research. Both top-down and bottom-up approaches were employed to estimate the complete market size. Thereafter, market breakdown and data triangulation procedures were used to estimate the market size of segments and subsegments.
Secondary Research
In the secondary research process, various secondary sources have been referred to for identifying and collecting information for this study. Secondary sources include annual reports, press releases, and investor presentations of companies; white papers, journals, certified publications, articles from recognized authors; websites; directories; and databases; among others. Secondary research has mainly been used to obtain key information about the industry�s supply chain, market�s value chain, major players, market classification, and segmentation according to industry trends to the bottom-most level, geographic markets, and key developments from both market- and technology-oriented perspectives. Secondary data has been collected and analyzed to arrive at the overall market size, which has further been validated through primary research.
Primary Research
In the primary research process, various primary sources from both supply and demand sides have been interviewed to obtain qualitative and quantitative information relevant to this report. Extensive primary research has been conducted after understanding and analyzing the digital holography market through secondary research.
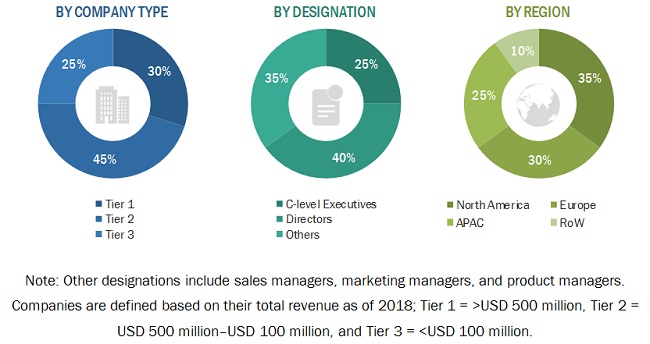
Several primary interviews have been conducted with key opinion leaders from both demand- and supply-side vendors across 4 regions: North America, Europe, Asia Pacific (APAC), and the Rest of the World (RoW). RoW comprises South America and the Middle East & Africa. Approximately 30% of the primary interviews have been conducted with the demand side and 70% with the supply side. This primary data has been collected mainly through telephonic interviews, which accounted for 80% of the total primary interviews. Besides, questionnaires and emails were also used to collect the data.
To know about the assumptions considered for the study, download the pdf brochure
Market Size Estimation
Both top-down and bottom-up approaches have been used to estimate and validate the size of the digital holography market, as well as other dependent markets. The key players in the market have been identified through secondary research, and their market position in the respective regions has been determined through primary and secondary research. This entire procedure includes the study of the annual and financial reports and databases of top players and extensive interviews with industry leaders such as CEOs, VPs, directors, and marketing executives for key insights. The research methodology used to estimate the market size includes the following steps:
- The key players in the industry and markets have been identified through extensive secondary research.
- The industry�s supply chain and market size, in terms of value, have been determined through primary and secondary research processes.
- All percentage shares, splits, and breakdowns have been determined using secondary sources and verified through primary sources.
Data Triangulation
After arriving at the overall market size from the market size estimation process explained above, the overall market has been split into several segments and subsegments. To complete the overall market engineering process and arrive at the exact statistics for all the segments and subsegments, market breakdown and data triangulation procedures have been employed, wherever applicable. Data has been triangulated by studying various factors and trends from both the demand and supply sides.
Study Objectives
- To define and forecast the digital holography market, in terms of value, segmented based on offering, application, vertical, and region.
- To describe digital holography techniques and processes.
- To estimate and forecast the market size, in terms of value, for various segments across 4 main regions�North America, Europe, Asia Pacific (APAC), and the Rest of the World (RoW).
- To analyze the digital holography ecosystem/supply chain comprising material & component suppliers, product manufacturers, and end users.
- To provide detailed information regarding major factors (drivers, restraints, opportunities, and challenges) influencing the growth of the market.
- To strategically analyze micromarkets with respect to individual growth trends, prospects, and contributions to the overall market.
- To analyze market opportunities for stakeholders and provide details of the competitive landscape of key players.
- To analyze competitive developments such as acquisitions, agreements, collaborations, contracts, expansions, partnerships, product developments, and product launches in the market.
- To strategically profile key players and comprehensively analyze their market shares and core competencies.
Available Customizations
With the given market data, MarketsandMarkets offers customizations according to the company's specific needs. The following customization options are available for this report:
Regional Analysis
- Country-wise breakdown of various regions such as North America, Europe, APAC, and RoW
- Further segmentation of the vertical and offering segments of the digital holography market
Company Informations
- Detailed analysis and profiling of additional market players (up to 5)


Growth opportunities and latent adjacency in Digital Holography Market