Data Masking Market by Data Masking Type (Static and Dynamic), Component (Software and Services), Deployment Type, Organization Size, Business Function (Finance, Marketing & Sales, Operations, and Legal), Vertical, and Region - Global Forecast to 2022


[142 Pages Report] The data masking market was valued at USD 347.3 Million in 2016 and projected to reach USD 767.0 Million by 2022, at a Compound Annual Growth Rate (CAGR) of 14.8%. The major growth drivers of the market include evolving compliance regulations and exploding volume of data. The base year considered for this report is 2016, and the market forecast period is 2017�2022.
Objectives of the Study
The main objective of the data masking market research report is to define, describe, and forecast the global data masking market on the basis of masking type (static and dynamic), component, deployment type, business function, organization size, vertical, and regions. The report provides detailed information regarding the major factors influencing the growth of the market (drivers, restraints, opportunities, and industry-specific challenges). The report aims to strategically analyze micro markets with respect to individual growth trends, prospects, and contributions to the total market. The report attempts to forecast the market size with respect to 5 main regions, namely, North America, Europe, Asia Pacific (APAC), Middle East and Africa (MEA), and Latin America. The report strategically profiles key players and comprehensively analyzes their core competencies. It also tracks and analyzes competitive developments, such as partnerships, collaborations, and agreements; mergers and acquisitions; new product launches and developments; and Research and Development (R&D) activities in the market.
Research Methodology
The research methodology used to estimate and forecast the data masking market begins with capturing data on key vendor revenues through secondary research, which includes directories and databases (D&B Hoovers, Bloomberg Businessweek, and Factiva). The vendor offerings have also been taken into consideration to determine the market segmentation. The bottom-up procedure was employed to arrive at the overall market size of the global market that was derived from the revenue of the key players in the market. After arriving at the overall market size, the total market was split into several segments and subsegments, which were then verified through primary research by conducting extensive interviews with key people, such as Chief Executive Officers (CEOs), Vice Presidents (VPs), directors, and executives. The data triangulation and market breakdown procedures were employed to complete the overall market engineering process and arrive at the exact statistics for all segments and subsegments. The breakdown of profiles of primary participants is depicted in the figure below:
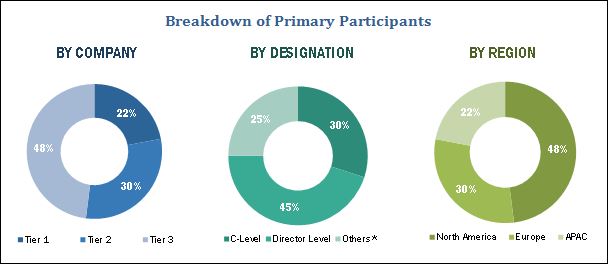
To know about the assumptions considered for the study, download the pdf brochure
The data masking market ecosystem comprises vendors such as IBM Corporation (US), Informatica (US), CA Technologies, Inc (US), Solix Technologies, Inc (US), Innovative Routines International, Inc (US), Oracle Corporation (US), Deplhix (US), MENTIS (US), Micro Focus (US), Compuware Corporation (US), Ekobit d.o.o. (Croatia), and ARCAD Software (France). Other stakeholders of the market include vendors, research organizations, managed service providers, third-party providers, and technology providers.
Key Target Audience for Data Masking Market
- Service providers and distributors
- Data masking application builders
- Independent Software Vendors (ISVs)
- Analytics consulting companies
- Enterprises
- End-users
�The study answers several questions for the stakeholders, primarily which market segments to focus on in the next 2�5 years for prioritizing efforts and investments.�
Scope of the Data Masking Market Research Report
|
Report Metrics |
Details |
|
Market size available for years |
2015�2022 |
|
Base year considered |
2016 |
|
Forecast period |
2017�2022 |
|
Forecast units |
Million (USD) |
|
Segments covered |
Data Masking Type, Component, Deployment Type, Organization Size, Business Function, Vertical and Region |
|
Geographies covered |
North America, Europe, APAC, Latin America, and MEA |
|
Companies covered |
IBM Corporation (US), Informatica (US), CA Technologies, Inc (US), Solix Technologies, Inc (US), Innovative Routines International, Inc (US), Oracle Corporation (US), Deplhix (US), MENTIS (US), Micro Focus (US), Compuware Corporation (US), Ekobit d.o.o. (Croatia), and ARCAD Software (France). |
The research report categorizes the market to forecast the revenues and analyze trends in each of the following subsegments:
By Data Masking Market Type
- Static
- Dynamic
By Component
- Software
- Service
- Managed services
- Professional services
- Consulting
- Support and maintenance
By Business Function
- Finance
- Operations
- Marketing and sales
- Human Resource (HR)
- Legal
- Others (Support and R&D)
By Deployment Type
- On-premises
- Cloud
By Organization Size
- Small and Medium-sized Enterprises (SMEs)
- Large enterprises
By Industry Vertical
- BFSI
- Healthcare and life sciences
- Retail and eCommerce
- Telecommunications and IT
- Government and defense
- Media and entertainment
- Manufacturing
- Others (logistics and transportation, travel and hospitality, and utilities)
Data Masking Market by Region
- North America
- US
- Canada
- Europe
- UK
- Germany
- Rest of Europe
- APAC
- China
- India
- Latin America
- Brazil
- Mexico
- MEA
The report provides detailed insights into the global data masking market, which is segmented by data masking type, business function, component, deployment type, organization size, industry vertical, and region. In the masking type, the dynamic data masking solution is expected to have a larger market share during the forecast period. With the rise in data volume, need for solutions to protect sensitive data also increases. Furthermore, the flow of data has increased due to IoT and remote sensors across various industries. Companies are focusing on enhancing their software and services that assist them with data masking. Data masking helps in masking data without affecting the content and nature of data, thus mitigating the data related risks.
Among organization size, the increasing adoption can be observed by large enterprise, and it is expected to continue its dominance during the forecast period. Whereas, the SMEs segment, with increasing focus on improvement of the customer experience, is likely to have the highest growth rate during the forecast period. The cloud migrations are expected to drive the need for masking data and further drives the adoption in the SMEs segment.
The retail and eCommerce is expected to have the largest market share and dominate the data masking market during the forecast period. This upsurge can be attributed to the rise in deployment of POS terminals through which customers� feedback is taken for better decision-making. Data masking ensures the security of data which minimize frauds and associated risks.
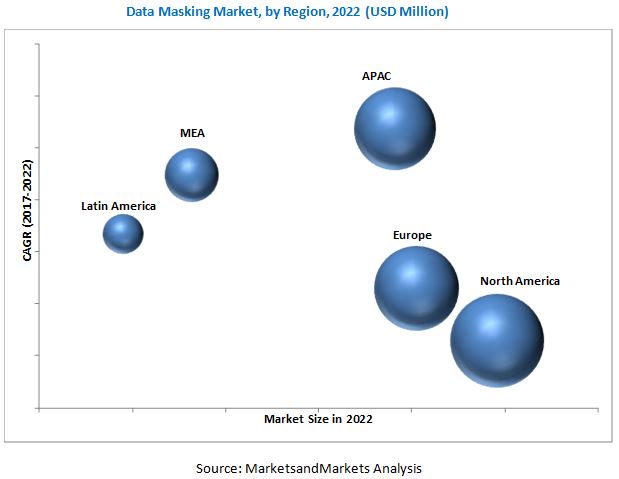
The report covers all the major aspects of the data masking market and provides an in-depth analysis for major countries across the regions of North America, Europe, Asia Pacific (APAC), Middle East and Africa (MEA), and Latin America. North America, owing to the early adoption of new and emerging technologies, coupled with expanding data, is expected to continue its dominance in the market throughout the forecast period. The APAC region is expected to grow at the highest CAGR during the forecast period, owing to the increasing data and growing adoption of data management software and services among SMEs.
The identification of sensitive data and data integration issues are some of the major challenges faced by the data masking users, which needs to be enhanced to facilitate the adoption of data masking solutions worldwide.
Available Customizations
With the given market data, MarketsandMarkets offers customizations as per the company�s specific needs. The following customization options are available for the report:
Product Analysis
- Product matrix gives a detailed comparison of the product portfolio of each company
Geographic Analysis
- Further breakdown of the North American Data Masking market
- Further breakdown of the European market
- Further breakdown of the APAC market
- Further breakdown of the Latin American market
- Further breakdown of the MEA market
Company Information
- Detailed analysis and profiling of additional market players up to 5.
To speak to our analyst for a discussion on the above findings, click Speak to Analyst
 Exclusive indicates content/data unique to MarketsandMarkets and not available with any competitors.
Table of Contents
1 Introduction (Page No. - 15)
1.1 Objectives of the Study
1.2 Market Definition
1.3 Market Scope
1.4 Years Considered for the Study
1.5 Currency
1.6 Stakeholders
2 Research Methodology (Page No. - 18)
2.1 Research Data
2.1.1 Secondary Data
2.1.2 Primary Data
2.1.2.1 Breakdown of Primaries
2.1.2.2 Key Industry Insights
2.2 Market Size Estimation
2.3 Research Assumptions
2.4 Limitations
3 Executive Summary (Page No. - 25)
4 Premium Insights (Page No. - 30)
4.1 Attractive Market Opportunities in the Data Masking Market
4.2 Market By Region
4.3 Market By Region and Vertical
5 Market Overview (Page No. - 33)
5.1 Introduction
5.1.1 Market Dynamics
5.1.1.1 Drivers
5.1.1.1.1 Rise in Organizational Data Volumes
5.1.1.1.2 Compliance With Privacy Regulations
5.1.1.1.3 Protecting Data From Unnecessary Internal Exposure and External Service Providers
5.1.1.2 Restraints
5.1.1.2.1 Does Not Hide All the Content of the Data
5.1.1.3 Opportunities
5.1.1.3.1 Expanding Use of Data Analytics
5.1.1.4 Challenges
5.1.1.4.1 Complexities in Data Integration and Customization
5.1.1.4.2 Loopholes in Identifying Sensitive Data
5.2 Industry Trends
5.2.1 Data Masking Use Cases
5.2.1.1 Introduction
5.2.1.2 Use Case #1
5.2.1.3 Use Case #2:
5.2.1.4 Use Case #3:
5.3 Regulatory Implications
5.3.1 Introduction
5.3.2 Sarbanes-Oxley Act of 2002
5.3.3 General Data Protection Regulation (GDPR)
5.3.4 Basel
5.3.5 Governance, Risk, and Compliance
5.3.6 HIPAA/HITECH
5.4 Best Practices to Be Followed
6 Data Masking Market By Type (Page No. - 41)
6.1 Introduction
6.2 Static
6.3 Dynamic
7 Data Masking Market By Business Function (Page No. - 45)
7.1 Introduction
7.2 Finance
7.3 Operations
7.4 Marketing and Sales
7.5 Human Resources
7.6 Legal
7.7 Others
8 Data Masking Market By Component (Page No. - 51)
8.1 Introduction
8.2 Software
8.3 Services
8.3.1 Professional Services
8.3.1.1 Consulting Services
8.3.1.2 Support and Maintenance Services
8.3.2 Managed Services
9 Market By Deployment Type (Page No. - 58)
9.1 Introduction
9.2 On-Premises
9.3 Cloud
10 Data Masking Market By Organization Size (Page No. - 61)
10.1 Introduction
10.2 Large Enterprises
10.3 Small and Medium-Sized Enterprises
11 Market, By Vertical (Page No. - 65)
11.1 Introduction
11.2 Banking, Financial Services, and Insurance
11.3 Healthcare and Life Sciences
11.4 Retail and Ecommerce
11.5 Telecommunications and IT
11.6 Government and Defense
11.7 Media and Entertainment
11.8 Manufacturing
11.9 Others
12 Market, By Region (Page No. - 75)
12.1 Introduction
12.2 North America
12.2.1 By Country
12.2.1.1 United States
12.2.1.2 Canada
12.2.2 By Data Masking Type
12.2.3 By Business Function
12.2.4 By Component
12.2.5 By Service
12.2.6 By Deployment Type
12.2.7 By Organization Size
12.2.8 By Vertical
12.3 Europe
12.3.1 By Country
12.3.1.1 United Kingdom
12.3.1.2 Germany
12.3.1.3 Rest of Europe
12.3.2 By Data Masking Type
12.3.3 By Business Function
12.3.4 By Component
12.3.5 By Service
12.3.6 By Deployment Type
12.3.7 By Organization Size
12.3.8 By Vertical
12.4 Asia Pacific
12.4.1 By Country
12.4.1.1 China
12.4.1.2 India
12.4.1.3 Rest of Asia Pacific
12.4.2 By Data Masking Type
12.4.3 By Business Function
12.4.4 By Component
12.4.5 By Service
12.4.6 By Deployment Type
12.4.7 By Organization Size
12.4.8 By Vertical
12.5 Latin America
12.5.1 By Country
12.5.1.1 Mexico
12.5.1.2 Brazil
12.5.1.3 Rest of Latin America
12.5.2 By Data Masking Type
12.5.3 By Business Function
12.5.4 By Component
12.5.5 By Service
12.5.6 By Deployment Type
12.5.7 By Organization Size
12.5.8 By Vertical
12.6 Middle East and Africa
12.6.1 By Region
12.6.1.1 Middle East
12.6.1.2 Africa
12.6.2 By Data Masking Type
12.6.3 By Business Function
12.6.4 By Component
12.6.5 By Service
12.6.6 By Deployment Type
12.6.7 By Organization Size
12.6.8 By Vertical
13 Competitive Landscape (Page No. - 101)
13.1 Overview
13.2 Market Standing, By Key Player
13.3 Competitive Scenario
13.3.1 New Product Launches and Product Upgradation
13.3.2 Partnerships, Collaborations, and Agreements
13.3.3 Mergers and Acquisitions
13.3.4 Business Expansions
14 Company Profiles (Page No. - 106)
(Business Overview, Strength of Product Portfolio, Business Strategy Excellence, Recent Developments)*
14.1 IBM
14.2 Informatica
14.3 CA Technologies
14.4 Solix
14.5 IRI
14.6 Delphix
14.7 Mentis
14.8 Micro Focus
14.9 Oracle
14.10 Compuware
14.11 Key Innovators
14.11.1 Ekobit
14.11.2 Arcad Software
*Details on Business Overview, Strength of Product Portfolio, Business Strategy Excellence, Recent Developments Might Not Be Captured in Case of Unlisted Companies.
15 Appendix (Page No. - 132)
15.1 Insights of Industry Experts
15.2 Discussion Guide
15.3 Knowledge Store: Marketsandmarkets� Subscription Portal
15.4 Introducing RT: Real-Time Market Intelligence
15.5 Available Customization
15.6 Related Reports
15.7 Author Details
List of Tables (76 Tables)
Table 1 Data Masking Market Size and Growth Rate, 2015�2022 (USD Million, Y-O-Y %)
Table 2 Market Size, By Data Masking Type, 2015�2022 (USD Million)
Table 3 Static: Market Size, By Business Function, 2015�2022 (USD Million)
Table 4 Dynamic: Market Size, By Business Function, 2015�2022 (USD Million)
Table 5 Data Masking Market Size, By Business Function, 2015�2022 (USD Million)
Table 6 Finance: Market Size, By Region, 2015�2022 (USD Million)
Table 7 Operations: Market Size, By Region, 2015�2022 (USD Million)
Table 8 Marketing and Sales: Market Size, By Region, 2015�2022 (USD Million)
Table 9 Human Resources: Market Size, By Region, 2015�2022 (USD Million)
Table 10 Legal: Market Size, By Region, 2015�2022 (USD Million)
Table 11 Others: Market Size, By Region, 2015�2022 (USD Million)
Table 12 Data Masking Market Size, By Component, 2015�2022 (USD Million)
Table 13 Software: Market Size, By Region, 2015�2022 (USD Million)
Table 14 Services: Market Size, By Type, 2015�2022 (USD Million)
Table 15 Services: Market Size, By Region, 2015�2022 (USD Million)
Table 16 Professional Services Market Size, By Type, 2015�2022 (USD Million)
Table 17 Professional Services Market Size, By Region, 2015�2022 (USD Million)
Table 18 Consulting Services Market Size, By Region, 2015�2022 (USD Million)
Table 19 Support and Maintenance Services Market Size, By Region, 2015�2022 (USD Million)
Table 20 Managed Services: Market Size, By Region, 2015�2022 (USD Million)
Table 21 Data Masking Market Size, By Deployment Type, 2015�2022 (USD Million)
Table 22 On-Premises: Market Size, By Region, 2015�2022 (USD Million)
Table 23 Cloud: Market Size, By Region, 2015�2022 (USD Million)
Table 24 Market Size, By Organization Size, 2015�2022 (USD Million)
Table 25 Large Enterprises: Market Size, By Region, 2015�2022 (USD Million)
Table 26 Small and Medium-Sized Enterprises: Market Size, By Region, 2015�2022 (USD Million)
Table 27 Data Masking Market Size, By Vertical, 2015�2022 (USD Million)
Table 28 Banking, Financial Services, and Insurance: Market Size, By Region, 2015�2022 (USD Million)
Table 29 Healthcare and Life Sciences: Market Size, By Region, 2015�2022 (USD Million)
Table 30 Retail and Ecommerce: Market Size, By Region, 2015�2022 (USD Million)
Table 31 Telecommunications and IT: Market Size, By Region, 2015�2022 (USD Million)
Table 32 Government and Defense: Market Size, By Region, 2015�2022 (USD Million)
Table 33 Media and Entertainment: Market Size, By Region, 2015�2022 (USD Million)
Table 34 Manufacturing: Market Size, By Region, 2015�2022 (USD Million)
Table 35 Others: Market Size, By Region, 2015�2022 (USD Million)
Table 36 Data Masking Market Size, By Region, 2015�2022 (USD Million)
Table 37 North America: Market Size, By Data Masking Type, 2015�2022 (USD Million)
Table 38 North America: Data Masking Market Size, By Business Function, 2015�2022 (USD Million)
Table 39 North America: Market Size, By Component, 2015�2022 (USD Million)
Table 40 North America: Market Size, By Service, 2015�2022 (USD Million)
Table 41 North America: Market Size, By Deployment Type, 2015�2022 (USD Million)
Table 42 North America: Market Size, By Organization Size, 2015�2022 (USD Million)
Table 43 North America: Market Size, By Vertical, 2015�2022 (USD Million)
Table 44 Europe: Market Size, By Data Masking Type, 2015�2022 (USD Million)
Table 45 Europe: Market Size, By Business Function, 2015�2022 (USD Million)
Table 46 Europe: Market Size, By Component, 2015�2022 (USD Million)
Table 47 Europe: Data Masking Market Size, By Service, 2015�2022 (USD Million)
Table 48 Europe: Market Size, By Deployment Type, 2015�2022 (USD Million)
Table 49 Europe: Market Size, By Organization Size, 2015�2022 (USD Million)
Table 50 Europe: Market Size, By Vertical, 2015�2022 (USD Million)
Table 51 Asia Pacific: Market Size, By Data Masking Type, 2015�2022 (USD Million)
Table 52 Asia Pacific: Market Size, By Business Function, 2015�2022 (USD Million)
Table 53 Asia Pacific: Market Size, By Component, 2015�2022 (USD Million)
Table 54 Asia Pacific: Data Masking Market Size, By Service, 2015�2022 (USD Million)
Table 55 Asia Pacific: Market Size, By Deployment Type, 2015�2022 (USD Million)
Table 56 Asia Pacific: Market Size, By Organization Size, 2015�2022 (USD Million)
Table 57 Asia Pacific: Market Size, By Vertical, 2015�2022 (USD Million)
Table 58 Latin America: Market Size, By Data Masking Type, 2015�2022 (USD Million)
Table 59 Latin America: Market Size, By Business Function, 2015�2022 (USD Million)
Table 60 Latin America: Market Size, By Component, 2015�2022 (USD Million)
Table 61 Latin America: Data Masking Market Size, By Service, 2015�2022 (USD Million)
Table 62 Latin America: Market Size, By Deployment Type, 2015�2022 (USD Million)
Table 63 Latin America: Market Size, By Organization Size, 2015�2022 (USD Million)
Table 64 Latin America: Market Size, By Vertical, 2015�2022 (USD Million)
Table 65 Middle East and Africa: Market Size, By Data Masking Type, 2015�2022 (USD Million)
Table 66 Middle East and Africa: Market Size, By Business Function, 2015�2022 (USD Million)
Table 67 Middle East and Africa: Market Size, By Component, 2015�2022 (USD Million)
Table 68 Middle East and Africa: Data Masking Market Size, By Service, 2015�2022 (USD Million)
Table 69 Middle East and Africa: Market Size, By Deployment Type, 2015�2022 (USD Million)
Table 70 Middle East and Africa: Market Size, By Organization Size, 2015�2022 (USD Million)
Table 71 Middle East and Africa: Market Size, By Vertical, 2015�2022 (USD Million)
Table 72 Prominent Players in the Data Masking Market
Table 73 New Product Launches and Product Upgradations, 2016�2017
Table 74 Partnerships, Collaborations, and Agreements, 2015�2017
Table 75 Mergers and Acquisitions, 2015�2017
Table 76 Business Expansions, 2017
List of Figures (40 Figures)
Figure 1 Data Masking Market: Market Segmentation
Figure 2 Regional Scope
Figure 3 Data Masking Market: Research Design
Figure 4 Data Triangulation
Figure 5 Market Size Estimation Methodology: Bottom-Up Approach
Figure 6 Market Size Estimation Methodology: Top-Down Approach
Figure 7 Market Assumptions
Figure 8 Market By Component (2017 vs 2022)
Figure 9 Market By Service 2017
Figure 10 Market By Professional Service 2017
Figure 11 Market By Deployment Type 2017
Figure 12 Market By Masking Type 2017
Figure 13 Market By Vertical (2017 vs 2022)
Figure 14 Data Masking Market By Business Function 2017
Figure 15 Market By Organization Size 2017
Figure 16 The Market is Expected to Witness Remarkable Growth Opportunities Due to the Increasing Need to Protect the Data From Unnecessary Internal Exposure and External Service Providers
Figure 17 North America, and Retail and Ecommerce Vertical are Estimated to Have the Largest Market Shares in 2017
Figure 18 Data Masking Market: Drivers, Restraints, Opportunities, and Challenges
Figure 19 Dynamic Data Masking Type is Expected to Grow at A Higher CAGR During the Forecast Period
Figure 20 Marketing and Sales Business Function is Expected to Grow at the Highest CAGR During the Forecast Period
Figure 21 Services Segment is Expected to Grow at A Higher CAGR During the Forecast Period
Figure 22 Managed Services Segment is Expected to Grow at A Higher CAGR During the Forecast Period
Figure 23 Consulting Services Segment is Expected to Grow at A Higher CAGR During the Forecast Period
Figure 24 Cloud Deployment Type is Expected to Grow at A Higher CAGR During the Forecast Period
Figure 25 Small and Medium-Sized Enterprises Segment is Expected to Grow at A Higher CAGR During the Forecast Period
Figure 26 Banking, Financial Services, and Insurance Vertical is Expected to Grow at the Highest CAGR During the Forecast Period
Figure 27 Asia Pacific is Expected to Grow at the Highest CAGR During the Forecast Period
Figure 28 North America is Expected to Have the Largest Market Size During the Forecast Period
Figure 29 North America: Market Snapshot
Figure 30 Asia Pacific: Market Snapshot
Figure 31 Key Developments By Leading Players in the Data Masking Market, 2015�2017
Figure 32 IBM: Company Snapshot
Figure 33 IBM: SWOT Analysis
Figure 34 Informatica: SWOT Analysis
Figure 35 CA Technologies: Company Snapshot
Figure 36 CA Technologies: SWOT Analysis
Figure 37 Solix: SWOT Analysis
Figure 38 IRI: SWOT Analysis
Figure 39 Micro Focus: Company Snapshot
Figure 40 Oracle: Company Snapshot


Growth opportunities and latent adjacency in Data Masking Market