Dairy Enzymes Market by Type (Lactase, Chymosin, Microbial Rennet, Lipase), Application (Milk, Cheese, Ice Cream & Desserts, Yogurt, Whey, Infant Formula), Source (Plant, Animal & Microorganism), and Region - Global Forecast to 2022
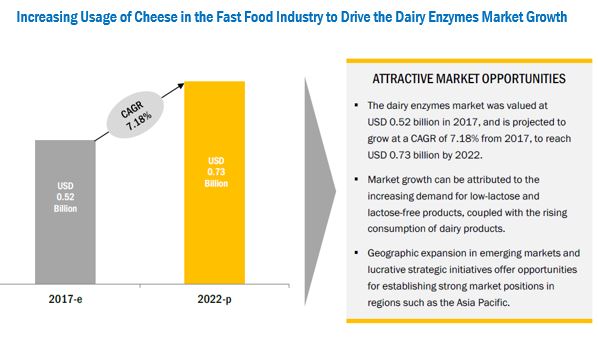
[119 Pages Report] The dairy enzymes market is predicted to grow at a CAGR of 7.18% from 2017, to reach USD 734.6 Million by 2022. The base year considered for the study is 2016, while the forecast period spans from 2017 to 2022. The basic objective of the report is to define, segment, and project the global dairy enzymes market size on the basis of type, source, application, and region. It also helps to understand the structure of the market by identifying its various segments. The other objectives include analyzing the opportunities in the market for the stakeholders and providing the competitive landscape of the market trends, and projecting the size of the market and its submarkets, in terms of value.

For More details on this research, Request Free Sample Report
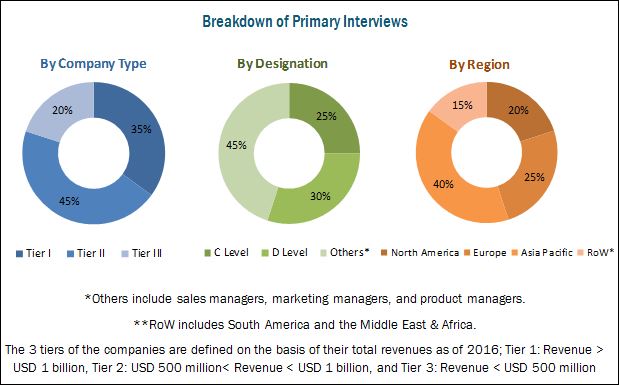
This report includes estimations of the market size in terms of value (USD million). Both top-down and bottom-up approaches have been used to estimate and validate the size of the global dairy enzymes market and to estimate the size of various other dependent submarkets. The key players in the market have been identified through secondary research; some of these sources are press releases, paid databases such as Factiva and Bloomberg, annual reports, and financial journals; their market shares in the respective regions have also been determined through primary and secondary research. All percentage shares, splits, and breakdowns have been determined using secondary sources and were verified through primary sources. The figure below shows the breakdown of the profiles of industry experts that participated in the primary discussions.

To know about the assumptions considered for the study, download the pdf brochure
Key participants in the market are the dairy enzyme manufacturers, suppliers, and end users. The key players that are profiled in the report include DowDuPont (US), Kerry Group (Ireland), DSM (Netherlands), Chr. Hansen (Denmark), Novozymes (Denmark), Advanced Enzymes Technologies (India), Amano Enzymes (Japan), Fytozimus Biotech (Canada), Enmex (Mexico), SternEnzym (Germany), Biocatalysts (UK), and Connell Bros (US).
This report is targeted at the existing players in the industry, which include the following:
- Raw material suppliers
- Dairy enzyme manufacturers/suppliers, importers, and exporters
- Intermediary suppliers
- Consumers/End-user industries
“The study answers several questions for the stakeholders; primarily, which market segments to focus on in the next two to five years, for prioritizing efforts and investments.”
Scope of the Report
On the basis of Type, the market has been segmented as follows:
- Lactase
- Chymosin
- Microbial rennet
- Lipase
- Others (proteases and catalases)
On the basis of Source, the market has been segmented as follows:
- Plant
- Animal & microorganism
On the basis of Application, the market has been segmented as follows:
- Milk
- Cheese
- Ice cream & desserts
- Yogurt
- Whey
- Infant formula
- Others (butter and edible cream products)
On the basis of Region, the market has been segmented as follows:
- North America
- Europe
- Asia Pacific
- RoW (South America and the Middle East & Africa)
Available Customizations
With the given market data, MarketsandMarkets offers customizations according to the company’s specific needs.
The following customization options are available for the report:
Segment Analysis
- Product matrix, which gives a detailed comparison of the product portfolio of each company
- Detailed analysis at the volume level can also be provided
Regional Analysis
- Further breakdown of the Rest of Asia Pacific market for dairy enzymes, by country
- Further breakdown of the Rest of European market for dairy enzymes, by country
Company Information
- Detailed analysis and profiling of additional market players (up to five)
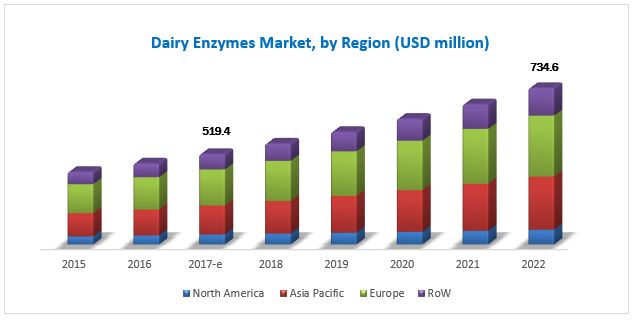
The dairy enzymes market is estimated at USD 519.4 Million in 2017, and is projected to reach USD 734.6 Million by 2022, at a CAGR of 7.18% during the forecast period. The global demand for dairy enzymes is increasing significantly due to the increasing consumption of dairy products such as cheese and yogurt, growing demand for low-lactose and lactose-free dairy products, and environmental benefits associated with enzymes.
Based on type, the microbial rennet segment is projected to grow at the highest CAGR from 2017 to 2022. Microbial rennet is considered vegetarian-friendly as the enzyme produced by the microorganism is not derived from animals. Moreover, microbial rennet is less expensive than animal rennet. These are the major factors driving the growth of the microbial rennet segment, worldwide.
The cheese segment is estimated to account for the largest share of the market in 2017. Various microbes such as Aspergillus oryzae, Irpex, and Rhizomucor pusillus are extensively used for rennet production during the cheese making process. Most cheese producers expedite the curdling process with rennet, lactic acid, or plant-based enzymes from wild artichokes, fig leaves, safflowers, or melons. Other than plants and microbes, enzymes are also extracted from young ruminants.
The animal & microorganism segment is estimated to account for a larger share of the global market in 2017. They are the most popular source of dairy enzymes preferred by manufacturers due to the extraction process. Also, comprehensive research on microorganisms is easier to perform and more cost-effective as compared to plant-sourced dairy enzymes.
The Asia Pacific region is projected to be the fastest-growing market for dairy enzymes during the forecast period as its economic importance has increased in the last decade. India and China are the main countries contributing to the high demand for dairy enzymes in this region. The region’s enhanced industrialized growth over the years, followed by improvements in the food & beverage industry, has opened up new opportunities for the market for dairy enzymes. The economic growth of the region, coupled with the increasing demand for nutritious dairy products is expected to fuel growth in the future. North America is estimated to account for the largest share in 2017, followed by Europe. The consumption of dairy enzymes has been dominant in developed regions such as North America and Europe due to the presence of a developed food processing industry. The significant presence of a large dairy industry offers the North American dairy enzymes market a prominent consumer base as well as growth prospects.

For More details on this research, Request Free Sample Report
The major restraining factors for the growth of the dairy enzymes market are the high chances of respiratory problems in people and allergies to various dairy products, especially milk. Dairy allergy is one of the major restraints for the dairy industry and, in turn, for the market.
Companies such as Chr. Hansen (Denmark), DowDuPont (US), DSM (Netherlands), Novozymes (Denmark), and Kerry Group (Ireland) collectively account for a share of more than half of the market. These companies have a strong presence in Europe and North America. They also have manufacturing facilities across these regions and a strong distribution network.
Frequently Asked Questions (FAQ):
What is the leading application in the dairy enzymes market?
The cheese segment was the highest revenue contributor to the market, with USD 324.6 million in 2016, and is estimated to reach USD 501.2 million by 2022, with a CAGR of 7.8%. The milk segment is estimated to reach USD 117.0 million by 2022, at a significant CAGR of 5.7% during the forecast period.
What is the estimated industry size of dairy enzymes?
The global dairy enzymes market was valued at USD 492.2 million in 2016, and is projected to reach USD 734.7 million by 2022, registering a CAGR of 7.2% from 2017 to 2022.
What is the leading type of dairy enzymes market?
The chymosin segment was the highest revenue contributor to the market, with USD 280.2 million in 2016, and is estimated to reach USD 424.7 million by 2022, with a CAGR of 7.5%. .
To speak to our analyst for a discussion on the above findings, click Speak to Analyst

Table of Contents
1 Introduction (Page No. - 12)
1.1 Objectives of the Study
1.2 Market Definition
1.3 Market Scope
1.3.1 Years Considered for the Study
1.4 Currency
1.5 Stakeholders
2 Research Methodology (Page No. - 16)
2.1 Research Data
2.1.1 Secondary Data
2.1.2 Primary Data
2.1.2.1 Breakdown of Primaries
2.2 Market Size Estimation
2.2.1 Bottom-Up Approach
2.2.2 Top-Down Approach
2.3 Data Triangulation
2.4 Assumptions & Limitations
2.4.1 Assumptions
2.4.2 Limitations
3 Executive Summary (Page No. - 23)
4 Premium Insights (Page No. - 27)
4.1 Attractive Opportunities in the Market
4.2 Dairy Enzymes Market Size, By Application, 2017 vs 2022
4.3 Market for Dairy Enzymes, By Type, 2017 vs 2022
4.4 Market for Dairy Enzymes, By Application & Region
4.5 North American Dairy Enzymes Market, By Type & Country
5 Dairy Enzymes Market Overview (Page No. - 30)
5.1 Introduction
5.2 Dairy Enzymes Market Dynamics
5.2.1 Drivers
5.2.1.1 Increasing Consumption of Dairy Products
5.2.1.2 Growing Demand for Low-Lactose and Lactose-Free Dairy Products
5.2.1.3 Environmental Benefits Associated With Enzymes
5.2.2 Restraints
5.2.2.1 Restricted Operational Conditions
5.2.2.2 Dairy Allergies
5.2.3 Opportunities
5.2.3.1 Emerging Applications of Dairy By-Products
5.2.3.2 Abolition of Milk Quota in the European Union
5.2.4 Challenges
5.2.4.1 Safety and Regulatory Aspects of Enzyme Use
5.2.4.2 Controversy Around Fermentation-Processed Chymosin (FPC) and GMO
6 Dairy Enzymes Market By Type (Page No. - 35)
6.1 Introduction
6.2 Lactase
6.3 Chymosin
6.4 Microbial Rennet
6.5 Lipase
6.6 Others
7 Dairy Enzymes Market by Application (Page No. - 43)
7.1 Introduction
7.2 Milk
7.3 Cheese
7.4 ICE Cream & Desserts
7.5 Yogurt
7.6 Whey
7.7 Infant Formula
7.8 Others
8 Dairy Enzymes Market, by Source (Page No. - 52)
8.1 Introduction
8.2 Plant
8.3 Animal & Microorganism
9 Dairy Enzymes Market by Region (Page No. - 56)
9.1 Introduction
9.2 North America
9.2.1 US
9.2.2 Canada
9.2.3 Mexico
9.3 Europe
9.3.1 Germany
9.3.2 France
9.3.3 Italy
9.3.4 UK
9.3.5 Spain
9.3.6 Rest of Europe
9.4 Asia Pacific
9.4.1 China
9.4.2 India
9.4.3 Japan
9.4.4 Australia & New Zealand
9.4.5 Rest of Asia Pacific
9.5 Rest of the World (RoW)
9.5.1 South America
9.5.2 Middle East & Africa
10 Competitive Landscape (Page No. - 84)
10.1 Overview
10.2 Market Ranking
10.3 Key Market Strategies
10.4 Competitive Scenario
10.4.1 Expansions & Investments
10.4.2 New Product Launches
10.4.3 Mergers & Acquisitions
10.4.4 Agreements, Partnerships, Collaborations, and Joint Ventures
11 Company Profiles (Page No. - 90)
(Business Overview, Products Offered, Recent Developments, SWOT Analysis & MnM View)*
11.1 CHR. Hansen
11.2 Dowdupont
11.3 DSM
11.4 Kerry Group
11.5 Novozymes
11.6 Advanced Enzymes Technologies
11.7 Amano Enzyme
11.8 Connell Bros.
11.9 Biocatalysts
11.10 SternEnzym
11.11 Enmex
11.12 Fytozimus Biotech
*Details on Business Overview, Products Offered, Recent Developments, SWOT Analysis & MnM View Might Not Be Captured in Case of Unlisted Companies.
12 Appendix (Page No. - 111)
12.1 Discussion Guide
12.2 Knowledge Store: Marketsandmarkets’ Subscription Portal
12.3 Introducing RT: Real-Time Market Intelligence
12.4 Available Customizations
12.5 Related Reports
12.6 Author Details
List of Tables (67 Tables)
Table 1 US Dollar Exchange Rates Considered for the Study, 2014–2016
Table 2 Dairy Enzymes Market Size, By Type, 2015–2022 (USD Million)
Table 3 Lactase Market Size, By Region, 2015–2022 (USD Million)
Table 4 Lactase Market Size, By Application, 2015–2022 (USD Million)
Table 5 Chymosin Market Size, By Region, 2015–2022 (USD Million)
Table 6 Microbial Rennet Market Size, By Region, 2015–2022 (USD Million)
Table 7 Chymosin and Microbial Rennet Market Size, By Application, 2015–2022 (USD Million)
Table 8 Lipase Market Size, By Region, 2015–2022 (USD Million)
Table 9 Lipase Market Size, By Application, 2015–2022 (USD Million)
Table 10 Other Market for Dairy Enzymes Size, By Region, 2015–2022 (USD Million)
Table 11 Other Dairy Enzymes Market Size, By Application, 2015–2022 (USD Million)
Table 12 Market for Dairy Enzymes Size, By Application, 2015–2022 (USD Million)
Table 13 Milk: By Market, By Region, 2015–2022 (USD Million)
Table 14 Cheese: By Market Size, By Region, 2015–2022 (USD Million)
Table 15 ICE Cream & Desserts: By Market Size, By Region, 2015–2022 (USD Million)
Table 16 Yogurt: Market for Dairy Enzymes Size, By Region, 2015–2022 (USD Million)
Table 17 Whey: Market for Dairy Enzymes Size, By Region, 2015–2022 (USD Million)
Table 18 Infant Formula: By Market Size, By Region, 2015–2022 (USD Million)
Table 19 Other Applications: By Market Size, By Region, 2015–2022 (USD Million)
Table 20 Market for Dairy Enzymes Size, By Source, 2015–2022 (USD Million)
Table 21 Plant-Sourced DE Market Size, By Region, 2015–2022 (USD Million)
Table 22 Animal & Microorganism-Sourced Enzymes Market Size, By Region, 2015–2022 (USD Million)
Table 23 Market for Dairy Enzymes Size, By Region, 2015–2022 (USD Million)
Table 24 North America: Market for Dairy Enzymes Size, By Country, 2015–2022 (USD Million)
Table 25 North America: By Market Size, By Source, 2015–2022 (USD Million)
Table 26 North America: By Market Size, By Type, 2015–2022 (USD Million)
Table 27 North America: By Market Size, By Application, 2015–2022 (USD Million)
Table 28 US: Dairy Enzymes Market Size, By Source, 2015–2022 (USD Million)
Table 29 US: By Market Size, By Type, 2015–2022 (USD Million)
Table 30 US: By Market Size, By Application, 2015–2022 (USD Million)
Table 31 Canada: Market for Dairy Enzymes Size, By Source, 2015–2022 (USD Million)
Table 32 Mexico: By Market Size, By Source, 2015–2022 (USD Million)
Table 33 Europe: By Market Size, By Country, 2015–2022 (USD Million)
Table 34 Europe: By Market Size, By Source, 2015–2022 (USD Million)
Table 35 Europe: By Market Size, By Type, 2015–2022 (USD Million)
Table 36 Europe: Dairy Enzymes Market Size, By Application, 2015–2022 (USD Million)
Table 37 Germany: By Market Size, By Source, 2015–2022 (USD Million)
Table 38 Germany: By Market Size, By Type, 2015–2022 (USD Million)
Table 39 Germany: By Market Size, By Application, 2015–2022 (USD Million)
Table 40 France: Market for Dairy Enzymes Size, By Source, 2015–2022 (USD Million)
Table 41 Italy: By Market Size, By Source, 2015–2022 (USD Million)
Table 42 UK: By Market Size, By Source, 2015–2022 (USD Million)
Table 43 Spain: Market for Dairy Enzymes Size, By Source, 2015–2022 (USD Million)
Table 44 Rest of Europe: Market for Dairy Enzymes Size, By Source, 2015–2022 (USD Million)
Table 45 Asia Pacific: By Market Size, By Country, 2015-2022 (USD Million)
Table 46 Asia Pacific: By Market Size, By Source, 2015-2022 (USD Million)
Table 47 Asia Pacific: By Market Size, By Type, 2015-2022 (USD Million)
Table 48 Asia Pacific: By Market Size, By Application, 2015-2022 (USD Million)
Table 49 China: Dairy Enzymes Market Size, By Source, 2015-2022 (USD Million)
Table 50 India: Dairy By Size, By Source, 2015-2022 (USD Million)
Table 51 Japan: Market for Dairy Enzymes Size, By Source, 2015-2022 (USD Million)
Table 52 Australia & New Zealand: Market for Dairy Enzymes Size, By Source, 2015-2022 (USD Million)
Table 53 Australia & New Zealand: By Market Size, By Type, 2015-2022 (USD Million)
Table 54 Australia & New Zealand: By Market Size, By Application, 2015-2022 (USD Million)
Table 55 Rest of Asia Pacific: Market for Dairy Enzymes Size, By Source, 2015-2022 (USD Million)
Table 56 RoW: By Market Size, By Region, 2015–2022 (USD Million)
Table 57 RoW: By Market Size, By Source, 2015–2022 (USD Million)
Table 58 RoW: By Market Size, By Type, 2015–2022 (USD Million)
Table 59 RoW: By Market Size, By Application, 2015–2022 (USD Million)
Table 60 South America: DE Market Size, By Source, 2015–2022 (USD Million)
Table 61 South America: By Market Size, By Type, 2015–2022 (USD Million)
Table 62 South America: By Market Size, By Application, 2015–2022 (USD Million)
Table 63 Middle East & Africa: Dairy Enzymes Market Size, By Source, 2015–2022 (USD Million)
Table 64 Expansions & Investments, 2012–2017
Table 65 New Product Launches, 2012–2017
Table 66 Mergers & Acquisitions, 2012–2017
Table 67 Agreements, Partnerships, Collaborations, and Joint Ventures, 2012–2017
List of Figures (34 Figures)
Figure 1 Dairy Enzymes Market Segmentation
Figure 2 Geographic Scope
Figure 3 Dairy Enzymes Market: Research Design
Figure 4 Market Size Estimation Methodology: Bottom-Up Approach
Figure 5 Market Size Estimation Methodology: Top-Down Approach
Figure 6 Data Triangulation & Methodology
Figure 7 Market for Dairy Enzymes Snapshot, By Type, 2017 vs 2022
Figure 8 Market for Dairy Enzymes Snapshot, By Application, 2017 vs 2022
Figure 9 Market for Dairy Enzymes Size, By Source, 2017 vs 2022
Figure 10 Market for Dairy Enzymes Size, By Region, 2016
Figure 11 Increasing Usage of Cheese in the Fast Food Industry to Drive the Growth of Market for Dairy Enzymes in Forecast Period
Figure 12 Cheese Application Accounted for the Largest Share of the Market in 2017
Figure 13 Chymosin is Projected to Remain the Largest Market By 2022
Figure 14 Cheese Application was the Largest Segment Across All Regions in 2016
Figure 15 US & Chymosin Accounted for the Largest Share of the North American Dairy Enzymes Market in 2016
Figure 16 Market for Dairy Enzymes Dynamics
Figure 17 Yogurt Consumption in the US, 1991—2014 (Pounds Per Capita)
Figure 18 Growth of Lactose-Free Products with respect to Dairy Products (CAGR for 2007 to 2012 & 2012 to 2017)
Figure 19 Geographic Snapshot (2017–2022): Dairy Enzyme Market
Figure 20 US Dominated the Market for Dairy Enzymes in North America in 2016
Figure 21 Germany was the largest dairy enzymes market in the Europe
Figure 22 Australia & New Zealand was the largest market for dairy enzymes in the Asia Pacific
Figure 23 Top Five Players Led the Global DE Market, 2016
Figure 24 Dairy Enzymes Market Developments, By Growth Strategy, 2012–2017
Figure 25 CHR. Hansen: Company Snapshot
Figure 26 CHR. Hansen: SWOT Analysis
Figure 27 Dowdupont: SWOT Analysis
Figure 28 DSM: Company Snapshot
Figure 29 DSM: SWOT Analysis
Figure 30 Kerry Group: Company Snapshot
Figure 31 Kerry Group: SWOT Analysis
Figure 32 Novozymes: Company Snapshot
Figure 33 Novozymes: SWOT Analysis
Figure 34 Advanced Enzymes Technologies: Company Snapshot


Growth opportunities and latent adjacency in Dairy Enzymes Market