Construction Sealants Market by Resin Type (Silicone, Polyurethane, Polysulfide), Application (Glazing, Flooring & Joining, Sanitary & Kitchen), and Region (Asia-Pacific, Europe, North America, South America, Middle East & Africa) - Global Forecast to 2028
Construction Sealants Market
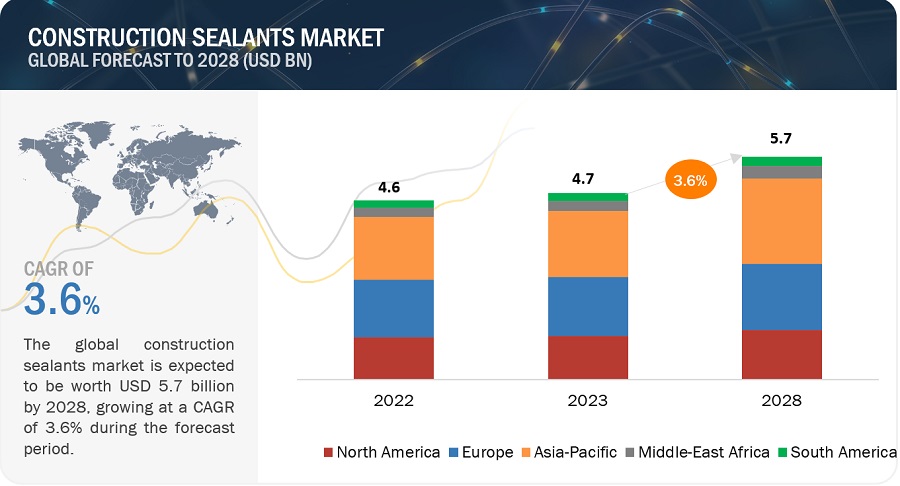
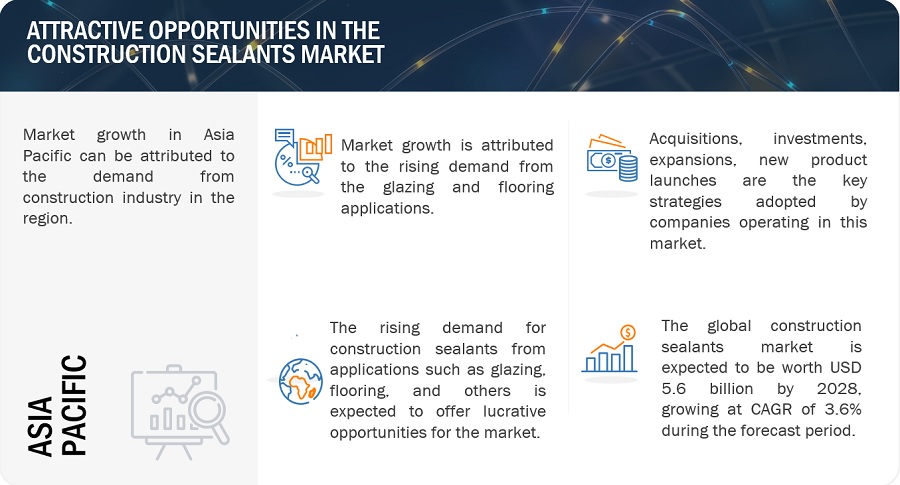
The global construction sealants market is projected to grow from USD 4.7 billion in 2023 to USD 5.7 billion by 2028, at a cagr 3.6% between 2023 and 2028. The increasing demand from commercial offices and residential housing, along with rising infrastructure output from key sub-sectors, such as rail, energy, roads, and water and sewerage, is boosting the demand for construction sealants.
Attractive Opportunities in the Construction Sealants Market
To know about the assumptions considered for the study, Request for Free Sample Report
Source: Expert Interviews, Secondary Sources, and MarketsandMarkets Analysis
Construction Sealants Market Dynamics
Drivers: Increased demand for construction sealants in residential housing and infrastructure sectors
The key application areas of construction sealants include flooring & joining, glazing, and sanitary & kitchen, among others. These applications are growing, which has subsequently increased the growth of the construction sealants market. The increasing penetration of sealants in new construction applications, such as anchoring application, ductwork, and structural glazing, is driving the construction sealants market. The major applications of construction sealants are in sanitary & kitchen, window framing, floor systems, expansion joints, walls, and panels. Under changing atmospheric conditions, construction sealants prevent cracking and provide stress-bearing capability. Increase in investments in construction activities, such as bridges, airports, metro stations, and dams are also increasing the demand for sealants for flooring, panels, expansion joints, and other applications.
Restraints: Environmental regulations in North American and European countries
Due to the increase in regulatory policies and environmental concerns, various countries are using eco-friendly products in many applications. Global construction sealants manufacturers are focusing on ensuring safety and avoiding health issues related to VOC emissions from chemical products. This is affecting the production capacities of manufacturers in North American and European regions. North America and Europe are strictly regulated by environmental laws related to the production of petro-based and chemical products. Agencies such as the the EC, Epoxy Resin Committee (ERC), and other regulatory bodies govern the manufacture of solvent-based products in North America and Europe. These regulations are restraining the growth of the construction sealants market.
Opportunities: Growing demand for low VOC, green, and sustainable sealants
Owing to a rising trend in various applications to use environment-friendly or green products, the demand for green sealants or those with low VOCs is increasing. Stringent regulations implemented by the US Environmental Protection Agency (EPA), Europe’s Registration, Evaluation, Authorisation and Restriction of Chemicals (REACH), Leadership in Energy and Environmental Design (LEED), and other regional regulatory authorities have forced the manufacturers to make environment-friendly sealants with low VOC levels. Shifting toward a more sustainable product portfolio has provided the industry with a significant growth opportunity. There is a growing trend in the construction market to use environment-friendly or green buildings; therefore, there is high growth potential for the development of green and more sustainable sealant solutions.
Challenges: Shifting rules and changing standards
Regulations regarding the use of construction sealants are undergoing many changes, that pose challenges to the construction sealants manufacturers. For instance, the changes in rules and standards imposed by the Construction Products Regulation (CPR) are a cause of concern for construction sealants manufacturers, as they determine the minimum or maximum performance levels of the construction products. The construction sealants products that are currently available in the market are not very technologically advanced, and the new products would require labeling and paperwork to demonstrate compliance and additional external test costs.
Construction Sealants Market Ecosystem
Silicone resin type accounted for the largest share of the construction sealants market.
Globally, the construction industry is experiencing substantial growth, driven by infrastructure development, urbanization, and increasing construction projects. As construction activities expand, the demand for reliable, high-performance sealants like silicone sealants increases. Asia Pacific is the largest consumer of silicone construction sealants for bathroom and kitchen applications. Silicone sealants are waterproof and provide excellent durability, flexibility, and long-lasting bond around non-porous surfaces.
Glazing is the fastest-growing application of the construction sealants market.
Glazing is the fastest-growing application segment of the construction sealants market. Construction sealants are extensively used in glazing applications to seal joints, gaps, and interfaces between glass panels, frames, and other building components. Sealants used in glazing applications provide weatherproofing, air and water leakage prevention, thermal insulation, and structural support. Glazing sealants are available in various forms, including silicone, polyurethane, and hybrid formulations, each offering different properties, such as flexibility, adhesion strength, UV resistance, and weatherability.
Residential is the largest end-use industry of the construction sealants market.
The residential construction industry is growing rapidly, particularly in emerging countries in the Middle East & Africa and Asia Pacific. This growth is attributed to good economic growth and higher income levels. Homeownership has seen rapid growth in the past few years, and the market is projected to grow over the next decade. Increasing urbanization and housing facilities have surged the demand for construction sealants in the new construction segment.
To know about the assumptions considered for the study, download the pdf brochure
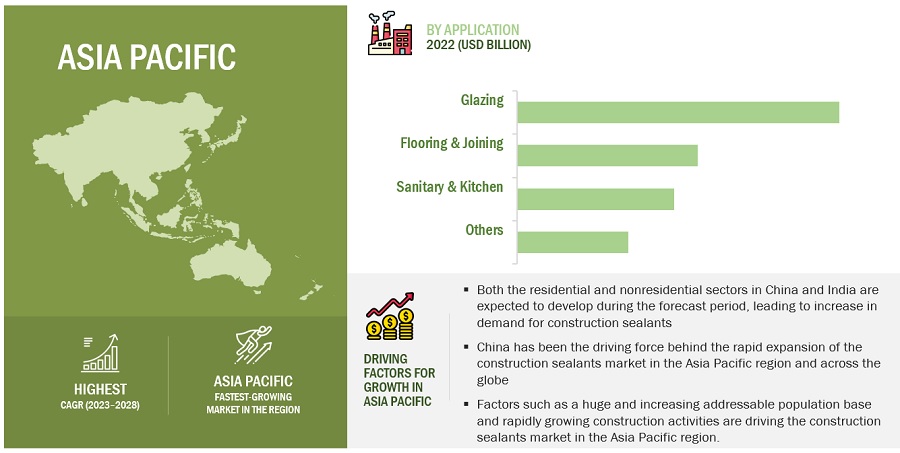
Asia Pacific is the fastest-growing construction sealants market.
Asia Pacific has emerged as one of the leading producers as well as consumers of construction sealants. There is high demand for construction sealants in the emerging markets of Asia Pacific due to the significant growth of the construction industry. New construction activities, repainting, and growing investment in emerging markets are the key factors providing market players with growth opportunities. The North American and European manufacturers are exposed to tough competition from the Asia Pacific market, as the cost is an important factor for customers, and the local manufacturers in the Asia Pacific are successfully providing similar construction sealants at lower costs.
Construction Sealants Market Players
3M (US), Arkema (France), Sika AG (Switzerland), Henkel AG & Co. KGaA (Germany), and H.B. Fuller (US) are the key players in the global construction sealants market.
Construction Sealants Market Report Scope
|
Report Metric |
Details |
|
Market Size Value in 2023 |
USD 4.7 billion |
|
Revenue Forecast in 2028 |
USD 5.7 billion |
|
CAGR |
3.6% |
|
Years Considered for the study |
2020-2028 |
|
Base year |
2022 |
|
Forecast period |
2023–2028 |
|
Units considered |
Value (USD) |
|
Segments |
By Resin Type |
|
Regions covered |
Asia Pacific, Europe, North America, Middle East & Africa, South America |
|
Companies profiled |
3M (US), Arkema (France), Sika AG (Switzerland), Henkel AG & Co. KGaA (Germany), and H.B. Fuller (US). A total of 25 players have been covered. |
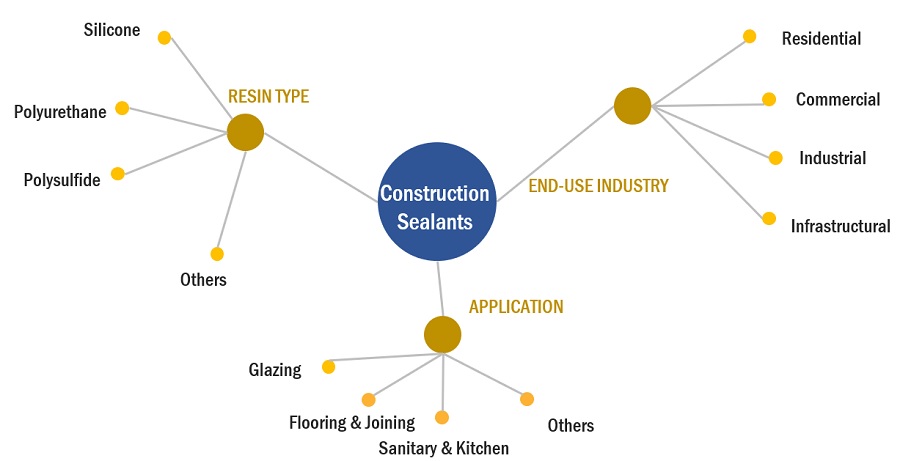
This research report categorizes the construction sealants market based on Resin Type, Application, End-use Industry, and Region.
By Resin Type:
- Silicone
- Polyurethane
- Polysulfide
- Others
By Application:
- Glazing
- Flooring & Joining
- Sanitary & Kitchen
- Others
By End-use Industry
- Residential
- Commercial
- Industrial
- Infrastructural
By Region:
- Asia Pacific
- Europe
- North America
- Middle East & Africa
- South America
Recent Developments
- In June 2023, Sika is opening a new plant in Kharagpur, eastern India, and continues to expand production capacity in the fast-growing Indian market. The plant will manufacture mortar products, concrete admixtures, and shotcrete accelerators for customers in the West Bengal region, which has more than 100 million inhabitants.
- In May 2023, Henkel officially opened its Technology Center in Bridgewater, New Jersey. Occupying 70,000 square ft., the center provides a unique and interactive destination for the company's strategic partners and customers. The facility showcases Henkel's entire technology portfolio of adhesives, sealants, functional coatings, and specialty materials and supports an environment for collaboration with customers from over 800 industry segments to develop innovative solutions.
- In March 2022, Bostik concluded a distribution agreement with DGE for Europe, the Middle East, and Africa. The agreement, valid as of January 2022, includes Born2Bond engineering adhesives designed for ‘by-the-dot’ bonding applications in selected industries, such as electronics, luxury packaging, automotive, medical devices, and MRO; as well as Bostik’s Industrial Adhesives & Sealants used in the manufacture and assembly of components across a diverse range of industrial sectors.
Frequently Asked Questions (FAQ):
What is the current size of the global construction sealants market?
Construction sealants market is projected to grow from USD 4.7 billion in 2023 and is projected to reach USD 5.7 billion by 2028, at a CAGR of 3.6%, between 2023 and 2028 period.
Which segment has the potential to register the highest market share for the construction sealants market?
Glazing is the largest application segment, in terms of both value and volume, in 2022.
Who are the major manufacturers?
3M (US), Arkema (France), Sika AG (Switzerland), Henkel AG & Co. KGaA (Germany), and H.B. Fuller (US) are some of the leading players operating in the global construction sealants market.
What are the reasons behind construction sealants gaining market share?
Construction sealants are gaining market share due to the increasing demand from commercial offices and residential housing, along with rising infrastructure output from key sub-sectors, such as rail, roads, energy, and water and sewerage, which will drive the market for construction sealants.
Which is the fastest-growing region in the market?
Asia Pacific is projected to be the fastest-growing market for construction sealants market during the forecast period. .
To speak to our analyst for a discussion on the above findings, click Speak to Analyst


-
5.1 INTRODUCTIONFOUR BASIC FUNCTIONS OF SEALANTSIMPORTANCE OF SEALANTSADVANTAGES OF CONSTRUCTION SEALANTSDISADVANTAGES OF CONSTRUCTION SEALANTS
- 5.2 MARKET EVOLUTION
-
5.3 MARKET DYNAMICSDRIVERS- Increased demand for construction sealants in housing and infrastructure sectors- Rising demand from emerging countries- Construction sealants provide safety and ease of application- Rising demand for glazing and panels in new high-rise buildingsRESTRAINTS- Environmental regulations in North American and European countriesOPPORTUNITIES- Growing demand for low-VOC, green, and sustainable sealantsCHALLENGES- Health hazards during manufacture of construction sealants
-
5.4 PORTER’S FIVE FORCES ANALYSISTHREAT OF SUBSTITUTESBARGAINING POWER OF BUYERSTHREAT OF NEW ENTRANTSBARGAINING POWER OF SUPPLIERSINTENSITY OF COMPETITIVE RIVALRY
-
5.5 MACROECONOMIC INDICATORSTRENDS AND FORECASTS OF GDPTRENDS AND FORECASTS OF GLOBAL CONSTRUCTION INDUSTRY
- 6.1 INTRODUCTION
-
6.2 SILICONEINCREASING CONSTRUCTION ACTIVITIES TO DRIVE MARKETONE-COMPONENTTWO-COMPONENT
-
6.3 POLYURETHANEHIGH INSULATION AND SUSTAINABILITY TO DRIVE MARKETONE-COMPONENT- Moisture cured- Heat curedTWO-COMPONENT
-
6.4 POLYSULFIDECHEMICAL RESISTANCE TO FUEL DEMAND FOR POLYSULFIDE SEALANTSONE-COMPONENTTWO-COMPONENT
- 6.5 OTHER RESIN TYPES
- 7.1 INTRODUCTION
-
7.2 GLAZINGINVESTMENTS IN NEW INFRASTRUCTURE TO DRIVE MARKET
-
7.3 FLOORING & JOININGRISE IN INFRASTRUCTURAL PROJECTS TO DRIVE MARKET
-
7.4 SANITARY & KITCHENFLEXIBILITY AND ENVIRONMENTAL RESISTANCE TO DRIVE MARKET
- 7.5 OTHER APPLICATIONS
- 8.1 INTRODUCTION
-
8.2 RESIDENTIALENERGY EFFICIENCY AND LOW MAINTENANCE COSTS TO INCREASE DEMAND FOR CONSTRUCTION SEALANTS
-
8.3 NONRESIDENTIALNEED FOR LARGE DISTRIBUTION AND FULFILLMENT CENTERS TO DRIVE MARKET
-
8.4 COMMERCIAL & INFRASTRUCTUREINFRASTRUCTURE DEVELOPMENT IN EMERGING ECONOMIES TO DRIVE MARKET
-
9.1 INTRODUCTIONGLOBAL RECESSION OVERVIEW
-
9.2 ASIA PACIFICRECESSION IMPACTCHINA- Rise in foreign investments to drive marketJAPAN- Investments in commercial reconstruction to boost demand for construction sealantsINDIA- Boom in real estate industry to drive marketINDONESIA- Foreign investments in residential construction to drive marketTHAILAND- Increasing awareness about architectural coating products to drive marketMALAYSIA- Heavy infrastructure investments to drive marketSOUTH KOREA- Increasing construction activities to drive marketREST OF ASIA PACIFIC
-
9.3 EUROPERECESSION IMPACTGERMANY- Favorable economic environment to increase demand for construction sealantsITALY- New project finance rules and investment policies to drive marketFRANCE- Favorable demographic trends to fuel marketUK- Growth of construction sector to drive marketTURKEY- Robust macroeconomic growth to drive marketRUSSIA- Population growth to fuel demand for construction sealants in residential constructionSPAIN- Adoption of advanced technology to fuel demand for construction sealantsREST OF EUROPE
-
9.4 NORTH AMERICARECESSION IMPACTUS- Growth of private residential and nonresidential construction to boost marketCANADA- Foreign trade to fuel demand for construction sealantsMEXICO- Investments in commercial infrastructure to drive market
-
9.5 SOUTH AMERICARECESSION IMPACTBRAZIL- Rising living standards and easier credit availability to fuel marketARGENTINA- Improved economic conditions to drive marketCOLOMBIA- Demographic shifts and urbanization to drive marketREST OF SOUTH AMERICA
-
9.6 MIDDLE EAST & AFRICARECESSION IMPACTSAUDI ARABIA- Mega housing projects to boost demand for construction sealantsUAE- New infrastructural development to drive marketEGYPT- New residential projects to fuel demand for premium coatingsREST OF MIDDLE EAST & AFRICA

- 10.1 OVERVIEW
-
10.2 COMPANY EVALUATION MATRIX, 2022STARSEMERGING LEADERSPERVASIVE PLAYERSPARTICIPANTS
- 10.3 STRENGTH OF PRODUCT PORTFOLIO
-
10.4 MARKET SHARE ANALYSISHENKEL AG & CO. KGAASIKA AGARKEMAH.B. FULLER3M
- 10.5 STRATEGIC DEVELOPMENTS
-
11.1 KEY PLAYERS3M- Business overview- Products offered- MnM viewARKEMA- Business overview- Products offered- Recent developments- MnM viewSIKA AG- Business overview- Products offered- Recent developments- MnM viewHENKEL AG & CO. KGAA- Business overview- Products offered- Recent developments- MnM viewH.B. FULLER- Business overview- Products offered- Recent developments- MnM viewBASF SE- Business overview- Products offeredTHE DOW CHEMICAL COMPANY- Business overview- Products offered- Recent developmentsWACKER CHEMIE AG- Business overview- Products offered- Recent developmentsGENERAL ELECTRIC COMPANY- Business overview- Products offered- Recent developmentsKONISHI CO., LTD.- Business overview- Products offered
-
11.2 OTHER PLAYERSMAPEI CORPORATION- Products offeredASIAN PAINTS LIMITED- Products offeredKCC CORPORATION- Products offeredPIDILITE INDUSTRIES LIMITED- Products offeredFRANKLIN INTERNATIONAL- Products offeredHOLCIM LTD.- Products offeredSOUDAL N.V.- Products offeredSELENA FM S.A.- Products offeredHODGSON SEALANTS (HOLDINGS) LTD.- Products offeredPECORA CORPORATION- Products offeredTHE EUCLID CHEMICAL COMPANY- Products offeredDEVAN SEALANTS, INC.- Products offered
- 12.1 DISCUSSION GUIDE
- 12.2 KNOWLEDGESTORE: MARKETSANDMARKETS’ SUBSCRIPTION PORTAL
- 12.3 CUSTOMIZATION OPTIONS
- 12.4 RELATED REPORTS
- 12.5 AUTHOR DETAILS
- TABLE 1 GLOBAL CONSTRUCTION SEALANTS MARKET SNAPSHOT (2023 VS. 2028)
- TABLE 2 GDP TRENDS AND FORECASTS, PERCENTAGE CHANGE OF KEY COUNTRIES, 2019–2028
- TABLE 3 CONSTRUCTION SEALANTS MARKET, BY RESIN TYPE, 2020–2022 (USD MILLION)
- TABLE 4 CONSTRUCTION SEALANT MARKET, BY RESIN TYPE, 2023–2028 (USD MILLION)
- TABLE 5 CONSTRUCTION SEALANTS MARKET, BY RESIN TYPE, 2020–2022 (KILOTON)
- TABLE 6 CONSTRUCTION SEALANT MARKET, BY RESIN TYPE, 2023–2028 (KILOTON)
- TABLE 7 SILICONE: CONSTRUCTION SEALANTS MARKET, BY REGION, 2020–2022 (USD MILLION)
- TABLE 8 SILICONE: CONSTRUCTION SEALANT MARKET, BY REGION, 2023–2028 (USD MILLION)
- TABLE 9 SILICONE: CONSTRUCTION SEALANTS MARKET, BY REGION, 2020–2022 (KILOTON)
- TABLE 10 SILICONE: CONSTRUCTION SEALANT MARKET, BY REGION, 2023–2028 (KILOTON)
- TABLE 11 POLYURETHANE: CONSTRUCTION SEALANTS MARKET, BY REGION, 2020–2022 (USD MILLION)
- TABLE 12 POLYURETHANE: CONSTRUCTION SEALANT MARKET, BY REGION, 2023–2028 (USD MILLION)
- TABLE 13 POLYURETHANE: CONSTRUCTION SEALANTS MARKET, BY REGION, 2020–2022 (KILOTON)
- TABLE 14 POLYURETHANE: CONSTRUCTION SEALANT MARKET, BY REGION, 2023–2028 (KILOTON)
- TABLE 15 POLYSULFIDE: CONSTRUCTION SEALANTS MARKET, BY REGION, 2020–2022 (USD MILLION)
- TABLE 16 POLYSULFIDE: CONSTRUCTION SEALANT MARKET, BY REGION, 2023–2028 (USD MILLION)
- TABLE 17 POLYSULFIDE: CONSTRUCTION SEALANTS MARKET, BY REGION, 2020–2022 (KILOTON)
- TABLE 18 POLYSULFIDE: CONSTRUCTION SEALANT MARKET, BY REGION, 2023–2028 (KILOTON)
- TABLE 19 OTHER TYPES: CONSTRUCTION SEALANTS MARKET, BY REGION, 2020–2022 (USD MILLION)
- TABLE 20 OTHER TYPES: CONSTRUCTION SEALANT MARKET, BY REGION, 2023–2028 (USD MILLION)
- TABLE 21 OTHER TYPES: CONSTRUCTION SEALANTS MARKET, BY REGION, 2020–2022 (KILOTON)
- TABLE 22 OTHER TYPES: CONSTRUCTION SEALANT MARKET, BY REGION, 2023–2028 (KILOTON)
- TABLE 23 CONSTRUCTION SEALANTS MARKET, BY APPLICATION, 2020–2022 (USD MILLION)
- TABLE 24 CONSTRUCTION SEALANT MARKET, BY APPLICATION, 2023–2028 (USD MILLION)
- TABLE 25 CONSTRUCTION SEALANTS MARKET, BY APPLICATION, 2020–2022 (KILOTON)
- TABLE 26 CONSTRUCTION SEALANT MARKET, BY APPLICATION, 2023–2028 (KILOTON)
- TABLE 27 GLAZING: CONSTRUCTION SEALANTS MARKET, BY REGION, 2020–2022 (USD MILLION)
- TABLE 28 GLAZING: CONSTRUCTION SEALANT MARKET, BY REGION, 2023–2028 (USD MILLION)
- TABLE 29 GLAZING: CONSTRUCTION SEALANTS MARKET, BY REGION, 2020–2022 (KILOTON)
- TABLE 30 GLAZING: CONSTRUCTION SEALANT MARKET, BY REGION, 2023–2028 (KILOTON)
- TABLE 31 FLOORING & JOINING: CONSTRUCTION SEALANTS MARKET, BY REGION, 2020–2022 (USD MILLION)
- TABLE 32 FLOORING & JOINING: CONSTRUCTION SEALANT MARKET, BY REGION, 2023–2028 (USD MILLION)
- TABLE 33 FLOORING & JOINING: CONSTRUCTION SEALANTS MARKET, BY REGION, 2020–2022 (KILOTON)
- TABLE 34 FLOORING & JOINING: CONSTRUCTION SEALANT MARKET, BY REGION, 2023–2028 (KILOTON)
- TABLE 35 SANITARY & KITCHEN: CONSTRUCTION SEALANTS MARKET, BY REGION, 2020–2022 (USD MILLION)
- TABLE 36 SANITARY & KITCHEN: CONSTRUCTION SEALANT MARKET, BY REGION, 2023–2028 (USD MILLION)
- TABLE 37 SANITARY & KITCHEN: CONSTRUCTION SEALANTS MARKET, BY REGION, 2020–2022 (KILOTON)
- TABLE 38 SANITARY & KITCHEN: CONSTRUCTION SEALANT MARKET, BY REGION, 2023–2028 (KILOTON)
- TABLE 39 OTHER APPLICATIONS: CONSTRUCTION SEALANTS MARKET, BY REGION, 2020–2022 (USD MILLION)
- TABLE 40 OTHER APPLICATIONS: CONSTRUCTION SEALANT MARKET, BY REGION, 2023–2028 (USD MILLION)
- TABLE 41 OTHER APPLICATIONS: CONSTRUCTION SEALANTS MARKET, BY REGION, 2020–2022 (KILOTON)
- TABLE 42 OTHER APPLICATIONS: CONSTRUCTION SEALANT MARKET, BY REGION, 2023–2028 (KILOTON)
- TABLE 43 CONSTRUCTION SEALANTS MARKET, BY END-USE INDUSTRY, 2020–2022 (USD MILLION)
- TABLE 44 CONSTRUCTION SEALANT MARKET, BY END-USE INDUSTRY, 2023–2028 (USD MILLION)
- TABLE 45 CONSTRUCTION SEALANTS MARKET, BY END-USE INDUSTRY, 2020–2022 (KILOTON)
- TABLE 46 CONSTRUCTION SEALANT MARKET, BY END-USE INDUSTRY, 2023–2028 (KILOTON)
- TABLE 47 RESIDENTIAL: CONSTRUCTION SEALANTS MARKET, BY REGION, 2020–2022 (USD MILLION)
- TABLE 48 RESIDENTIAL: CONSTRUCTION SEALANT MARKET, BY REGION, 2023–2028 (USD MILLION)
- TABLE 49 RESIDENTIAL: CONSTRUCTION SEALANTS MARKET, BY REGION, 2020–2022 (KILOTON)
- TABLE 50 RESIDENTIAL: CONSTRUCTION SEALANT MARKET, BY REGION, 2023–2028 (KILOTON)
- TABLE 51 NONRESIDENTIAL: CONSTRUCTION SEALANTS MARKET, BY REGION, 2020–2022 (USD MILLION)
- TABLE 52 NONRESIDENTIAL: CONSTRUCTION SEALANT MARKET, BY REGION, 2023–2028 (USD MILLION)
- TABLE 53 NONRESIDENTIAL: CONSTRUCTION SEALANTS MARKET, BY REGION, 2020–2022 (KILOTON)
- TABLE 54 NONRESIDENTIAL: CONSTRUCTION SEALANT MARKET, BY REGION, 2023–2028 (KILOTON)
- TABLE 55 COMMERCIAL & INFRASTRUCTURE: CONSTRUCTION SEALANTS MARKET, BY REGION, 2020–2022 (USD MILLION)
- TABLE 56 COMMERCIAL & INFRASTRUCTURE: CONSTRUCTION SEALANT MARKET, BY REGION, 2023–2028 (USD MILLION)
- TABLE 57 COMMERCIAL & INFRASTRUCTURE: CONSTRUCTION SEALANTS MARKET, BY REGION, 2020–2022 (KILOTON)
- TABLE 58 COMMERCIAL & INFRASTRUCTURE: CONSTRUCTION SEALANT MARKET, BY REGION, 2023–2028 (KILOTON)
- TABLE 59 CONSTRUCTION SEALANTS MARKET, BY REGION, 2020–2022 (USD MILLION)
- TABLE 60 CONSTRUCTION SEALANT MARKET, BY REGION, 2023–2028 (USD MILLION)
- TABLE 61 CONSTRUCTION SEALANTS MARKET, BY REGION, 2020–2022 (KILOTON)
- TABLE 62 CONSTRUCTION SEALANT MARKET, BY REGION, 2023–2028 (KILOTON)
- TABLE 63 ASIA PACIFIC: CONSTRUCTION SEALANTS MARKET, BY COUNTRY, 2020–2022 (USD MILLION)
- TABLE 64 ASIA PACIFIC: CONSTRUCTION SEALANT MARKET, BY COUNTRY, 2023–2028 (USD MILLION)
- TABLE 65 ASIA PACIFIC: MARKET, BY COUNTRY, 2020–2022 (KILOTON)
- TABLE 66 ASIA PACIFIC: MARKET, BY COUNTRY, 2023–2028 (KILOTON)
- TABLE 67 ASIA PACIFIC: MARKET, BY RESIN TYPE, 2020–2022 (USD MILLION)
- TABLE 68 ASIA PACIFIC: MARKET, BY RESIN TYPE, 2023–2028 (USD MILLION)
- TABLE 69 ASIA PACIFIC: MARKET, BY RESIN TYPE, 2020–2022 (KILOTON)
- TABLE 70 ASIA PACIFIC: MARKET, BY RESIN TYPE, 2023–2028 (KILOTON)
- TABLE 71 ASIA PACIFIC: MARKET, BY APPLICATION, 2020–2022 (USD MILLION)
- TABLE 72 ASIA PACIFIC: MARKET, BY APPLICATION, 2023–2028 (USD MILLION)
- TABLE 73 ASIA PACIFIC: MARKET, BY APPLICATION, 2020–2022 (KILOTON)
- TABLE 74 ASIA PACIFIC: MARKET, BY APPLICATION, 2023–2028 (KILOTON)
- TABLE 75 ASIA PACIFIC: MARKET, BY END-USE INDUSTRY, 2020–2022 (USD MILLION)
- TABLE 76 ASIA PACIFIC: MARKET, BY END-USE INDUSTRY, 2023–2028 (USD MILLION)
- TABLE 77 ASIA PACIFIC: MARKET, BY END-USE INDUSTRY, 2020–2022 (KILOTON)
- TABLE 78 ASIA PACIFIC: MARKET, BY END-USE INDUSTRY, 2023–2028 (KILOTON)
- TABLE 79 CHINA: CONSTRUCTION SEALANTS MARKET, BY APPLICATION, 2020–2022 (USD MILLION)
- TABLE 80 CHINA: CONSTRUCTION SEALANT MARKET, BY APPLICATION, 2023–2028 (USD MILLION)
- TABLE 81 CHINA: MARKET, BY APPLICATION, 2020–2022 (KILOTON)
- TABLE 82 CHINA: MARKET, BY APPLICATION, 2023–2028 (KILOTON)
- TABLE 83 JAPAN: CONSTRUCTION SEALANTS MARKET, BY APPLICATION, 2020–2022 (USD MILLION)
- TABLE 84 JAPAN: CONSTRUCTION SEALANT MARKET, BY APPLICATION, 2023–2028 (USD MILLION)
- TABLE 85 JAPAN: MARKET, BY APPLICATION, 2020–2022 (KILOTON)
- TABLE 86 JAPAN: MARKET, BY APPLICATION, 2023–2028 (KILOTON)
- TABLE 87 INDIA: CONSTRUCTION SEALANTS MARKET, BY APPLICATION, 2020–2022 (USD MILLION)
- TABLE 88 INDIA: CONSTRUCTION SEALANT MARKET, BY APPLICATION, 2023–2028 (USD MILLION)
- TABLE 89 INDIA: MARKET, BY APPLICATION, 2020–2022 (KILOTON)
- TABLE 90 INDIA: MARKET, BY APPLICATION, 2023–2028 (KILOTON)
- TABLE 91 INDONESIA: CONSTRUCTION SEALANTS MARKET, BY APPLICATION, 2020–2022 (USD MILLION)
- TABLE 92 INDONESIA: CONSTRUCTION SEALANT MARKET, BY APPLICATION, 2023–2028 (USD MILLION)
- TABLE 93 INDONESIA: MARKET, BY APPLICATION, 2020–2022 (KILOTON)
- TABLE 94 INDONESIA: MARKET, BY APPLICATION, 2023–2028 (KILOTON)
- TABLE 95 THAILAND: CONSTRUCTION SEALANTS MARKET, BY APPLICATION, 2020–2022 (USD MILLION)
- TABLE 96 THAILAND: CONSTRUCTION SEALANT MARKET, BY APPLICATION, 2023–2028 (USD MILLION)
- TABLE 97 THAILAND: MARKET, BY APPLICATION, 2020–2022 (KILOTON)
- TABLE 98 THAILAND: MARKET, BY APPLICATION, 2023–2028 (KILOTON)
- TABLE 99 MALAYSIA: CONSTRUCTION SEALANTS MARKET, BY APPLICATION, 2020–2022 (USD MILLION)
- TABLE 100 MALAYSIA: MARKET, BY APPLICATION, 2023–2028 (USD MILLION)
- TABLE 101 MALAYSIA: MARKET, BY APPLICATION, 2020–2022 (KILOTON)
- TABLE 102 MALAYSIA: MARKET, BY APPLICATION, 2023–2028 (KILOTON)
- TABLE 103 SOUTH KOREA: CONSTRUCTION SEALANTS MARKET, BY APPLICATION, 2020–2022 (USD MILLION)
- TABLE 104 SOUTH KOREA: CONSTRUCTION SEALANT MARKET, BY APPLICATION, 2023–2028 (USD MILLION)
- TABLE 105 SOUTH KOREA: MARKET, BY APPLICATION, 2020–2022 (KILOTON)
- TABLE 106 SOUTH KOREA: MARKET, BY APPLICATION, 2023–2028 (KILOTON)
- TABLE 107 REST OF ASIA PACIFIC: CONSTRUCTION SEALANTS MARKET, BY APPLICATION, 2020–2022 (USD MILLION)
- TABLE 108 REST OF ASIA PACIFIC: CONSTRUCTION SEALANT MARKET, BY APPLICATION, 2023–2028 (USD MILLION)
- TABLE 109 REST OF ASIA PACIFIC: MARKET, BY APPLICATION, 2020–2022 (KILOTON)
- TABLE 110 REST OF ASIA PACIFIC: MARKET, BY APPLICATION, 2023–2028 (KILOTON)
- TABLE 111 EUROPE: CONSTRUCTION SEALANTS MARKET, BY COUNTRY, 2020–2022 (USD MILLION)
- TABLE 112 EUROPE: CONSTRUCTION SEALANT MARKET, BY COUNTRY, 2023–2028 (USD MILLION)
- TABLE 113 EUROPE: MARKET, BY COUNTRY, 2020–2022 (KILOTON)
- TABLE 114 EUROPE: MARKET, BY COUNTRY, 2023–2028 (KILOTON)
- TABLE 115 EUROPE: MARKET, BY RESIN TYPE, 2020–2022 (USD MILLION)
- TABLE 116 EUROPE: MARKET, BY RESIN TYPE, 2023–2028 (USD MILLION)
- TABLE 117 EUROPE: MARKET, BY RESIN TYPE, 2020–2022 (KILOTON)
- TABLE 118 EUROPE: MARKET, BY RESIN TYPE, 2023–2028 (KILOTON)
- TABLE 119 EUROPE: MARKET, BY APPLICATION, 2020–2022 (USD MILLION)
- TABLE 120 EUROPE: MARKET, BY APPLICATION, 2023–2028 (USD MILLION)
- TABLE 121 EUROPE: MARKET, BY APPLICATION, 2020–2022 (KILOTON)
- TABLE 122 EUROPE: MARKET, BY APPLICATION, 2023–2028 (KILOTON)
- TABLE 123 EUROPE: MARKET, BY END-USE INDUSTRY, 2020–2022 (USD MILLION)
- TABLE 124 EUROPE: MARKET, BY END-USE INDUSTRY, 2023–2028 (USD MILLION)
- TABLE 125 EUROPE: MARKET, BY END-USE INDUSTRY, 2020–2022 (KILOTON)
- TABLE 126 EUROPE: MARKET, BY END-USE INDUSTRY, 2023–2028 (KILOTON)
- TABLE 127 GERMANY: CONSTRUCTION SEALANTS MARKET, BY APPLICATION, 2020–2022 (USD MILLION)
- TABLE 128 GERMANY: CONSTRUCTION SEALANT MARKET, BY APPLICATION, 2023–2028 (USD MILLION)
- TABLE 129 GERMANY: MARKET, BY APPLICATION, 2020–2022 (KILOTON)
- TABLE 130 GERMANY: MARKET, BY APPLICATION, 2023–2028 (KILOTON)
- TABLE 131 ITALY: CONSTRUCTION SEALANTS MARKET, BY APPLICATION, 2020–2022 (USD MILLION)
- TABLE 132 ITALY: CONSTRUCTION SEALANT MARKET, BY APPLICATION, 2023–2028 (USD MILLION)
- TABLE 133 ITALY: MARKET, BY APPLICATION, 2020–2022 (KILOTON)
- TABLE 134 ITALY: MARKET, BY APPLICATION, 2023–2028 (KILOTON)
- TABLE 135 FRANCE: CONSTRUCTION SEALANTS MARKET, BY APPLICATION, 2020–2022 (USD MILLION)
- TABLE 136 FRANCE: CONSTRUCTION SEALANT MARKET, BY APPLICATION, 2023–2028 (USD MILLION)
- TABLE 137 FRANCE: MARKET, BY APPLICATION, 2020–2022 (KILOTON)
- TABLE 138 FRANCE: MARKET, BY APPLICATION, 2023–2028 (KILOTON)
- TABLE 139 UK: CONSTRUCTION SEALANTS MARKET, BY APPLICATION, 2020–2022 (USD MILLION)
- TABLE 140 UK: CONSTRUCTION SEALANT MARKET, BY APPLICATION, 2023–2028 (USD MILLION)
- TABLE 141 UK: MARKET, BY APPLICATION, 2020–2022 (KILOTON)
- TABLE 142 UK: MARKET, BY APPLICATION, 2023–2028 (KILOTON)
- TABLE 143 TURKEY: CONSTRUCTION SEALANTS MARKET, BY APPLICATION, 2020–2022 (USD MILLION)
- TABLE 144 TURKEY: CONSTRUCTION SEALANT MARKET, BY APPLICATION, 2023–2028 (USD MILLION)
- TABLE 145 TURKEY: MARKET, BY APPLICATION, 2020–2022 (KILOTON)
- TABLE 146 TURKEY: MARKET, BY APPLICATION, 2023–2028 (KILOTON)
- TABLE 147 RUSSIA: CONSTRUCTION SEALANTS MARKET, BY APPLICATION, 2020–2022 (USD MILLION)
- TABLE 148 RUSSIA: CONSTRUCTION SEALANT MARKET, BY APPLICATION, 2023–2028 (USD MILLION)
- TABLE 149 RUSSIA: MARKET, BY APPLICATION, 2020–2022 (KILOTON)
- TABLE 150 RUSSIA: MARKET, BY APPLICATION, 2023–2028 (KILOTON)
- TABLE 151 SPAIN: CONSTRUCTION SEALANTS MARKET, BY APPLICATION, 2020–2022 (USD MILLION)
- TABLE 152 SPAIN: CONSTRUCTION SEALANT MARKET, BY APPLICATION, 2023–2028 (USD MILLION)
- TABLE 153 SPAIN: MARKET, BY APPLICATION, 2020–2022 (KILOTON)
- TABLE 154 SPAIN: MARKET, BY APPLICATION, 2023–2028 (KILOTON)
- TABLE 155 REST OF EUROPE: CONSTRUCTION SEALANTS MARKET, BY APPLICATION, 2020–2022 (USD MILLION)
- TABLE 156 REST OF EUROPE: CONSTRUCTION SEALANT MARKET, BY APPLICATION, 2023–2028 (USD MILLION)
- TABLE 157 REST OF EUROPE: MARKET, BY APPLICATION, 2020–2022 (KILOTON)
- TABLE 158 REST OF EUROPE: MARKET, BY APPLICATION, 2023–2028 (KILOTON)
- TABLE 159 NORTH AMERICA: CONSTRUCTION SEALANTS MARKET, BY COUNTRY, 2020–2022 (USD MILLION)
- TABLE 160 NORTH AMERICA: CONSTRUCTION SEALANT MARKET, BY COUNTRY, 2023–2028 (USD MILLION)
- TABLE 161 NORTH AMERICA: MARKET, BY COUNTRY, 2020–2022 (KILOTON)
- TABLE 162 NORTH AMERICA: MARKET, BY COUNTRY, 2023–2028 (KILOTON)
- TABLE 163 NORTH AMERICA: MARKET, BY RESIN TYPE, 2020–2022 (USD MILLION)
- TABLE 164 NORTH AMERICA: MARKET, BY RESIN TYPE, 2023–2028 (USD MILLION)
- TABLE 165 NORTH AMERICA: MARKET, BY RESIN TYPE, 2020–2022 (KILOTON)
- TABLE 166 NORTH AMERICA: MARKET, BY RESIN TYPE, 2023–2028 (KILOTON)
- TABLE 167 NORTH AMERICA: MARKET, BY APPLICATION, 2020–2022 (USD MILLION)
- TABLE 168 NORTH AMERICA: MARKET, BY APPLICATION, 2023–2028 (USD MILLION)
- TABLE 169 NORTH AMERICA: MARKET, BY APPLICATION, 2020–2022 (KILOTON)
- TABLE 170 NORTH AMERICA: MARKET, BY APPLICATION, 2023–2028 (KILOTON)
- TABLE 171 NORTH AMERICA: MARKET, BY END-USE INDUSTRY, 2020–2022 (USD MILLION)
- TABLE 172 NORTH AMERICA: MARKET, BY END-USE INDUSTRY, 2023–2028 (USD MILLION)
- TABLE 173 NORTH AMERICA: MARKET, BY END-USE INDUSTRY, 2020–2022 (KILOTON)
- TABLE 174 NORTH AMERICA: MARKET, BY END-USE INDUSTRY, 2023–2028 (KILOTON)
- TABLE 175 US: CONSTRUCTION SEALANTS MARKET, BY APPLICATION, 2020–2022 (USD MILLION)
- TABLE 176 US: CONSTRUCTION SEALANT MARKET, BY APPLICATION, 2023–2028 (USD MILLION)
- TABLE 177 US: MARKET, BY APPLICATION, 2020–2022 (KILOTON)
- TABLE 178 US: MARKET, BY APPLICATION, 2023–2028 (KILOTON)
- TABLE 179 CANADA: CONSTRUCTION SEALANTS MARKET, BY APPLICATION, 2020–2022 (USD MILLION)
- TABLE 180 CANADA: CONSTRUCTION SEALANT MARKET, BY APPLICATION, 2023–2028 (USD MILLION)
- TABLE 181 CANADA: MARKET, BY APPLICATION, 2020–2022 (KILOTON)
- TABLE 182 CANADA: MARKET, BY APPLICATION, 2023–2028 (KILOTON)
- TABLE 183 MEXICO: CONSTRUCTION SEALANTS MARKET, BY APPLICATION, 2020–2022 (USD MILLION)
- TABLE 184 MEXICO: CONSTRUCTION SEALANT MARKET, BY APPLICATION, 2023–2028 (USD MILLION)
- TABLE 185 MEXICO: MARKET, BY APPLICATION, 2020–2022 (KILOTON)
- TABLE 186 MEXICO: MARKET, BY APPLICATION, 2023–2028 (KILOTON)
- TABLE 187 SOUTH AMERICA: CONSTRUCTION SEALANTS MARKET, BY COUNTRY, 2020–2022 (USD MILLION)
- TABLE 188 SOUTH AMERICA: CONSTRUCTION SEALANT MARKET, BY COUNTRY, 2023–2028 (USD MILLION)
- TABLE 189 SOUTH AMERICA: MARKET, BY COUNTRY, 2020–2022 (KILOTON)
- TABLE 190 SOUTH AMERICA: MARKET, BY COUNTRY, 2023–2028 (KILOTON)
- TABLE 191 SOUTH AMERICA: MARKET, BY RESIN TYPE, 2020–2022 (USD MILLION)
- TABLE 192 SOUTH AMERICA: MARKET, BY RESIN TYPE, 2023–2028 (USD MILLION)
- TABLE 193 SOUTH AMERICA: MARKET, BY RESIN TYPE, 2020–2022 (KILOTON)
- TABLE 194 SOUTH AMERICA: MARKET, BY RESIN TYPE, 2023–2028 (KILOTON)
- TABLE 195 SOUTH AMERICA: MARKET, BY APPLICATION, 2020–2022 (USD MILLION)
- TABLE 196 SOUTH AMERICA: MARKET, BY APPLICATION, 2023–2028 (USD MILLION)
- TABLE 197 SOUTH AMERICA: MARKET, BY APPLICATION, 2020–2022 (KILOTON)
- TABLE 198 SOUTH AMERICA: MARKET, BY APPLICATION, 2023–2028 (KILOTON)
- TABLE 199 SOUTH AMERICA: MARKET, BY END-USE INDUSTRY, 2020–2022 (USD MILLION)
- TABLE 200 SOUTH AMERICA: MARKET, BY END-USE INDUSTRY, 2023–2028 (USD MILLION)
- TABLE 201 SOUTH AMERICA: MARKET, BY END-USE INDUSTRY, 2020–2022 (KILOTON)
- TABLE 202 SOUTH AMERICA: MARKET, BY END-USE INDUSTRY, 2023–2028 (KILOTON)
- TABLE 203 BRAZIL: CONSTRUCTION SEALANTS MARKET, BY APPLICATION, 2020–2022 (USD MILLION)
- TABLE 204 BRAZIL: CONSTRUCTION SEALANT MARKET, BY APPLICATION, 2023–2028 (USD MILLION)
- TABLE 205 BRAZIL: MARKET, BY APPLICATION, 2020–2022 (KILOTON)
- TABLE 206 BRAZIL: MARKET, BY APPLICATION, 2023–2028 (KILOTON)
- TABLE 207 ARGENTINA: CONSTRUCTION SEALANTS MARKET, BY APPLICATION, 2020–2022 (USD MILLION)
- TABLE 208 ARGENTINA: CONSTRUCTION SEALANT MARKET, BY APPLICATION, 2023–2028 (USD MILLION)
- TABLE 209 ARGENTINA: MARKET, BY APPLICATION, 2020–2022 (KILOTON)
- TABLE 210 ARGENTINA: MARKET, BY APPLICATION, 2023–2028 (KILOTON)
- TABLE 211 COLOMBIA: CONSTRUCTION SEALANTS MARKET, BY APPLICATION, 2020–2022 (USD MILLION)
- TABLE 212 COLOMBIA: CONSTRUCTION SEALANT MARKET, BY APPLICATION, 2023–2028 (USD MILLION)
- TABLE 213 COLOMBIA: MARKET, BY APPLICATION, 2020–2022 (KILOTON)
- TABLE 214 COLOMBIA: MARKET, BY APPLICATION, 2023–2028 (KILOTON)
- TABLE 215 REST OF SOUTH AMERICA: CONSTRUCTION SEALANTS MARKET, BY APPLICATION, 2020–2022 (USD MILLION)
- TABLE 216 REST OF SOUTH AMERICA: CONSTRUCTION SEALANT MARKET, BY APPLICATION, 2023–2028 (USD MILLION)
- TABLE 217 REST OF SOUTH AMERICA: MARKET, BY APPLICATION, 2020–2022 (KILOTON)
- TABLE 218 REST OF SOUTH AMERICA: MARKET, BY APPLICATION, 2023–2028 (KILOTON)
- TABLE 219 MIDDLE EAST & AFRICA: CONSTRUCTION SEALANTS MARKET, BY COUNTRY, 2020–2022 (USD MILLION)
- TABLE 220 MIDDLE EAST & AFRICA: CONSTRUCTION SEALANT MARKET, BY COUNTRY, 2023–2028 (USD MILLION)
- TABLE 221 MIDDLE EAST & AFRICA: MARKET, BY COUNTRY, 2020–2022 (KILOTON)
- TABLE 222 MIDDLE EAST & AFRICA: MARKET, BY COUNTRY, 2023–2028 (KILOTON)
- TABLE 223 MIDDLE EAST & AFRICA: MARKET, BY RESIN TYPE, 2020–2022 (USD MILLION)
- TABLE 224 MIDDLE EAST & AFRICA: MARKET, BY RESIN TYPE, 2023–2028 (USD MILLION)
- TABLE 225 MIDDLE EAST & AFRICA: MARKET, BY RESIN TYPE, 2020–2022 (KILOTON)
- TABLE 226 MIDDLE EAST & AFRICA: MARKET, BY RESIN TYPE, 2023–2028 (KILOTON)
- TABLE 227 MIDDLE EAST & AFRICA: MARKET, BY APPLICATION, 2020–2022 (USD MILLION)
- TABLE 228 MIDDLE EAST & AFRICA: MARKET, BY APPLICATION, 2023–2028 (USD MILLION)
- TABLE 229 MIDDLE EAST & AFRICA: MARKET, BY APPLICATION, 2020–2022 (KILOTON)
- TABLE 230 MIDDLE EAST & AFRICA: MARKET, BY APPLICATION, 2023–2028 (KILOTON)
- TABLE 231 MIDDLE EAST & AFRICA: MARKET, BY END-USE INDUSTRY, 2020–2022 (USD MILLION)
- TABLE 232 MIDDLE EAST & AFRICA: MARKET, BY END-USE INDUSTRY, 2023–2028 (USD MILLION)
- TABLE 233 MIDDLE EAST & AFRICA: MARKET, BY END-USE INDUSTRY, 2020–2022 (KILOTON)
- TABLE 234 MIDDLE EAST & AFRICA: MARKET, BY END-USE INDUSTRY, 2023–2028 (KILOTON)
- TABLE 235 SAUDI ARABIA: CONSTRUCTION SEALANTS MARKET, BY APPLICATION, 2020–2022 (USD MILLION)
- TABLE 236 SAUDI ARABIA: CONSTRUCTION SEALANT MARKET, BY APPLICATION, 2023–2028 (USD MILLION)
- TABLE 237 SAUDI ARABIA: CONSTRUCTION SEALANTS MARKET, BY APPLICATION, 2020–2022 (KILOTON)
- TABLE 238 SAUDI ARABIA: CONSTRUCTION SEALANT MARKET, BY APPLICATION, 2023–2028 (KILOTON)
- TABLE 239 UAE: CONSTRUCTION SEALANTS MARKET, BY APPLICATION, 2020–2022 (USD MILLION)
- TABLE 240 UAE: CONSTRUCTION SEALANT MARKET, BY APPLICATION, 2023–2028 (USD MILLION)
- TABLE 241 UAE: MARKET, BY APPLICATION, 2020–2022 (KILOTON)
- TABLE 242 UAE: MARKET, BY APPLICATION, 2023–2028 (KILOTON)
- TABLE 243 EGYPT: CONSTRUCTION SEALANTS MARKET, BY APPLICATION, 2020–2022 (USD MILLION)
- TABLE 244 EGYPT: CONSTRUCTION SEALANT MARKET, BY APPLICATION, 2023–2028 (USD MILLION)
- TABLE 245 EGYPT: MARKET, BY APPLICATION, 2020–2022 (KILOTON)
- TABLE 246 EGYPT: MARKET, BY APPLICATION, 2023–2028 (KILOTON)
- TABLE 247 REST OF MIDDLE EAST & AFRICA: CONSTRUCTION SEALANTS MARKET, BY APPLICATION, 2020–2022 (USD MILLION)
- TABLE 248 REST OF MIDDLE EAST & AFRICA: CONSTRUCTION SEALANT MARKET, BY APPLICATION, 2023–2028 (USD MILLION)
- TABLE 249 REST OF MIDDLE EAST & AFRICA: MARKET, BY APPLICATION, 2020–2022 (KILOTON)
- TABLE 250 REST OF MIDDLE EAST & AFRICA: MARKET, BY APPLICATION, 2023–2028 (KILOTON)
- TABLE 251 STRATEGIES ADOPTED BY KEY CONSTRUCTION SEALANT PLAYERS
- TABLE 252 DEGREE OF COMPETITION, 2022
- TABLE 253 CONSTRUCTION SEALANTS MARKET: PRODUCT LAUNCHES
- TABLE 254 CONSTRUCTION SEALANT MARKET: DEALS
- TABLE 255 3M: COMPANY OVERVIEW
- TABLE 256 ARKEMA: COMPANY OVERVIEW
- TABLE 257 ARKEMA: PRODUCT LAUNCHES
- TABLE 258 ARKEMA: DEALS
- TABLE 259 SIKA AG: COMPANY OVERVIEW
- TABLE 260 SIKA AG: DEALS
- TABLE 261 HENKEL AG: COMPANY OVERVIEW
- TABLE 262 HENKEL AG & CO. KGAA: DEALS
- TABLE 263 H.B. FULLER: COMPANY OVERVIEW
- TABLE 264 H.B. FULLER: DEALS
- TABLE 265 BASF SE: COMPANY OVERVIEW
- TABLE 266 THE DOW CHEMICAL COMPANY: COMPANY OVERVIEW
- TABLE 267 THE DOW CHEMICAL COMPANY: PRODUCT LAUNCHES
- TABLE 268 THE DOW CHEMICAL COMPANY: DEALS
- TABLE 269 WACKER CHEMIE AG: COMPANY OVERVIEW
- TABLE 270 WACKER CHEMIE AG: DEALS
- TABLE 271 GENERAL ELECTRIC COMPANY: COMPANY OVERVIEW
- TABLE 272 GENERAL ELECTRIC COMPANY: DEALS
- TABLE 273 KONISHI CO., LTD.: COMPANY OVERVIEW
- TABLE 274 MAPEI CORPORATION: COMPANY OVERVIEW
- TABLE 275 ASIAN PAINTS LIMITED: COMPANY OVERVIEW
- TABLE 276 KCC CORPORATION: COMPANY OVERVIEW
- TABLE 277 PIDILITE INDUSTRIES LIMITED: COMPANY OVERVIEW
- TABLE 278 FRANKLIN INTERNATIONAL: COMPANY OVERVIEW
- TABLE 279 HOLCIM LTD.: COMPANY OVERVIEW
- TABLE 280 SOUDAL N.V.: COMPANY OVERVIEW
- TABLE 281 SELENA FM S.A.: COMPANY OVERVIEW
- TABLE 282 HODGSON SEALANTS (HOLDINGS) LTD.: COMPANY OVERVIEW
- TABLE 283 PECORA CORPORATION: COMPANY OVERVIEW
- TABLE 284 THE EUCLID CHEMICAL COMPANY: COMPANY OVERVIEW
- TABLE 285 DEVAN SEALANTS, INC.: COMPANY OVERVIEW
- FIGURE 1 CONSTRUCTION SEALANTS MARKET SEGMENTATION
- FIGURE 2 CONSTRUCTION SEALANT MARKET: RESEARCH DESIGN
- FIGURE 3 MARKET SIZE ESTIMATION: BOTTOM-UP APPROACH
- FIGURE 4 MARKET SIZE ESTIMATION: TOP-DOWN APPROACH
- FIGURE 5 CONSTRUCTION SEALANTS: DATA TRIANGULATION
- FIGURE 6 SILICONE RESIN TYPE SEGMENT TO LEAD GLOBAL CONSTRUCTION SEALANTS MARKET BETWEEN 2023 AND 2028
- FIGURE 7 GLAZING TO BE FASTEST-GROWING APPLICATION SEGMENT BETWEEN 2023 AND 2028
- FIGURE 8 RESIDENTIAL TO BE LARGEST END-USE INDUSTRY SEGMENT DURING FORECAST PERIOD
- FIGURE 9 ASIA PACIFIC TO BE LARGEST AND FASTEST-GROWING CONSTRUCTION SEALANTS MARKET BETWEEN 2023 AND 2028
- FIGURE 10 EMERGING ECONOMIES TO OFFER LUCRATIVE GROWTH OPPORTUNITIES FOR MARKET PLAYERS BETWEEN 2023 AND 2028
- FIGURE 11 SILICONE CONSTRUCTION SEALANTS TO LEAD MARKET BETWEEN 2023 AND 2028
- FIGURE 12 MARKET FOR CONSTRUCTION SEALANTS TO GROW AT HIGHER CAGRS IN EMERGING COUNTRIES BETWEEN 2023 AND 2028
- FIGURE 13 CHINA AND GLAZING SEGMENT ACCOUNTED FOR LARGEST MARKET SHARES IN 2022
- FIGURE 14 GLAZING APPLICATION SEGMENT TO GROW AT HIGHEST CAGR DURING FORECAST PERIOD
- FIGURE 15 RESIDENTIAL SEGMENT TO LEAD MARKET DURING FORECAST PERIOD
- FIGURE 16 INDIA TO REGISTER HIGHEST CAGR IN GLOBAL CONSTRUCTION SEALANTS MARKET BETWEEN 2023 AND 2028
- FIGURE 17 DRIVERS, RESTRAINTS, OPPORTUNITIES, AND CHALLENGES OF GLOBAL CONSTRUCTION SEALANTS MARKET
- FIGURE 18 CONSTRUCTION SEALANTS MARKET: PORTER’S FIVE FORCES
- FIGURE 19 GLOBAL SPENDING IN CONSTRUCTION INDUSTRY, 2014–2035
- FIGURE 20 SILICONE RESIN TYPE TO LEAD MARKET BETWEEN 2023 AND 2028
- FIGURE 21 GLAZING APPLICATION TO LEAD MARKET BETWEEN 2023 AND 2028
- FIGURE 22 RESIDENTIAL SEGMENT TO DOMINATE MARKET DURING FORECAST PERIOD
- FIGURE 23 ASIA PACIFIC TO LEAD MARKET DURING FORECAST PERIOD
- FIGURE 24 ASIA PACIFIC: MARKET SNAPSHOT
- FIGURE 25 EUROPE: MARKET SNAPSHOT
- FIGURE 26 NORTH AMERICA: MARKET SNAPSHOT
- FIGURE 27 COLOMBIA TO RECORD FASTEST GROWTH BETWEEN 2023 AND 2028
- FIGURE 28 SAUDI ARABIA TO LEAD MARKET BETWEEN 2023 AND 2028
- FIGURE 29 COMPANY EVALUATION MATRIX, 2022
- FIGURE 30 PRODUCT PORTFOLIO ANALYSIS OF TOP PLAYERS
- FIGURE 31 MARKET SHARE, BY KEY PLAYER, 2022
- FIGURE 32 3M: COMPANY SNAPSHOT
- FIGURE 33 ARKEMA S.A.: COMPANY SNAPSHOT
- FIGURE 34 SIKA AG: COMPANY SNAPSHOT
- FIGURE 35 HENKEL AG & CO. KGAA: COMPANY SNAPSHOT
- FIGURE 36 H.B. FULLER: COMPANY SNAPSHOT
- FIGURE 37 BASF SE: COMPANY SNAPSHOT
- FIGURE 38 THE DOW CHEMICAL COMPANY: COMPANY SNAPSHOT
- FIGURE 39 WACKER CHEMIE AG: COMPANY SNAPSHOT
- FIGURE 40 GENERAL ELECTRIC COMPANY: COMPANY SNAPSHOT
- FIGURE 41 KONISHI CO., LTD.: COMPANY SNAPSHOT
This research study involves the use of extensive secondary sources, directories, and databases, such as Hoovers, Bloomberg L.P., Factiva, ICIS, and OneSource, to identify and collect information useful for this technical, market-oriented, and commercial study of the global construction sealants market. Primary sources are mainly industry experts from core and related industries, preferred suppliers, manufacturers, distributors, service providers, and organizations related to all segments of the value chain of this industry. In-depth interviews were conducted with various primary respondents, including key industry participants, subject matter experts (SMEs), C-level executives of key market players, and industry consultants, among other experts, to obtain and verify critical qualitative and quantitative information as well as assess the growth prospects of the market.
Secondary Research
In the secondary research process, various secondary sources were referred to for identifying and collecting information for this study. These secondary sources include annual reports, press releases & investor presentations of companies, white papers, regulatory bodies, trade directories, certified publications, articles from recognized authors, gold and silver standard websites, and databases.
Secondary research has been used to obtain key information about the value chain of the industry, the total pool of key players, market classification & segmentation according to industry trends to the bottom-most level and regional markets. It has also been used to obtain information about key developments from a market-oriented perspective.
Primary Research
In the primary research process, various sources from both the supply and demand sides were interviewed to obtain and verify qualitative and quantitative information for this report as well as analyze prospects. Primary sources from the supply side include industry experts such as CEOs, vice presidents, marketing directors, technology and innovation directors, and related executives from various leading companies and organizations operating in the construction sealants market. Primary sources from the demand side include experts and key persons from the application segment. Extensive primary research has been conducted after understanding and analyzing the current scenario of the construction sealants market through secondary research. Several primary interviews were conducted with market experts from both the demand and supply sides across five major regions: North America, Europe, Asia Pacific, Middle East & Africa, and South America.
Following is the breakdown of primary respondents:
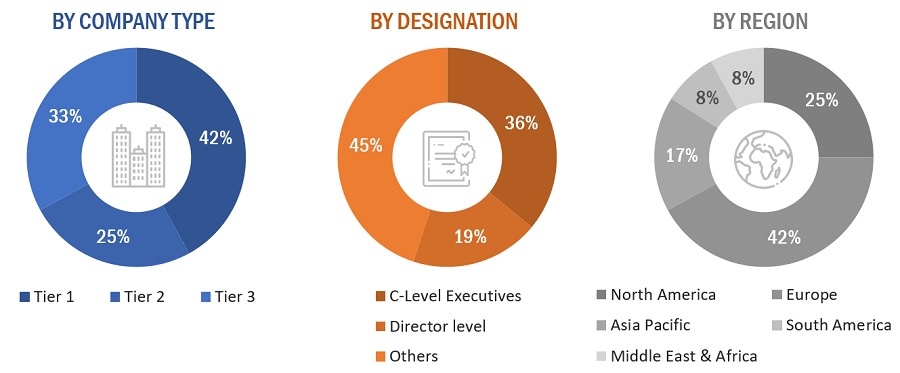
To know about the assumptions considered for the study, download the pdf brochure
Market Size Estimation
The top-down and bottom-up approaches have been used to estimate and validate the construction sealants market size and other dependent submarkets. The leading players in the market have been identified through secondary research, and their market shares in the key regions have been determined through primary and secondary research. This entire procedure included the study of the annual and financial reports of the top players and extensive interviews with industry experts, such as chief executive officers, vice presidents, directors, and marketing executives, for key insights.
All percentage shares, splits, and breakdowns were determined using secondary sources and verified through primary sources. All possible parameters affecting the markets covered in this study were accounted for, viewed in detail, verified through primary research, and analyzed to get the final quantitative and qualitative data. This data has been consolidated and supplemented with detailed inputs and analysis from MarketsandMarkets and presented in this report. The three figures below represent the overall market size estimation process throughout the study.
Global Construction Sealants Market Size: Bottom-up Approach
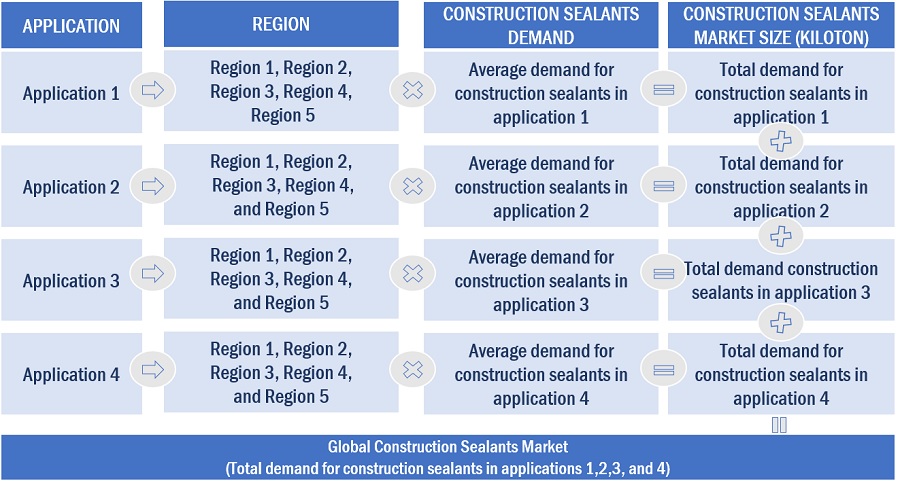
To know about the assumptions considered for the study, Request for Free Sample Report
Global Construction Sealants Market Size: Top-down Approach
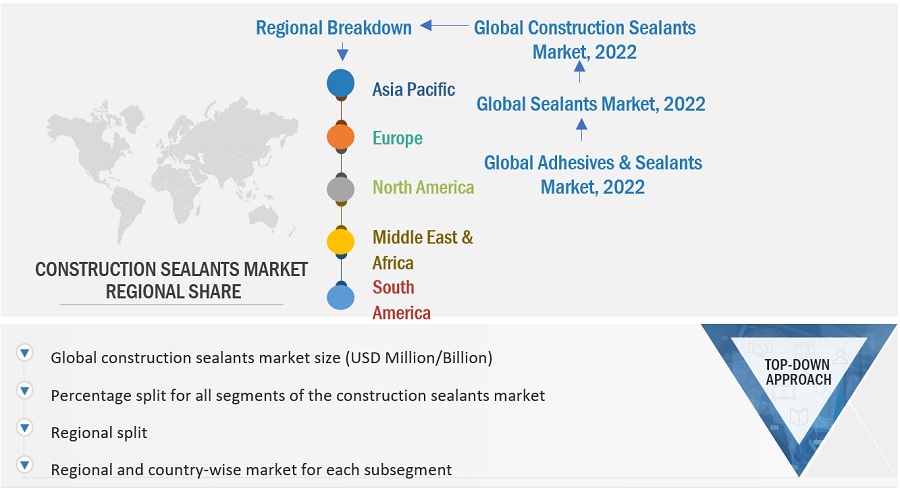
Data Triangulation
After arriving at the overall market size from the estimation process explained above, the total market has been split into several segments and subsegments. Data triangulation and market breakdown procedures have been used wherever applicable to complete the overall market engineering process and arrive at the exact statistics for all segments and subsegments. The data has been triangulated by studying various factors and trends from both the demand and supply sides. The market has been validated using both the top-down and bottom-up approaches.
Market Definition.
Sealants are thick, high-viscosity materials, providing tightness and long-term flexibility, and are typically used to seal gaps and block the passage of air, chemicals, and water in the substrates. They are largely used in the construction industry for filling gaps between substrates in various applications, such as flooring, roofing, glazing, sanitary applications, expansion joints, and others. Different types of construction sealants are used according to the performance requirements. Sealants are highly elastic and resilient, weather durable, non-sagging, and watertight, with excellent adhesion to most of the building & construction materials.
Key Stakeholders
- Raw material suppliers
- Construction sealants manufacturers
- Manufacturing technology providers
- Industry associations
- Traders, distributors, and suppliers of construction sealants
- Non-governmental organizations (NGOs), government and regional agencies, and research organizations
Report Objectives
-
To analyze and forecast the market size of global construction sealants in terms of volume
and value - To provide detailed information regarding the major factors (drivers, restraints, opportunities, and industry-specific challenges) influencing the market growth
- To define, describe, and forecast the global construction sealants market on the basis of resin type, application, and region
- To analyze and forecast the market on the basis of five major regions – Asia Pacific, Europe, North America, South America, and the Middle East & Africa (MEA)
- To analyze the market opportunities for stakeholders and present a competitive landscape for the market leaders
- To strategically profile the key market players and comprehensively analyze their core competencies1
Note: 1. The core competencies of the companies are determined in terms of their key developments and strategies adopted to sustain their position in the market.
Available Customizations
MarketsandMarkets offers customizations according to the specific needs of the companies with the given market data.
The following customization options are available for the report:
Product Analysis
- Product matrix, which gives a detailed comparison of the product portfolio of each company
Regional Analysis
- Further breakdown of the construction sealants market by country
Company Information
- Detailed analysis and profiling of additional market players (up to five)


Growth opportunities and latent adjacency in Construction Sealants Market