Construction & Demolition Waste Market by type (Sand, Soil & Gravel, Concrete, Bricks & Masonry, Wood, Metal), Source (Residential, Commercial, Industrial, Municipal), & Region (APAC, North America, Europe, MEA, & South America) - Global forecast to 2026
The global construction & demolition waste market size is estimated to USD 34.4 billion by 2026, at a CAGR of 5.3% during the forecast period. The global market is primarily driven by many ongoing and upcoming building & construction as well as demolition projects in developing countries.
The material produced during the following processes is referred to as construction & demolition waste : building construction, renovation of existing structures, partial building deconstruction, and complete building demolition. While the mechanism of generation is frequently very different and the materials themselves are subject to very varied conditions during the use-phase, construction and demolition wastes have similarities in that they are both made up of materials that were intended for purposes that are similar. Given that its elements have not yet been joined together to form complicated assemblies or structures and are thus easier to identify and separate, construction waste may be thought of as being more readily regulated and separable than demolition waste.

To know about the assumptions considered for the study, Request for Free Sample Report
COVID-19 Impact on the Construction & demolition waste Market
The global Construction & demolition waste market includes major Tier I and II suppliers like Waste Management (US). SUEZ ( France), Veolia (France), Republic Services (US), Clean Harbors Inc. (US). The production facilities of these suppliers are distributed across Asia Pacific, Europe, North America, and the rest of the world. COVID-19 has also had an influence on their business. As the building and construction sector is adversely affected by the covid-19 epidemic, the global construction and demolition waste market saw a dip in growth rate in 2020-2021. The pandemic has impacted building projects material, labor, and major cost components. Several building and demolition projects in several nations under lockdown were halted as a result of the epidemic.
Construction & Demolition Waste Market Dynamics:
Driver: Sustainable waste management and predicted waste generation
With the generation of millions of tons of construction and demolition arises the quest to dispose it. Due to the demand and requirement of construction & demolition waste being disposed of responsibly, sustainable waste management and recovery activities are being encouraged. This practice is being looked at a medium to responsibly collect, transport, treat, manage, and dispose of waste responsibly. This acts as a driver for the service, solutions, and product providers to be actively responsive and innovative in covering the potentially new and existing construction & demolition waste management market.
The residential, municipal, commercial, and industrial sectors have been producing construction & demolition waste ranging between some million tons every year. Construction activities in these sectors are increasing. Hence, the rise in construction activities and generation of construction & demolition waste is bound to follow a directly proportional relationship. This is because it encourages already existing large and medium players in the market to expand and innovate. It also provides a possibility for small players exploring new domains and facilitates the entry of new players into the market.
Restraint: Weak rules and regulations and illegal dumping of construction & demolition waste
Waste management and recovery are challenging to manage and recover in a sustainable way due to illegal dumping and resource hoarding. To eliminate unlawful and incorrect trash disposal, governments should establish strict laws and regulations. Due to data shortages and poor data management methods, it is hard to assess the full magnitude of illegal dumping in Australia, for example. Based on an estimate, Australia spent more than USD 70 million in 2016-17 to monitor and manage illegal dumping activities. The proximity principle states that waste generators must convey their trash to a facility within a certain radius of their location of origin. This procedure is not well-executed, and as a result, not all garbage reaches the disposal facilities.
Opportunity: Growing adoption of construction and demolition waste materials in urban areas
Construction and demolition waste is generated during construction, renovation, and demolition of buildings, roads, and bridges. The Environmental Protection Agency (EPA) of the US promotes a Sustainable Materials Management (SMM) approach, which identifies certain construction & demolition materials as commodities that can be used in new building projects, avoiding the need to mine and process virgin materials. Most construction and demolition waste currently generated in the US is lawfully destined for disposal in landfills regulated under the Code of Federal Regulations (CFR).
Smart cities are developed in urban areas to create sustainable economic development. According to the United Nations, by 2030, 60% of the worlds population will live in cities, and one in three individuals will live in a city with a population of half a million or more. Currently, more than 100 smart city projects are in progress across the world, which offers huge opportunities for the construction sector. The need for buildings roads offers lucrative opportunities for the waste management market players.
An increase in construction activities creates a substantial amount of construction-related waste that is removed from the waste stream through a process called diversion. Diverted materials are sorted for subsequent recycling, and in some cases, they are reused. In recent years, awareness regarding the disposal and reuse of construction material has resulted in a reduction in volumes of construction and demolition waste disposed of in landfills. Many opportunities exist for the significant reduction and recovery of materials that would otherwise be destined for disposal as waste.
Challenges: Hindrance in workflow due to inefficiency of municipal bodies and local authorities
Under the 2016 guidelines in India, local and municipal authorities play the most important role in planning and enacting construction & demolition waste management in their jurisdiction. Even if the collecting, transportation, and processing are leased out to a private business, the local government is ultimately responsible for the management scheme's overall success. Local governments/municipal entities tend to be the weakest link in the chain, slowing down the adoption of initiatives.
- Cities lack optimum facilities, capacities, and trained personnel, which hinder in facilitating the initiatives.
- Shortage of financial resources to hire consultants leads to a hindrance in the initial feasibility study and/or a DPR.
- The management of construction & demolition waste is of less importance for the public as it is more concerned about municipal solid waste (MSW). This perception prevails because state-level agencies lack coordination and because the importance of construction & demolition waste management is less talked about.
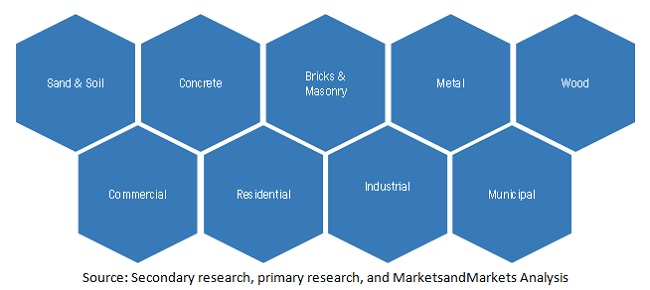
Ecosystem Analysis: Construction & Demolition Waste Market
To know about the assumptions considered for the study, download the pdf brochure
The soil, sand & gravel segment lead the construction & demolition waste market
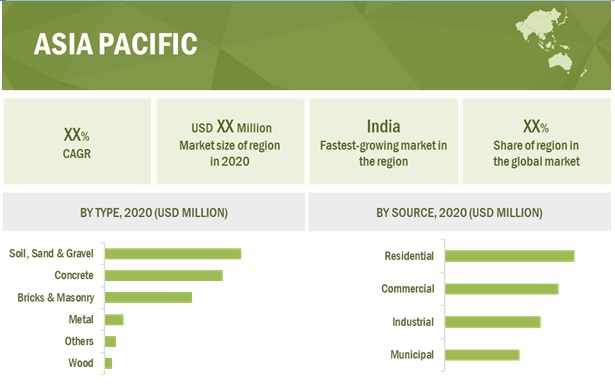
Soil, sand & gravel, by type, accounted for the largest share of the construction & demolition waste market in 2020. The soil, sand & gravel segment accounted for a share of 35.9% of the overall market in 2020, in terms of value. The market for this segment is driven by the increasing usage of recycled sand in construction projects globally.
APAC is the largest market for Construction & demolition waste in 2020
APAC accounted for the largest share of the Construction & demolition waste market in 2020. The growth of the APAC market is mainly attributed to the high economic growth rate, followed by heavy investments in the building & construction industry. Countries such as Japan and China are expected to post steady growth in the construction & demolition waste market due to growing infrastructure development projects. In addition to this, the growing population in these countries further increases construction & demolition waste from residential and commercial sources.
Construction & Demolition Waste Market Key Market Players
Construction & demolition waste is a diversified and competitive market with a large number of global players and few regional and local players. Waste Management (US). SUEZ ( France), Veolia (France), Axens (France), Republic Services (US), Clean Harbors Inc. (US). These are some of the key players in the market.
Scope of the Construction & Demolition Waste Market report:
|
Report Metric |
Details |
|
Market Size Available for Years |
2019-2026 |
|
Base Year Considered |
2020 |
|
Forecast Period |
2021-2026 |
|
Forecast Units |
Value (USD million) and Volume (Million Tons) |
|
Segments Covered |
Type, Source, and Region |
|
Geographies Covered |
North America, Asia Pacific, Europe, Middle East, |
|
Companies Covered |
Some of the leading players operating in the Construction & demolition waste market include Waste Management (US). SUEZ ( France), Veolia (France), Axens (France), Republic Services (US), Clean Harbors Inc. (US). |
This research report categorizes the Construction & demolition waste market based on type, application, and region.
Construction & demolition waste Market, By Type
- Soil, Sand & Gravel
- Concrete
- Bricks & Masonry
- Wood
- Metal
- Others
Construction & demolition waste Market, By Source
- Residential
- Commercial
- Industrial
- Municipal
Construction & demolition waste Market, By Region
- Asia Pacific
- North America
- Europe
- Middle East
- South America
Recent Developments
- In January 2021 SUEZ expanded its hazardous waste treatment and recovery capacities in Europe. The group focuses on the industrials sector, guaranteeing safety and regulatory compliance through solutions favoring the circular economy.
- In October 2020, Management completed the acquisition of Advanced Disposal. This acquisition helped Waste Management to expand its footprint and allowed Waste Management to deliver unrivaled access to differentiated, sustainable waste management and recycling services to approximately 3 million new commercial, industrial, and residential customers, primarily located in 16 states in the eastern half of the US.
Frequently Asked Questions (FAQ):
Does this report cover volume tables in addition to the value tables?
Yes, volume tables are provided for type segment except offering.
Which countries are considered in the European region?
The report includes the following European countries
- Germany
- U.K.
- Italy
- France
- Spain
- Russia
- Rest of Europe
What is the COVID-19 impact on the Construction & demolition waste market?
Industry experts believe that COVID-19 would have a moderate impact on Construction & demolition waste market. There seems to be decrease in the construction & demolition projects across the world, during COVID-19. .
To speak to our analyst for a discussion on the above findings, click Speak to Analyst

TABLE OF CONTENTS
1 INTRODUCTION (Page No. - 20)
1.1 OBJECTIVES OF THE STUDY
1.2 MARKET DEFINITION
1.2.1 INCLUSIONS & EXCLUSIONS
1.3 MARKET SCOPE
1.3.1 REGIONS COVERED
1.3.2 YEARS CONSIDERED FOR THE STUDY
1.4 CURRENCY
1.5 UNIT CONSIDERED
1.6 LIMITATIONS
1.7 STAKEHOLDERS
2 RESEARCH METHODOLOGY (Page No. - 24)
2.1 RESEARCH DATA
2.1.1 SECONDARY DATA
2.1.1.1 Critical secondary inputs
2.1.1.2 Key data from secondary sources
2.1.2 PRIMARY DATA
2.1.2.1 Critical primary inputs
2.1.2.2 Key data from primary sources
2.1.2.3 Key industry insights
2.1.2.4 Breakdown of primary interviews
2.2 BASE NUMBER CALCULATION
2.2.1 ESTIMATION OF CONSTRUCTION & DEMOLITION WASTE MARKET SIZE BASED ON MARKET SHARE ANALYSIS
2.3 MARKET SIZE ESTIMATION
2.4 DATA TRIANGULATION
2.4.1 RESEARCH ASSUMPTIONS AND LIMITATION
2.4.2 LIMITATIONS
2.4.3 GROWTH RATE ASSUMPTIONS
2.4.4 FACTOR ANALYSIS
3 EXECUTIVE SUMMARY (Page No. - 35)
4 PREMIUM INSIGHTS (Page No. - 38)
4.1 ATTRACTIVE OPPORTUNITIES IN CONSTRUCTION & DEMOLITION WASTE MARKET
4.2 MARKET, BY REGION
4.3 APAC: CONSTRUCTION & DEMOLITION WASTE MARKET, BY COUNTRY AND END-USE INDUSTRY
4.4 MARKET: BY MAJOR COUNTRIES
5 MARKET OVERVIEW (Page No. - 41)
5.1 INTRODUCTION
5.2 COVID-19 ECONOMIC ASSESSMENT
5.3 MARKET DYNAMICS
5.3.1 DRIVERS
5.3.1.1 Policies related to construction and demolition waste
5.3.1.2 Sustainable waste management and predicted waste generation
5.3.1.3 Rapid growth of construction industry in emerging economies of APAC, MEA, and South America
5.3.2 RESTRAINTS
5.3.2.1 Weak rules and regulations and illegal dumping of construction & demolition waste
5.3.3 OPPORTUNITIES
5.3.3.1 Innovation in sorting and recycling technologies for efficient treatment of construction & demolition waste
5.3.3.2 Growing adoption of construction and demolition waste materials in urban areas
5.3.3.3 Green building system promoting reuse and recycling of concrete elements and aggregates
5.3.4 CHALLENGES
5.3.4.1 Problems arising due to construction dust
5.3.4.2 Hindrance in workflow due to inefficiency of municipal bodies and local authorities
6 INDUSTRY TRENDS (Page No. - 46)
6.1 PORTERS FIVE FORCES ANALYSIS
6.1.1 BARGAINING POWER OF SUPPLIERS
6.1.2 THREAT OF NEW ENTRANTS
6.1.3 THREAT OF SUBSTITUTES
6.1.4 BARGAINING POWER OF BUYERS
6.1.5 INTENSITY OF COMPETITIVE RIVALRY
6.2 SUPPLY CHAIN ANALYSIS
6.2.1 COLLECTION
6.2.2 STORAGE AND TRANSPORTATION
6.2.3 SEGREGATION
6.2.4 PROCESSING
6.2.5 DISPOSAL OF GENERATED WASTE
6.2.6 IMPACT OF COVID-19 ON END-USE INDUSTRIES OF CONSTRUCTION & DEMOLITION WASTE
6.3 YC & YCC SHIFT
6.3.1 REVENUE SHIFT FOR CONSTRUCTION & DEMOLITION WASTE PLAYERS
6.4 TRADE ANALYSIS
6.5 ECOSYSTEM
6.6 PRICING ANALYSIS
6.7 TECHNOLOGY ANALYSIS
6.7.1 SOFTWARE FOR WASTE MANAGEMENT COMPANIES
6.7.2 ROBOT RECYCLERS
6.7.3 INTERNET OF THINGS (IOT)
6.7.4 NEW NORDTRACK CRUSHER AND MOBILE SCREEN LAUNCHED BY METSO OUTOTEC
6.7.5 BOX D
6.8 CASE STUDY ANALYSIS
6.8.1 COMPARISON BETWEEN VARIOUS CONSTRUCTION & DEMOLITION WASTE MANAGEMENT METHODS
6.8.1.1 Objective
6.8.1.2 Problem statement
6.8.1.3 Solution statement
6.9 REGULATORY ANALYSIS
6.10 PATENT ANALYSIS
6.10.1 INTRODUCTION
6.10.2 METHODOLOGY
6.10.3 DOCUMENT TYPE
6.10.4 PATENT PUBLICATION TRENDS
6.10.5 INSIGHTS
6.10.6 JURISDICTION ANALYSIS
6.10.7 TOP COMPANIES/APPLICANTS
7 IMPACT OF COVID-19 ON CONSTRUCTION & DEMOLITION WASTE MARKET, SCENARIO ANALYSIS, BY REGION (Page No. - 63)
7.1 SCENARIO ANALYSIS
7.2 RANGE SCENARIOS OF CONSTRUCTION & DEMOLITION WASTE MARKET
7.2.1 OPTIMISTIC SCENARIO
7.2.2 PESSIMISTIC SCENARIO
7.2.3 REALISTIC SCENARIO
8 CONSTRUCTION & DEMOLITION WASTE MARKET, BY TYPE (Page No. - 65)
8.1 INTRODUCTION
8.2 SOIL, SAND & GRAVEL
8.2.1 REUSE OF SOIL, SAND & GRAVEL OBTAINED FROM CONSTRUCTION & DEMOLITION WASTE TO DRIVE THE MARKET
8.3 CONCRETE
8.3.1 HIGH PROPORTION IN CONSTRUCTION & DEMOLITION WASTE MAKES IT A PREFERRED TYPE TO BE REUSED, RECYCLED, AND DISPOSED
8.4 BRICKS & MASONRY
8.4.1 RECYCLED AGGREGATE OBTAINED FROM MASONRY WASTE ENHANCING SUSTAINABILITY
8.5 METALS
8.5.1 HIGH DURABILITY & RECYCLABILITY OF METAL WASTE TO PROPEL THE MARKET
8.6 WOOD
8.6.1 HIGH DEMAND FOR WOOD FROM HARDWOOD AND SOFTWOOD FLOORING INDUSTRIES
8.7 OTHERS
9 CONSTRUCTION & DEMOLITION WASTE MARKET, BY SOURCE (Page No. - 74)
9.1 INTRODUCTION
9.2 RESIDENTIAL
9.2.1 RAPID URBANIZATION AND INCREASED CONSTRUCTION SPENDING TO DRIVE THE MARKET
9.3 COMMERCIAL
9.3.1 RISING SUSTAINABLE BUILDINGS TO PROPEL THE DEMAND
9.4 MUNICIPAL
9.4.1 SURGING REQUIREMENT TO MANAGE MUNICIPAL WASTE TO BOOST THE MARKET
9.5 INDUSTRIAL
9.5.1 GROWTH OF MANUFACTURING INDUSTRY TO DRIVE THE MARKET
10 CONSTRUCTION & DEMOLITION WASTE MARKET, BY REGION (Page No. - 81)
10.1 INTRODUCTION
10.2 APAC
10.2.1 CHINA
10.2.1.1 China to dominate the market during the forecast period
10.2.2 JAPAN
10.2.2.1 Growing emphasis on waste recycling to accelerate market growth
10.2.3 INDIA
10.2.3.1 Growing construction industry and rapid industrialization are driving the market
10.2.4 SOUTH KOREA
10.2.4.1 Growing residential and commercial construction projects to support the market
10.2.5 AUSTRALIA
10.2.5.1 Strong spending in building & construction activities likely to drive the market
10.2.6 REST OF APAC
10.3 NORTH AMERICA
10.3.1 US
10.3.1.1 Presence of established construction & demolition waste market players
10.3.2 CANADA
10.3.2.1 Significant growth of construction industry and stringent government regulations to drive the market
10.3.3 MEXICO
10.3.3.1 Government focusing on sustainable management of construction & demolition waste
10.4 EUROPE
10.4.1 GERMANY
10.4.1.1 Increasing usage of recycled construction & demolition waste materials to drive the market
10.4.2 FRANCE
10.4.2.1 Presence of established service providers for construction & demolition waste to boost the market
10.4.3 UK
10.4.3.1 Development in residential & commercial construction industry to propel the market
10.4.4 ITALY
10.4.4.1 Rapid urbanization & infrastructural development to drive the demand
10.4.5 SPAIN
10.4.5.1 Increasing residential projects to drive growth of the construction & demolition waste market
10.4.6 RUSSIA
10.4.6.1 Country to witness moderate growth
10.4.7 REST OF EUROPE
10.5 MIDDLE EAST & AFRICA
10.5.1 SAUDI ARABIA
10.5.1.1 Mega housing projects in the country to drive the market
10.5.2 UAE
10.5.2.1 Continuous efforts to recycle construction & demolition waste to drive the market
10.5.3 SOUTH AFRICA
10.5.3.1 Growing building & construction industry to drive the market
10.5.4 REST OF MIDDLE EAST & AFRICA
11 COMPETITIVE LANDSCAPE (Page No. - 130)
11.1 OVERVIEW
11.1.1 OVERVIEW OF STRATEGIES ADOPTED BY KEY CONSTRUCTION & DEMOLITION WASTES PLAYERS
11.2 MARKET RANKING
11.3 REVENUE ANALYSIS OF TOP MARKET PLAYERS
11.4 MARKET SHARE ANALYSIS
11.5 COMPETITIVE LEADERSHIP MAPPING
11.5.1 STAR
11.5.2 EMERGING LEADERS
11.5.3 PERVASIVE
11.5.4 PARTICIPANT
11.5.5 COMPETITIVE BENCHMARKING
11.6 COMPETITIVE LEADERSHIP MAPPING OF SMES (SMALL AND MEDIUM-SIZED ENTERPRISES)
11.6.1 PROGRESSIVE COMPANIES
11.6.2 RESPONSIVE COMPANIES
11.6.3 STARTING BLOCKS
11.6.4 DYNAMIC COMPANIES
11.7 MARKET EVALUATION FRAMEWORK
11.8 COMPETITIVE SCENARIO
12 COMPANY PROFILE (Page No. - 148)
12.1 MAJOR PLAYERS
12.1.1 WASTE MANAGEMENT
12.1.1.1 Business overview
12.1.1.2 Products/solutions/services offered
12.1.1.3 Recent developments: Deals
12.1.1.4 MnM view
12.1.1.4.1 Key strengths/right to win
12.1.1.4.2 Strategic choices made
12.1.1.4.3 Weaknesses and competitive threats
12.1.2 SUEZ
12.1.2.1 Business overview
12.1.2.2 Products & services offered
12.1.2.3 Recent developments
12.1.2.4 MnM view
12.1.2.4.1 Key strengths/right to win
12.1.2.4.2 Strategic choices made
12.1.2.4.3 Weaknesses and competitive threats
12.1.3 VEOLIA
12.1.3.1 Business overview
12.1.3.2 Products/solutions/services offered
12.1.3.3 Recent developments: Deals
12.1.3.4 MnM view
12.1.3.4.1 Key strengths/right to win
12.1.3.4.2 Strategic choices made
12.1.3.4.3 Weaknesses and competitive threats
12.1.4 REPUBLIC SERVICES
12.1.4.1 Business overview
12.1.4.2 Products/solutions/services offered
12.1.4.3 Recent developments: Deals
12.1.4.4 MnM view
12.1.4.4.1 Key strengths/right to win
12.1.4.4.2 Strategic choices made
12.1.4.4.3 Weaknesses and competitive threats
12.1.5 CLEAN HARBORS, INC.
12.1.5.1 Business overview
12.1.5.2 Products/solutions/services offered
12.1.5.3 Recent developments: Deals
12.1.5.4 MnM view
12.1.5.4.1 Key strengths/right to win
12.1.5.4.2 Strategic choices made
12.1.5.4.3 Weaknesses and competitive threats
12.1.6 FCC ENVIRONMENT
12.1.6.1 Business overview
12.1.6.2 Products/solutions/services offered
12.1.6.3 MnM view
12.1.6.3.1 Key strengths/right to win
12.1.7 BIFFA
12.1.7.1 Business overview
12.1.7.2 Products/solutions/services offered
12.1.7.3 Recent developments: Deals
12.1.7.4 MnM view
12.1.7.4.1 Key strengths/right to win
12.1.8 RENEWI
12.1.8.1 Business overview
12.1.8.2 Products/solutions/services offered
12.1.8.3 MnM view
12.1.8.3.1 Key strengths/right to win
12.1.9 RUBICON
12.1.9.1 Business overview
12.1.9.2 Products/solutions/services offered
12.1.9.3 Recent developments: Deals
12.1.9.4 MnM view
12.1.9.4.1 Key strengths/right to win
12.1.10 CASELLA WASTE SYSTEMS
12.1.10.1 Business overview
12.1.10.2 Products/solutions/services offered
12.1.10.3 Recent developments: Deals
12.1.10.4 Recent developments: Others
12.1.10.5 MnM view
12.1.10.5.1 Key strengths/right to win
12.2 OTHER PLAYERS
12.2.1 ECO WISE
12.2.2 CDE GLOBAL LTD.
12.2.3 NSWAI
12.2.4 SAAHAS ZERO WASTE
12.2.5 RAMKY ENVIRO ENGINEERS LTD.
12.2.6 INFRASTRUCTURE LEASING & FINANCIAL SERVICES LIMITED
12.2.7 DUROMECH
12.2.8 WESTART INDIA
12.2.9 SHANGHAI ZINTH MINERAL CO., LTD.
12.2.10 GFL ENVIRONMENTAL
12.2.11 METSO OUTOTEC
12.2.12 CLEANAWAY WASTE MANAGEMENT LIMITED
12.2.13 REMONDIS SE & CO. KG
12.2.14 BINGO INDUSTRIES
12.2.15 JJS WASTE & RECYCLING
12.2.16 FORTUM
13 APPENDIX (Page No. - 195)
13.1 DISCUSSION GUIDE
13.2 KNOWLEDGE STORE: MARKETSANDMARKETS SUBSCRIPTION PORTAL
13.3 AVAILABLE CUSTOMIZATIONS
13.4 RELATED REPORTS
13.5 AUTHOR DETAILS
LIST OF TABLES (164 TABLES)
TABLE 1 MARKET: PORTERS FIVE FORCE ANALYSIS
TABLE 2 MARKET: VALUE CHAIN
TABLE 3 PEBBLES, GRAVEL, CRUSHED STONE FOR CONCRETE AGGREGATES FOR ROAD OR RAILWAY BALLAST, SHINGLE OR FLINT, MACADAM OR SLAG, DROSS, TARRED GRANULES, CHIPPINGS, POWDER OF STONES TRADE DATA 2020 (KILOTON)
TABLE 4 LIST OF PATENTS
TABLE 5 MARKET SIZE, BY TYPE, 20192026 (USD MILLION)
TABLE 6 MARKET SIZE, BY TYPE, 20192026 (KILOTON)
TABLE 7 SAND, SOIL & GRAVEL: MARKET SIZE, BY REGION, 20192026 (USD MILLION)
TABLE 8 SAND, SOIL & GRAVEL: MARKET SIZE, BY REGION, 20192026 (KILOTON)
TABLE 9 CONCRETE: MARKET SIZE, BY REGION, 20192026 (USD MILLION)
TABLE 10 CONCRETE: MARKET SIZE, BY REGION, 20192026 (KILOTON)
TABLE 11 BRICKS & MASONRY: MARKET SIZE, BY REGION, 20192026 (USD MILLION)
TABLE 12 BRICKS & MASONRY: MARKET SIZE, BY REGION, 20192026 (KILOTON)
TABLE 13 METALS: MARKET SIZE, BY REGION, 20192026 (USD MILLION)
TABLE 14 METALS: MARKET SIZE, BY REGION, 20192026 (KILOTON)
TABLE 15 WOOD: MARKET SIZE, BY REGION, 20192026 (USD MILLION)
TABLE 16 WOOD: MARKET SIZE, BY REGION, 20192026 (KILOTON)
TABLE 17 OTHERS: MARKET SIZE, BY REGION, 20192026 (USD MILLION)
TABLE 18 OTHERS: MARKET SIZE, BY REGION, 20192026 (KILOTON)
TABLE 19 MARKET SIZE, BY SOURCE, 20192026 (USD MILLION)
TABLE 20 MARKET SIZE, BY SOURCE, 20192026 (MILLION TON)
TABLE 21 RESIDENTIAL: MARKET SIZE, BY REGION, 20192026 (USD MILLION)
TABLE 22 RESIDENTIAL: MARKET SIZE, BY REGION, 20192026 (MILLION TON)
TABLE 23 COMMERCIAL: MARKET SIZE, BY REGION, 20192026 (USD MILLION)
TABLE 24 COMMERCIAL: MARKET SIZE, BY REGION, 20192026 (MILLION TON)
TABLE 25 MUNICIPAL: MARKET SIZE, BY REGION, 20192026 (USD MILLION)
TABLE 26 MUNICIPAL: MARKET SIZE, BY REGION, 20192026 (MILLION TON)
TABLE 27 INDUSTRIAL: MARKET SIZE, BY REGION, 20192026 (USD MILLION)
TABLE 28 INDUSTRIAL: MARKET SIZE, BY REGION, 20192026 (MILLION TON)
TABLE 29 MARKET SIZE, BY REGION, 20192026 (USD MILLION)
TABLE 30 MARKET SIZE, BY REGION, 20192026 (MILLION TON)
TABLE 31 APAC: MARKET SIZE, BY COUNTRY, 20192026 (USD MILLION)
TABLE 32 APAC: MARKET SIZE, BY COUNTRY, 20192026 (MILLION TON)
TABLE 33 APAC: MARKET SIZE, BY TYPE, 20192026 (USD MILLION)
TABLE 34 APAC: MARKET SIZE, BY TYPE, 20192026 (MILLION TON)
TABLE 35 APAC: MARKET SIZE, BY SOURCE, 20192026 (USD MILLION)
TABLE 36 APAC: MARKET SIZE, BY SOURCE, 20192026 (MILLION TON)
TABLE 37 CHINA: MARKET SIZE, BY TYPE, 20192026 (USD MILLION)
TABLE 38 CHINA: MARKET SIZE, BY TYPE, 20192026 (MILLION TON)
TABLE 39 CHINA: MARKET SIZE, BY SOURCE, 20192026 (USD MILLION)
TABLE 40 CHINA: MARKET SIZE, BY SOURCE, 20192026 (MILLION TON)
TABLE 41 JAPAN: MARKET SIZE, BY TYPE, 20192026 (USD MILLION)
TABLE 42 JAPAN: MARKET SIZE, BY TYPE, 20192026 (MILLION TON)
TABLE 43 JAPAN: MARKET SIZE, BY SOURCE, 20192026 (USD MILLION)
TABLE 44 JAPAN: MARKET SIZE, BY SOURCE, 20192026 (MILLION TON)
TABLE 45 INDIA: CONSTRUCTION & DEMOLITION WASTE MARKET SIZE, BY TYPE, 20192026 (USD MILLION)
TABLE 46 INDIA: MARKET SIZE, BY TYPE, 20192026 (MILLION TON)
TABLE 47 INDIA: MARKET SIZE, BY SOURCE, 20192026 (USD MILLION)
TABLE 48 INDIA: MARKET SIZE, BY SOURCE, 20192026 (MILLION TON)
TABLE 49 SOUTH KOREA: CONSTRUCTION & DEMOLITION WASTE MARKET SIZE, BY TYPE, 20192026 (USD MILLION)
TABLE 50 SOUTH KOREA: MARKET SIZE, BY TYPE, 20192026 (MILLION TON)
TABLE 51 SOUTH KOREA: MARKET SIZE, BY SOURCE, 20192026 (USD MILLION)
TABLE 52 SOUTH KOREA: MARKET SIZE, BY SOURCE, 20192026 (MILLION TON)
TABLE 53 AUSTRALIA: CONSTRUCTION & DEMOLITION WASTE MARKET SIZE, BY TYPE, 20192026 (USD MILLION)
TABLE 54 AUSTRALIA: MARKET SIZE, BY TYPE, 20192026 (MILLION TON)
TABLE 55 AUSTRALIA: MARKET SIZE, BY SOURCE 20192026 (USD MILLION)
TABLE 56 AUSTRALIA: MARKET SIZE, BY SOURCE, 20192026 (MILLION TON)
TABLE 57 REST OF APAC: CONSTRUCTION & DEMOLITION WASTE MARKET SIZE, BY TYPE, 20192026 (USD MILLION)
TABLE 58 REST OF APAC: MARKET SIZE, BY TYPE, 20192026 (MILLION TON)
TABLE 59 REST OF APAC: MARKET SIZE, BY SOURCE, 20192026 (USD MILLION)
TABLE 60 REST OF APAC: MARKET SIZE, BY SOURCE, 20192026 (MILLION TON)
TABLE 61 NORTH AMERICA: CONSTRUCTION & DEMOLITION WASTE MARKET SIZE, BY COUNTRY, 20192026 (USD MILLION)
TABLE 62 NORTH AMERICA: MARKET SIZE, BY COUNTRY, 20192026 (MILLION TON)
TABLE 63 NORTH AMERICA: MARKET SIZE, BY TYPE, 20192026 (USD MILLION)
TABLE 64 NORTH AMERICA: MARKET SIZE, BY TYPE, 20192026 (MILLION TON)
TABLE 65 NORTH AMERICA: MARKET SIZE, BY SOURCE, 20192026 (USD MILLION)
TABLE 66 NORTH AMERICA: MARKET SIZE, BY SOURCE, 20192026 (MILLION TON)
TABLE 67 US: CONSTRUCTION & DEMOLITION WASTE MARKET SIZE, BY TYPE, 20192026 (USD MILLION)
TABLE 68 US: MARKET SIZE, BY TYPE, 20192026 (MILLION TON)
TABLE 69 US: MARKET SIZE, BY SOURCE, 20192026 (USD MILLION)
TABLE 70 US: MARKET SIZE, BY SOURCE, 20192026 (MILLION TON)
TABLE 71 CANADA: CONSTRUCTION & DEMOLITION WASTE MARKET SIZE, BY TYPE, 20192026 (USD MILLION)
TABLE 72 CANADA: MARKET SIZE, BY TYPE, 20192026 (MILLION TON)
TABLE 73 CANADA: MARKET SIZE, BY SOURCE, 20192026 (USD MILLION)
TABLE 74 CANADA: MARKET SIZE, BY SOURCE, 20192026 (MILLION TON)
TABLE 75 MEXICO: CONSTRUCTION & DEMOLITION WASTE MARKET SIZE, BY TYPE, 20192026 (USD MILLION)
TABLE 76 MEXICO: MARKET SIZE, BY TYPE, 20192026 (MILLION TON)
TABLE 77 MEXICO: MARKET SIZE, BY SOURCE, 20192026 (USD MILLION)
TABLE 78 MEXICO: MARKET SIZE, BY SOURCE, 20192026 (MILLION TON)
TABLE 79 EUROPE: CONSTRUCTION & DEMOLITION WASTE MARKET SIZE, BY COUNTRY, 20192026 (USD MILLION)
TABLE 80 EUROPE: MARKET SIZE, BY COUNTRY, 20192026 (MILLION TON)
TABLE 81 EUROPE: MARKET SIZE, BY TYPE, 20192026 (USD MILLION)
TABLE 82 EUROPE: MARKET SIZE, BY TYPE, 20192026 (MILLION TON)
TABLE 83 EUROPE: MARKET SIZE, BY SOURCE, 20192026 (USD MILLION)
TABLE 84 EUROPE: MARKET SIZE, BY SOURCE, 20192026 (MILLION TON)
TABLE 85 GERMANY: CONSTRUCTION & DEMOLITION WASTE MARKET SIZE, BY TYPE, 20192026 (USD MILLION)
TABLE 86 GERMANY: MARKET SIZE, BY TYPE, 20192026 (MILLION TON)
TABLE 87 GERMANY: MARKET SIZE, BY SOURCE, 20192026 (USD MILLION)
TABLE 88 GERMANY: MARKET SIZE, BY SOURCE, 20192026 (MILLION TON)
TABLE 89 FRANCE: CONSTRUCTION & DEMOLITION WASTE MARKET SIZE, BY TYPE, 20192026 (USD MILLION)
TABLE 90 FRANCE: MARKET SIZE, BY TYPE, 20192026 (MILLION TON)
TABLE 91 FRANCE: MARKET SIZE, BY SOURCE, 20192026 (USD MILLION)
TABLE 92 FRANCE: MARKET SIZE, BY SOURCE, 20192026 (MILLION TON)
TABLE 93 UK: CONSTRUCTION & DEMOLITION WASTE MARKET SIZE, BY TYPE, 20192026 (USD MILLION)
TABLE 94 UK: MARKET SIZE, BY TYPE, 20192026 (MILLION TON)
TABLE 95 UK MARKET SIZE, BY SOURCE, 20192026 (USD MILLION)
TABLE 96 UK: MARKET SIZE, BY SOURCE, 20192026 (MILLION TON)
TABLE 97 ITALY: CONSTRUCTION & DEMOLITION WASTE MARKET SIZE, BY TYPE, 20192026 (USD MILLION)
TABLE 98 ITALY: MARKET SIZE, BY TYPE, 20192026 (MILLION TON)
TABLE 99 ITALY: MARKET SIZE, BY SOURCE, 20192026 (USD MILLION)
TABLE 100 ITALY: MARKET SIZE, BY SOURCE, 20192026 (MILLION TON)
TABLE 101 SPAIN: CONSTRUCTION & DEMOLITION WASTE MARKET SIZE, BY TYPE, 20192026 (USD MILLION)
TABLE 102 SPAIN: MARKET SIZE, BY TYPE, 20192026 (MILLION TON)
TABLE 103 SPAIN: MARKET SIZE, BY SOURCE, 20192026 (USD MILLION)
TABLE 104 SPAIN: MARKET SIZE, BY SOURCE, 20192026 (MILLION TON)
TABLE 105 RUSSIA: CONSTRUCTION & DEMOLITION WASTE MARKET SIZE, BY TYPE, 20192026 (USD MILLION)
TABLE 106 RUSSIA: MARKET SIZE, BY TYPE, 20192026 (MILLION TON)
TABLE 107 RUSSIA: MARKET SIZE, BY SOURCE, 20192026 (USD MILLION)
TABLE 108 RUSSIA: MARKET SIZE, BY SOURCE, 20192026 (MILLION TON)
TABLE 109 REST OF EUROPE: CONSTRUCTION & DEMOLITION WASTE MARKET SIZE, BY TYPE, 20192026 (USD MILLION)
TABLE 110 REST OF EUROPE: MARKET SIZE, BY TYPE, 20192026 (MILLION TON)
TABLE 111 REST OF EUROPE: MARKET SIZE, BY SOURCE, 20192026 (USD MILLION)
TABLE 112 REST OF EUROPE: MARKET SIZE, BY SOURCE, 20192026 (MILLION TON)
TABLE 113 MIDDLE EAST & AFRICA: CONSTRUCTION & DEMOLITION WASTE MARKET SIZE, BY COUNTRY, 20192026 (USD MILLION)
TABLE 114 MIDDLE EAST & AFRICA: MARKET SIZE, BY COUNTRY, 20192026 (MILLION TON)
TABLE 115 MIDDLE EAST & AFRICA: MARKET SIZE, BY TYPE, 20192026 (USD MILLION)
TABLE 116 MIDDLE EAST & AFRICA: MARKET SIZE, BY TYPE, 20192026 (MILLION TON)
TABLE 117 MIDDLE EAST & AFRICA: MARKET SIZE, BY SOURCE, 20192026 (USD MILLION)
TABLE 118 MIDDLE EAST & AFRICA: MARKET SIZE, BY SOURCE, 20192026 (MILLION TON)
TABLE 119 SAUDI ARABIA: CONSTRUCTION & DEMOLITION WASTE MARKET SIZE, BY TYPE, 20192026 (USD MILLION)
TABLE 120 SAUDI ARABIA: MARKET SIZE, BY TYPE, 20192026 (MILLION TON)
TABLE 121 SAUDI ARABIA: MARKET SIZE, BY SOURCE, 20192026 (USD MILLION)
TABLE 122 SAUDI ARABIA: MARKET SIZE, BY SOURCE, 20192026 (MILLION TON )
TABLE 123 UAE: CONSTRUCTION & DEMOLITION WASTE MARKET SIZE, BY TYPE, 20192026 (USD MILLION)
TABLE 124 UAE: MARKET SIZE, BY TYPE, 20192026 (MILLION TON)
TABLE 125 UAE: MARKET SIZE, BY SOURCE, 20192026 (USD MILLION)
TABLE 126 UAE: MARKET SIZE, BY SOURCE, 20192026 (MILLION TON)
TABLE 127 SOUTH AFRICA: CONSTRUCTION & DEMOLITION WASTE MARKET SIZE, BY TYPE, 20192026 (USD MILLION)
TABLE 128 SOUTH AFRICA: MARKET SIZE, BY TYPE, 20192026 (MILLION TON)
TABLE 129 SOUTH AFRICA: MARKET SIZE, BY END-USE INDUSTRY, 20192026 (USD MILLION)
TABLE 130 SOUTH AFRICA: MARKET SIZE, BY SOURCE, 20192026 (MILLION TON)
TABLE 131 REST OF MIDDLE EAST & AFRICA: CONSTRUCTION & DEMOLITION WASTE MARKET SIZE, BY TYPE, 20192026 (USD MILLION)
TABLE 132 REST OF MIDDLE EAST & AFRICA: MARKET SIZE, BY TYPE, 20192026 (MILLION TON)
TABLE 133 REST OF MIDDLE EAST & AFRICA: MARKET SIZE, BY SOURCE, 20192026 (USD MILLION)
TABLE 134 REST OF MIDDLE EAST & AFRICA: MARKET SIZE, BY SOURCE, 20192026 (MILLION TON)
TABLE 135 CONSTRUCTION & DEMOLITION WASTE MARKET: MARKET SHARES OF KEY PLAYERS
TABLE 136 COMPANY TYPE FOOTPRINT
TABLE 137 COMPANY SOURCE FOOTPRINT
TABLE 138 COMPANY REGION FOOTPRINT
TABLE 139 MARKET EVALUATION FRAMEWORK
TABLE 140 CONSTRUCTION & DEMOLITION WASTE MARKET: DEALS, 2017-2021
TABLE 141 MARKET: OTHERS, 20172021
TABLE 142 WASTE MANAGEMENT: BUSINESS OVERVIEW
TABLE 143 WASTE MANAGEMENT: PRODUCTS OFFERED
TABLE 144 SUEZ: BUSINESS OVERVIEW
TABLE 145 SUEZ: PRODUCTS/SOLUTIONS/SERVICES OFFERED
TABLE 146 SUEZ: DEALS
TABLE 147 VEOLIA: BUSINESS OVERVIEW
TABLE 148 VEOLIA: SERVICES OFFERED
TABLE 149 REPUBLIC SERVICES: BUSINESS OVERVIEW
TABLE 150 REPUBLIC SERVICES: SERVICES OFFERED
TABLE 151 CLEAN HARBORS, INC.: BUSINESS OVERVIEW
TABLE 152 CLEAN HARBORS, INC.: SERVICES OFFERED
TABLE 153 FCC ENVIRONMENT: BUSINESS OVERVIEW
TABLE 154 FCC ENVIRONMENT: SOLUTIONS OFFERED
TABLE 155 BIFFA: BUSINESS OVERVIEW
TABLE 156 BIFFA: SERVICES OFFERED
TABLE 157 RENEWI: BUSINESS OVERVIEW
TABLE 158 RENEWI: SOLUTIONS OFFERED
TABLE 159 RUBICON: BUSINESS OVERVIEW
TABLE 160 RUBICON: SERVICES OFFERED
TABLE 161 CASELLA WASTE SYSTEMS: BUSINESS OVERVIEW
TABLE 162 CASELLA WASTE SYSTEMS: PRODUCTS OFFERED
TABLE 163 SHANGHAI ZINTH MINERAL CO., LTD.: COMPANY OVERVIEW
TABLE 164 CLEANAWAY WASTE MANAGEMENT LIMITED: COMPANY OVERVIEW
LIST OF FIGURES (46 FIGURES)
FIGURE 1 CONSTRUCTION & DEMOLITION WASTE MARKET SEGMENTATION
FIGURE 2 MARKET: RESEARCH DESIGN
FIGURE 3 MARKET SIZE ESTIMATION: SUPPLY-SIDE ANALYSIS
FIGURE 4 MARKET SIZE ESTIMATION: DEMAND-SIDE ANALYSIS
FIGURE 5 MARKET SIZE ESTIMATION METHODOLOGY: BOTTOM-UP APPROACH
FIGURE 6 MARKET SIZE ESTIMATION METHODOLOGY: TOP-DOWN APPROACH
FIGURE 7 CONSTRUCTION & DEMOLITION WASTE MARKET: DATA TRIANGULATION
FIGURE 8 SOIL, SAND & GRAVEL SEGMENT LED THE OVERALL MARKET IN 2020
FIGURE 9 RESIDENTIAL SOURCE LED OVERALL CONSTRUCTION & DEMOLITION WASTE MARKET IN 2020
FIGURE 10 APAC WAS THE LARGEST MARKET IN 2020
FIGURE 11 GROWING CONSTRUCTION & DEMOLITION WASTE FROM RESIDENTIAL SEGMENT TO DRIVE THE MARKET
FIGURE 12 APAC TO BE THE LARGEST MARKET BETWEEN 2021 AND 2026
FIGURE 13 CHINA ACCOUNTED FOR THE LARGEST SHARE OF THE MARKET IN APAC
FIGURE 14 INDIA TO BE FASTEST-GROWING MARKET BETWEEN 2021 AND 2026
FIGURE 15 REVISED GDP FORECASTS FOR SELECT G20 COUNTRIES IN 2020
FIGURE 16 DRIVERS, RESTRAINTS, OPPORTUNITIES, AND CHALLENGES IN THE CONSTRUCTION & DEMOLITION WASTE MARKET
FIGURE 17 PORTERS FIVE FORCES ANALYSIS
FIGURE 18 SUPPLY CHAIN OF CONSTRUCTION & DEMOLITION WASTE INDUSTRY
FIGURE 19 REVENUE SHIFT & NEW REVENUE POCKETS FOR CONSTRUCTION & DEMOLITION WASTE PLAYERS
FIGURE 20 AVERAGE SELLING PRICE (2020-2026)
FIGURE 21 NUMBER OF PATENTS REGISTERED IN LAST 11 YEARS
FIGURE 22 NUMBER OF PATENTS YEAR-WISE IN LAST 11 YEARS
FIGURE 23 CHINA ACCOUNTED FOR THE MOST NUMBER OF PATENTS
FIGURE 24 TOP 10 COMPANIES/APPLICANTS WITH HIGHEST NUMBER OF PATENTS
FIGURE 25 SOIL, SAND & GRAVEL SEGMENT TO LEAD CONSTRUCTION & DEMOLITION WASTE MARKET DURING THE FORECAST PERIOD
FIGURE 26 RESIDENTIAL SEGMENT TO DOMINATE THE MARKET DURING THE FORECAST PERIOD
FIGURE 27 APAC TO RECORD FASTEST GROWTH DURING THE FORECAST PERIOD
FIGURE 28 APAC: MARKET SNAPSHOT
FIGURE 29 NORTH AMERICA: MARKET SNAPSHOT
FIGURE 30 EUROPE: MARKET SNAPSHOT
FIGURE 31 MARKET RANKING OF KEY PLAYERS, 2020
FIGURE 32 REVENUE ANALYSIS FOR KEY PLAYERS IN CONSTRUCTION & DEMOLITION WASTE MARKET
FIGURE 33 MARKET: MARKET SHARE ANALYSIS, 2020
FIGURE 34 MARKET: COMPETITIVE LEADERSHIP MAPPING, 2020
FIGURE 35 STRENGTH OF PRODUCT PORTFOLIO
FIGURE 36 BUSINESS STRATEGY EXCELLENCE
FIGURE 37 COMPETITIVE LEADERSHIP MAPPING OF SMES (SMALL AND MEDIUM-SIZED ENTERPRISES), 2020
FIGURE 38 WASTE MANAGEMENT: COMPANY SNAPSHOT
FIGURE 39 SUEZ: COMPANY SNAPSHOT
FIGURE 40 VEOLIA: COMPANY SNAPSHOT
FIGURE 41 REPUBLIC SERVICES: COMPANY SNAPSHOT
FIGURE 42 CLEAN HARBORS, INC.: COMPANY SNAPSHOT
FIGURE 43 FCC ENVIRONMENT: COMPANY SNAPSHOT
FIGURE 44 BIFFA: COMPANY SNAPSHOT
FIGURE 45 RENEWI: COMPANY SNAPSHOT
FIGURE 46 CASELLA WASTE SYSTEMS: COMPANY SNAPSHOT
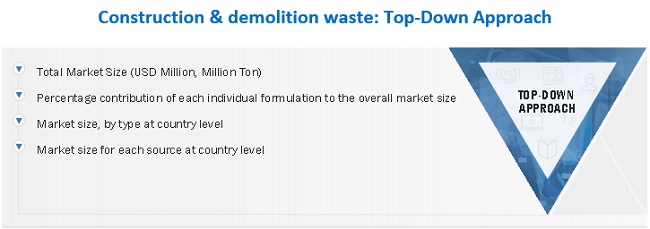
The study involved four major activities in estimating the size of the Construction & demolition waste Market. Exhaustive secondary research has been carried out to collect information on the market, the peer markets, and the parent market. Both top-down and bottom-up approaches have been employed to estimate the total market size. Market breakdown and data triangulation methods have also been used to estimate the market for segments and subsegments.
Secondary Research
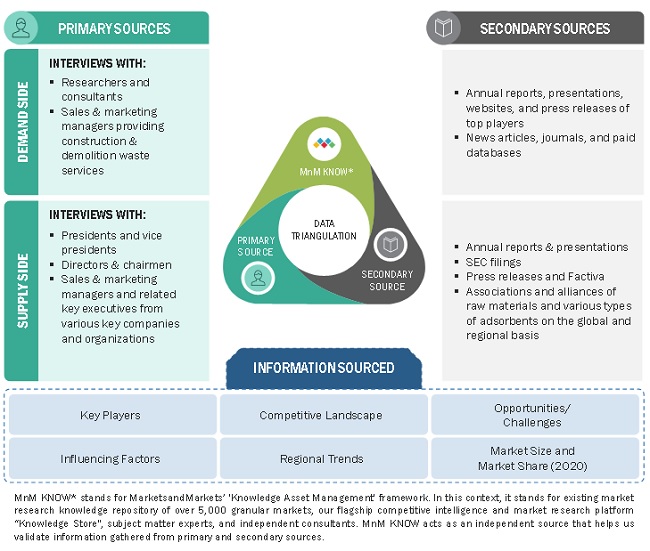
In the secondary research process, various sources such as Hoovers, Bloomberg Businessweek, Factiva, World Bank, and Industry Journals were used. These secondary sources included annual reports, press releases & investor presentations of companies; white papers; certified publications; articles by recognized authors; and databases.
Primary Research
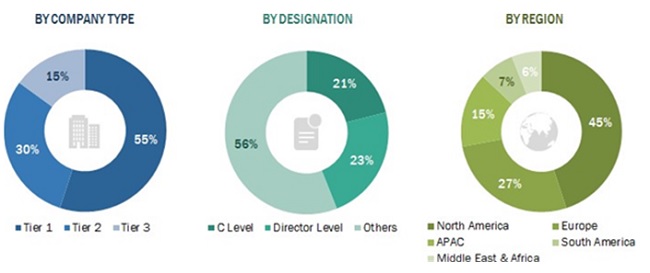
The Construction & demolition waste market comprises several stakeholders, such as service providers, recyclers, contractors, and regulatory organizations in the supply chain. Developments in the Construction & demolition waste market characterize the demand side. Market consolidation activities undertaken by service providers characterize the supply side. Various primary sources from both the supply and demand sides of the market were interviewed to obtain qualitative and quantitative information. Following is the breakdown of primary respondents:
To know about the assumptions considered for the study, download the pdf brochure
Market Size Estimation
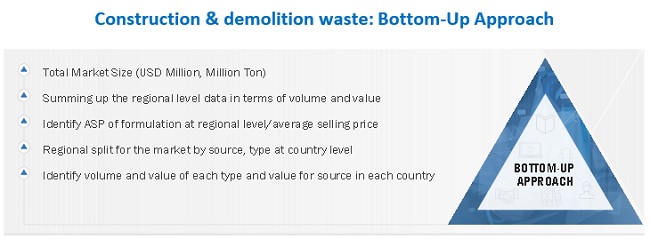
Both top-down and bottom-up approaches were used to estimate and validate the total size of the Construction & demolition waste market. These methods were also used extensively to determine the size of various subsegments in the market. The research methodology used to estimate the market size includes the following:
The key players in the industry and markets were identified through extensive secondary research.
The industrys supply chain and market size, in terms of value, were determined through primary and secondary research processes.
All percentage shares, splits, and breakdowns were determined using secondary sources and verified through primary sources.
To know about the assumptions considered for the study, Request for Free Sample Report
Data Triangulation
After arriving at the overall market sizeusing the market size estimation processes as explained above the market was split into several segments and subsegments. To complete the overall market engineering process and arrive at the exact statistics of each market segment and subsegment, the data triangulation, and market breakdown procedures were employed, wherever applicable. The data was triangulated by studying various factors and trends from both the demand and supply sides in the Construction & demolition waste market.
Report Objectives
- To define, describe, and forecast the Construction & demolition waste market in terms of value and volume
- To provide detailed information about the key factors influencing the market growth, such as drivers, restraints, opportunities, and challenges
- To analyze and forecast the market size based on type, and sources
- To forecast the market size of five main regions, namely, North America, Europe, Asia Pacific (APAC), South America and Middle East and Africa (MEA) (along with the key countries in each region)
- To strategically analyze the micromarkets1 with respect to individual growth trends, growth prospects, and contribution to the overall market
- To analyze the opportunities in the market for stakeholders and draw a competitive landscape for market leaders
- To analyze the competitive developments, such as new product launch, expansion, mergers & acquisitions, and partnership & collaboration in the Construction & demolition waste market
- To strategically profile the key players and comprehensively analyze their core competencies.
Available Customizations:
- With the given market data, MarketsandMarkets offers customizations according to the specific needs of the companies.
- The following customization options are available for the report:
Product Analysis
- Product matrix, which gives a detailed comparison of the product portfolio of each company
Regional Analysis
- Further breakdown of a region with respect to a particular country
Company Information
- Detailed analysis and profiling of additional market players (up to five)


 Generating Response ...


Growth opportunities and latent adjacency in Construction & Demolition Waste Market