Composable Applications Market by Offering (Platform And Services), Vertical (BFSI, Retail & eCommerce, Government, Healthcare & Life Sciences, Manufacturing, IT & ITeS, Energy & Utilities), & Region (North America, Europe, APAC, RoW) – Global Forecast to 2028
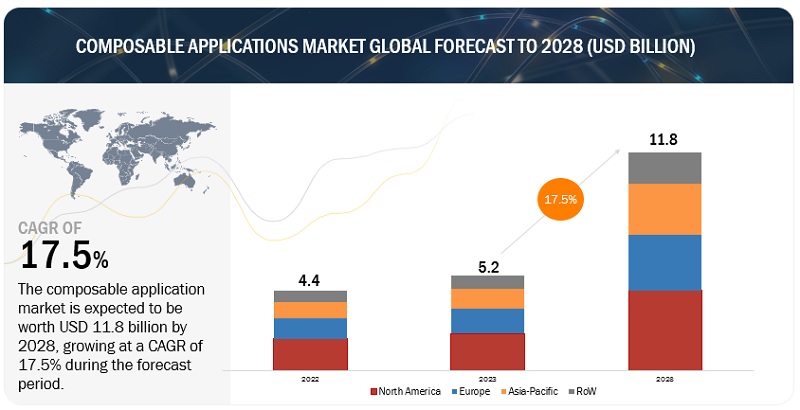
[187 Pages Report] MarketsandMarkets forecasts the composable applications market size to grow from an estimated USD 5.2 billion in 2023 to USD 11.8 billion by 2028 at a CAGR of 17.5%. Factors driving the market growth include the increasing need for rapid customization and scalability. However, the lack of skilled professionals or trainers among developers is expected to hinder the market growth.
To know about the assumptions considered for the study, Request for Free Sample Report
To know about the assumptions considered for the study, download the pdf brochure
Composable Applications Market Dynamics
Driver: Increased demand for app development
Between 2019 and 2020, the number of applications rose by more than 20%. This rate of increase was more than twice that of any previous year. As per findings, around 35% of new applications will be composable and built using Packaged Business Capabilities (PBCs). To outperform their rivals, more than 75% of small-to-medium-sized SaaS companies are expected to employ bundled business capability architecture. Contemporary firms are expected to abandon monoliths and embrace the transformable composition.
Enterprises are increasingly challenged to create digital user experiences beyond web and mobile app digital experiences. Developers can use composable applications to create new apps from existing code or apps. The need to install and manage several workload-specific configurations is eliminated while using composable applications; this can be seen in the retail & eCommerce industry. Composable commerce enables eCommerce teams to choose, construct, and compose best-of-breed solutions to meet their company demands. Composable commerce uses cutting-edge technologies and methodologies such as MACH (Microservices, API, Cloud, and Headless) to adapt to the ever-changing market dynamics rather than adopting a one-size-fits-all eCommerce capability. All these advantages denote that composable applications will be in demand for app development.
Restraint: Dependency on vendor-supplied customized solutions
In today’s digital world, application delivery is the priority, as the speed in developing and delivering applications has become essential for business success. A vendor-supplied software is a fully integrated solution that helps meet specific business requirements. The customer-vendor side solution increases cost and takes more time to deliver custom software. Customized solutions are not, at times, a perfect match to the business requirements. Enterprises are not entirely aware of the advantages of in-house software development, which is a major factor for organizational dependency over vendor-supplied software solutions, restraining the growth of the composable application development platform market.
Opportunity: Growing digital transformation in IT industry
The focus of organizations on increasing their productivity is one of the major driving factors for the adoption of digital transformation. The use of advanced technologies, such as the cloud, Internet of Things (IoT), big data and analytics, mobility, and social media, has led to innovation and transformation, thereby eliciting positive growth in the business ecosystem. Digital technologies have transformed the legacy approach to businesses into a modern approach. For example, online services are now firmly established in the banking and financial sector, resulting in the proliferation of online activities and websites. Organizations are trying to improve their business outcomes by moving toward digital transformation. This has led to an increase in demand for digital transformation solutions in various industries and is expected to drive the adoption of composable application platforms and services.
Challenge: Lack of skilled professional trainers among developers
COVID-19 compelled many businesses to enter the digital age, which required specialized software and someone in charge of developing it. As a result, IT teams grew in size and specialized. Because of the rapid increase in demand, supply was unable to keep up. There are fewer people with development skills than there are jobs, and this disparity will only grow. The rapid evolution of composable applications has piqued the interest of businesses in hiring developers who are experts in these fields. Many companies must invest in the training of their developers to learn these technologies, which few want to do because the field has a high turnover rate. The funds they put into forming a developer may generate revenue for the competition.
Composable Applications Market Ecosystem
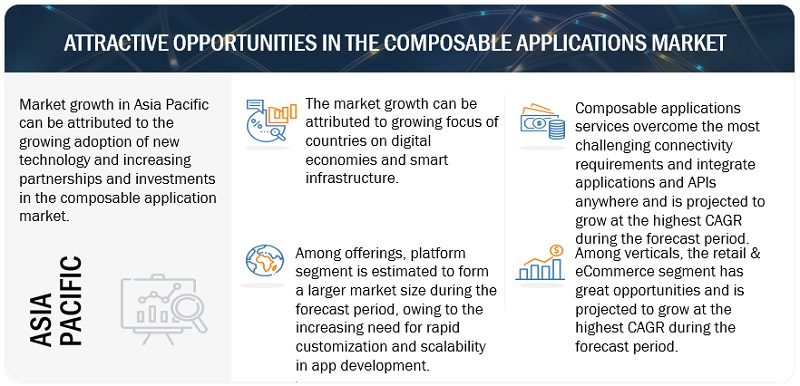
By offering, services to grow at the highest CAGR during the forecast period
It includes various services in the composable applications market. Services play crucial in the implementation and deployment of composable applications in an enterprise. Professional services are considered a core component of services as they support day-to-day business operations. The services include integration & implementation, consulting & training, and support & maintenance. Companies offering these services have skilled consultants and solution architects who are specialized professionals that support the proper designing and delivery of composable applications architecture.
By vertical, retail & eCommerce to grow at the highest CAGR during the forecast period
Automating and digitizing business operations is one of the top priorities of retail organizations in today’s competitive retail ecosystem. Due to the COVID-19 pandemic, many retailers have had to adapt their sales models to meet changing customer demands and safety requirements. One of the new sales models is Buy Online, Pick-Up in Store (BOPIS). To meet this growing demand, retailers focus on automating end-to-end supply chain processes. Investing in a unified application integration can certainly bring numerous benefits for retailers.
Moreover, according to a Shopify survey, 42% of companies want to provide their consumers with tailored product suggestions using tools like quizzes, unique mobile applications, and first- or third-party behavioral data. For example, to make buying cereal enjoyable, the plant-based cereal company Off-Limits designed a vending machine-like buying process that brought customers to a gamified checkout. Similarly, customers may virtually try on shoes with the Allbird smartphone app utilizing augmented reality. In such cases, composable commerce benefits the industry.
By region, Asia Pacific is expected to grow at the highest CAGR during the forecast period.
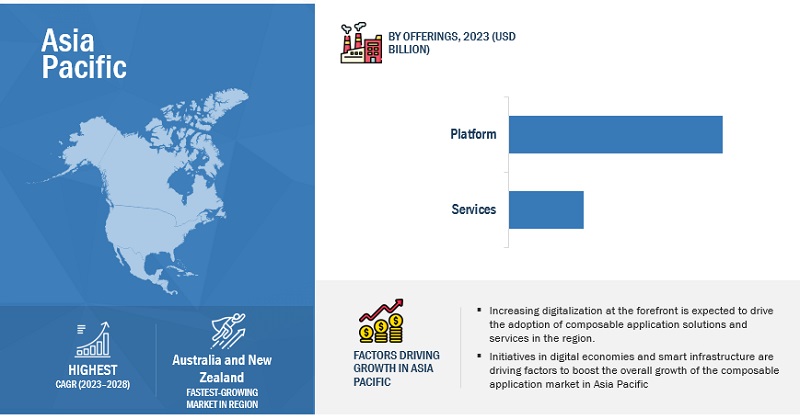
>Asia Pacific has witnessed the advanced and dynamic adoption of new technologies. It has always been a lucrative region for the market’s growth. Asia Pacific includes major economies such as Japan, China, Australia, New Zealand, India, and Singapore. Increasing the operational efficiency of organizations and lowering their costs is expected to boost the overall growth of the composable applications market in Asia Pacific.
Asia is renowned for its entrepreneurial spirit, ongoing technical innovation, and quick expansion. Notwithstanding the effects of the global health pandemic, the expansion of digitalization in all industries, including healthcare, finance, and construction, has continued over the past ten years. This growth in digitalization in Asia Pacific makes it a favorable market for composable applications. Because of its adaptability, scalability, and agility, composable applications are becoming more and more common in the IT sector in Asia Pacific. Composable apps will probably be essential in helping firms innovate and maintain their competitiveness in a market that is always changing as they continue to implement digital transformation initiatives.
Composable Applications Companies
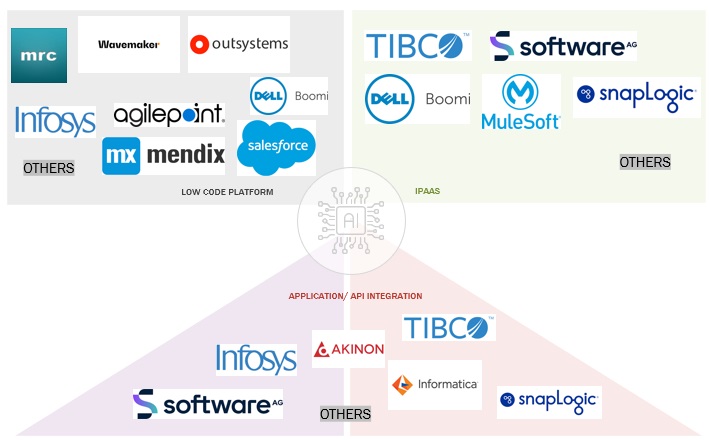
Key players in the composable applications market include Salesforce (US), Dell Boomi (US), MuleSoft (US), Informatica (US), Software AG (Germany), TIBCO Software (US), Mendix (US), OutSystems (US).
Scope of the Report
|
Report Metrics |
Details |
|
Market size available for years |
2017–2028 |
|
Base year considered |
2022 |
|
Forecast period |
2023–2028 |
|
Forecast units |
Value (USD Million/Billion) |
|
Segments covered |
|
|
Geographies covered |
North America, Europe, Asia Pacific, Rest of the World |
|
List of Companies in Composable Applications |
Salesforce (US), Dell Boomi (US), MuleSoft (US), Informatica (US), and Software AG (Germany) |
Market Segmentation
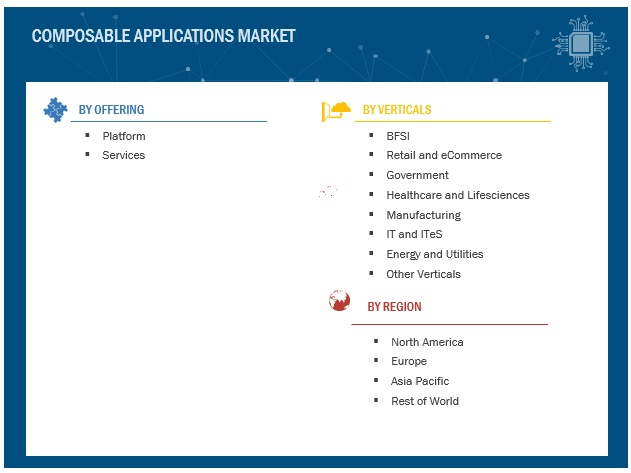
The study categorizes the composable application market based on component, software, deployment mode, end user, and region.
By Offering
- Platform
- Services
By Vertical
- BFSI
- Retail & eCommerce
- Government
- Healthcare and life sciences
- Manufacturing
- IT and ITeS
- Energy and Utilities
- Other Verticals
By Region
- North America
- Europe
- Asia Pacific
- Rest of the World
Recent Developments
- In August 2022, the company launched Composable Storefront, a customizable headless storefront that allows users to make changes to eCommerce websites with increased speed and flexibility.
- In April 2021, Informatica announced a cloud platform that employs microservices and an AI engine to combine data management capabilities and enable data and application programming interface (API) integration. The Informatica Intelligent Data Management Cloud (IDMC) is a revamped implementation of an Informatica platform that extensively uses an existing AI engine dubbed CLAIRE.
- In April 2021, Software AG launched innovations of its webMethods platform for APIs, integration, and microservices. With this release, companies can simplify and accelerate their digital transformation initiatives while speeding up their cloud adoption.
Frequently Asked Questions (FAQ):
What is the definition of composable applications?
According to MarketsandMarkets, composable applications are a set of independent, reusable programs/ pieces of code from an existing application - that are bundled with APIs (Application Programming Interfaces) to create or improve other existing applications. Composable applications allow organizations to develop applications that can be rebuilt and redeployed according to their needs.
What is the projected value of the composable applications market?
The composable applications market is projected to grow from an estimated USD 5.2 billion in 2023 to 11.8 billion USD by 2028 at a Compound Annual Growth Rate (CAGR) of 17.5% from 2023 to 2028.
Which are the key companies influencing the growth of the composable applications market?
Salesforce, Dell Boomi, MuleSoft, Informatica, and Software AG are recognized as key players in the composable applications market. They offer comprehensive solutions related to composable applications. These vendors adopt growth strategies to consistently achieve the desired growth and mark their presence in the market.
Which vertical is estimated to grow at the highest CAGR during the forecast period?
The retail and eCommerce vertical is estimated to grow at the highest CAGR during the forecast period.
Which country in North America is estimated to account for the largest market size during the forecast period?
The US is estimated to account for the largest market size during the forecast period.
To speak to our analyst for a discussion on the above findings, click Speak to Analyst


- 5.1 INTRODUCTION
-
5.2 MARKET DYNAMICSDRIVERS- Increased demand for app development- Increased need for rapid customization and scalability- Growing demand to decrease time-to-market for appsRESTRAINTS- Dependency on vendor-supplied customized solutionsOPPORTUNITIES- Growing digital transformation in IT sector- Shift of organizations from traditional monolithic approach to composable applications- Low-code composable applications to help in business composabilityCHALLENGES- Lack of skilled professionals or trainers
-
5.3 USE CASESCASE STUDY 1: OPENLEGACY HELPED STANDARD CHARTERED BANK KOREA IMPROVE CUSTOMER EXPERIENCECASE STUDY 2: SCHNEIDER ELECTRIC USED OUTSYSTEMS’ LOW-CODE PLATFORM TO TRANSFORM ITS DIGITAL FACTORYCASE STUDY 3: VIRTUSA HELPED AMERICAN INSURANCE COMPANY IMPLEMENT MICROSERVICES ARCHITECTURECASE STUDY 4: MULESOFT HELPED LUXAIRGROUP IMPROVE DIGITAL CUSTOMER EXPERIENCE AND DELIVER INNOVATIVE PROJECTSCASE STUDY 5: SNAPLOGIC HELPED TRANSFORM WORK PROCESS FOR EMPLOYEES AT SCHNEIDER ELECTRIC
- 5.4 VALUE CHAIN ANALYSIS
-
5.5 ECOSYSTEM/MARKET MAP
-
5.6 PORTER’S FIVE FORCES ANALYSISTHREAT OF NEW ENTRANTSTHREAT OF SUBSTITUTESBARGAINING POWER OF SUPPLIERSBARGAINING POWER OF BUYERSINTENSITY OF COMPETITIVE RIVALRY
-
5.7 PRICING ANALYSISPRICING MODELS
-
5.8 TECHNOLOGY ANALYSISARTIFICIAL INTELLIGENCE/MACHINE LEARNINGCLOUD COMPUTING
-
5.9 KEY STAKEHOLDERS AND BUYING CRITERIAKEY STAKEHOLDERS IN BUYING PROCESS
-
5.10 PATENT ANALYSIS
-
5.11 TARIFF AND REGULATORY LANDSCAPEHEALTH INSURANCE PORTABILITY AND ACCOUNTABILITY ACTPAYMENT CARD INDUSTRY DATA SECURITY STANDARDSOC 2 COMPLIANCE
- 5.12 TRENDS AND DISRUPTIONS IMPACTING CUSTOMERS
- 5.13 KEY CONFERENCES AND EVENTS IN 2023–2024
- 6.1 INTRODUCTION
-
6.2 PLATFORMREQUIREMENT FOR NATIVE PROGRAMMING LANGUAGE AND NEED TO ASSEMBLE APPLICATION USING GRAPHICAL ELEMENTS TO DRIVE MARKETPLATFORM: MARKET DRIVERS
-
6.3 SERVICESNEED FOR TECHNICAL EXPERTISE TO IMPLEMENT AND DEPLOY COMPOSABLE APPLICATIONS TO BOOST MARKETSERVICES: COMPOSABLE APPLICATIONS MARKET DRIVERSIMPLEMENTATION AND INTEGRATION SERVICESCONSULTING AND TRAINING SERVICESSUPPORT AND MAINTENANCE SERVICES
- 7.1 INTRODUCTION
-
7.2 BANKING, FINANCIAL SERVICES, AND INSURANCEREDUCTION IN TIME-TO-MARKET, DETECTING FRAUD AND COMPLIANCE, AND LEVERAGING CUSTOMER INSIGHTS TO PROPEL MARKETBANKING, FINANCIAL SERVICES, AND INSURANCE: COMPOSABLE APPLICATIONS MARKET DRIVERS
-
7.3 RETAIL AND ECOMMERCENEED FOR DIGITALIZING BUSINESS OPERATIONS AND AUTOMATING END-TO-END SUPPLY CHAIN PROCESSES TO DRIVE MARKETRETAIL AND ECOMMERCE: COMPOSABLE APPLICATIONS MARKET DRIVERS
-
7.4 GOVERNMENTNEED TO AUTOMATE AND OPTIMIZE BUSINESS OPERATIONS AND DRIVE DIGITAL TRANSFORMATION TO BOOST MARKETGOVERNMENT: COMPOSABLE APPLICATIONS MARKET DRIVERS
-
7.5 HEALTHCARE AND LIFE SCIENCESNEED FOR ASSESSING AND ANALYZING DATA FROM MULTIPLE SOURCES AND REDUCING DATA MANAGEMENT TIME TO BOOST MARKETHEALTHCARE AND LIFE SCIENCES: COMPOSABLE APPLICATIONS MARKET DRIVERS
-
7.6 MANUFACTURINGADVENT OF INDUSTRY 4.0 AND NEED TO INTEGRATE DIFFERENT SOFTWARE APPLICATIONS TO PROPEL MARKETMANUFACTURING: COMPOSABLE APPLICATIONS MARKET DRIVERS
-
7.7 IT AND ITESNEED TO BUILD AND TEST NEW APPLICATIONS AND SERVICES QUICKLY AND ADAPT TO CHANGING BUSINESS NEEDS TO PROPEL MARKETIT AND ITES: COMPOSABLE APPLICATIONS MARKET DRIVERS
-
7.8 ENERGY AND UTILITIESNEED TO IMPROVE POWER GRID EFFICIENCY, ADAPT TO NEW ENERGY SOURCES, AND MANAGE COMPLEX ENERGY SYSTEMS TO BOOST MARKETENERGY AND UTILITIES: COMPOSABLE APPLICATIONS MARKET DRIVERS
-
7.9 OTHER VERTICALSOTHER VERTICALS: COMPOSABLE APPLICATIONS MARKET DRIVERS
- 8.1 INTRODUCTION
-
8.2 NORTH AMERICANORTH AMERICA: COMPOSABLE APPLICATIONS MARKET DRIVERSNORTH AMERICA: RECESSION IMPACTNORTH AMERICA: REGULATORY LANDSCAPEUS- High rate of digitalization by state and local agencies and presence of several vendors to drive marketCANADA- High internet penetration rates and use of smart-handheld devices to drive market
-
8.3 EUROPEEUROPE: COMPOSABLE APPLICATIONS MARKET DRIVERSEUROPE: RECESSION IMPACTEUROPE: REGULATORY LANDSCAPEUK- Presence of several financial institutions and need to improve agility and shorten time-to-market to drive marketGERMANY- Use of enhanced technology and concentration on innovation by eCommerce and automobile industries to propel marketREST OF EUROPE
-
8.4 ASIA PACIFICASIA PACIFIC: COMPOSABLE APPLICATIONS MARKET DRIVERSASIA PACIFIC: RECESSION IMPACTASIA PACIFIC: REGULATORY LANDSCAPECHINA- Increased digitalization and rising investments to encourage organizations to adopt composable applicationsJAPAN- High emphasis on innovation and technical improvement to drive demand for composable applications solutionsAUSTRALIA AND NEW ZEALAND- Adoption of cloud solutions and need to build customized applications to boost marketREST OF ASIA PACIFIC
-
8.5 REST OF THE WORLDREST OF THE WORLD: COMPOSABLE APPLICATIONS MARKET DRIVERSREST OF THE WORLD: RECESSION IMPACTREST OF THE WORLD: REGULATORY LANDSCAPE

- 9.1 OVERVIEW
- 9.2 MARKET SHARE ANALYSIS OF LEADING PLAYERS
-
9.3 COMPANY EVALUATION QUADRANTSTARSEMERGING LEADERSPERVASIVE PLAYERSPARTICIPANTS
-
9.4 COMPETITIVE BENCHMARKINGCOMPETITIVE BENCHMARKING OF KEY PLAYERSCOMPETITIVE BENCHMARKING OF STARTUPS/SMES
-
9.5 STARTUP/SME EVALUATION QUADRANTPROGRESSIVE COMPANIESRESPONSIVE COMPANIESDYNAMIC COMPANIESSTARTING BLOCKSRECENT DEVELOPMENTS
- 10.1 INTRODUCTION
-
10.2 KEY PLAYERSSALESFORCE- Business overview- Products/Solutions/Services offered- Recent developments- MNM viewDELL BOOMI- Business overview- Products/Solutions/Services offered- Recent developments- MnM viewMULESOFT- Business overview- Products/Solutions/Services offered- Recent developments- MnM viewINFORMATICA- Business overview- Products/Solutions/Services offered- Recent developments- MnM viewSOFTWARE AG- Business overview- Products/Solutions/Services offered- Recent developments- MnM viewTIBCO SOFTWARE- Business overview- Products/Solutions/Services offered- Recent developmentsMENDIX- Business overview- Products/Solutions/Services offered- Recent developmentsOUTSYSTEMS- Business overview- Products/Solutions/Services offered- Recent developmentsSNAPLOGIC- Business overview- Products/Solutions/Services offered- Recent developmentsOPENLEGACY- Business overview- Products/Solutions/Services offered- Recent developmentsAGILEPOINT- Business overview- Products/Solutions/Services offeredIBM- Business overview- Products/Solutions/Services offered- Recent developments
-
10.3 OTHER PLAYERSSHOPIFYAKINONINFOSYSCONTENTSTACKWAVEMAKERVIRTUSASYMPHONYAIL7 INFORMATICSSCHEER PASMICHAELS, ROSS & COLE
- 11.1 INTRODUCTION TO ADJACENT MARKETS
- 11.2 LIMITATIONS
-
11.3 ADJACENT MARKETSLOW CODE DEVELOPMENT PLATFORM MARKETINTEGRATION PLATFORM AS A SERVICE MARKET
- 12.1 DISCUSSION GUIDE
- 12.2 KNOWLEDGESTORE: MARKETSANDMARKETS’ SUBSCRIPTION PORTAL
- 12.3 CUSTOMIZATION OPTIONS
- 12.4 RELATED REPORTS
- 12.5 AUTHOR DETAILS
- TABLE 1 USD EXCHANGE RATES, 2018–2022
- TABLE 2 FACTOR ANALYSIS
- TABLE 3 COMPOSABLE APPLICATIONS MARKET SIZE AND GROWTH, 2017–2022 (USD MILLION, Y-O-Y %)
- TABLE 4 MARKET SIZE AND GROWTH, 2023–2028 (USD MILLION, Y-O-Y %)
- TABLE 5 ECOSYSTEM: MARKET
- TABLE 6 IMPACT OF PORTER’S FIVE FORCES ON MARKET
- TABLE 7 PRICING MODELS OF OUTSYSTEMS
- TABLE 8 PRICING MODELS OF MENDIX
- TABLE 9 INFLUENCE OF STAKEHOLDERS ON BUYING PROCESS
- TABLE 10 REGULATORY BODIES, GOVERNMENT AGENCIES, AND OTHER ORGANIZATIONS
- TABLE 11 MARKET: LIST OF CONFERENCES AND EVENTS, 2023–2024
- TABLE 12 MARKET, BY OFFERING, 2017–2022 (USD MILLION)
- TABLE 13 MARKET, BY OFFERING, 2023–2028 (USD MILLION)
- TABLE 14 PLATFORM: MARKET, BY REGION, 2017–2022 (USD MILLION)
- TABLE 15 PLATFORM: MARKET, BY REGION, 2023–2028 (USD MILLION)
- TABLE 16 SERVICES: MARKET, BY REGION, 2017–2022 (USD MILLION)
- TABLE 17 SERVICES: MARKET, BY REGION, 2023–2028 (USD MILLION)
- TABLE 18 COMPOSABLE APPLICATIONS MARKET, BY VERTICAL, 2017–2022 (USD MILLION)
- TABLE 19 COMPOSABLE APPLICATIONS MARKET, BY VERTICAL, 2023–2028 (USD MILLION)
- TABLE 20 BANKING, FINANCIAL SERVICES, AND INSURANCE: MARKET, BY REGION, 2017–2022 (USD MILLION)
- TABLE 21 BANKING, FINANCIAL SERVICES, AND INSURANCE: MARKET, BY REGION, 2023–2028 (USD MILLION)
- TABLE 22 RETAIL AND ECOMMERCE: MARKET, BY REGION, 2017–2022 (USD MILLION)
- TABLE 23 RETAIL AND ECOMMERCE: MARKET, BY REGION, 2023–2028 (USD MILLION)
- TABLE 24 GOVERNMENT: MARKET, BY REGION, 2017–2022 (USD MILLION)
- TABLE 25 GOVERNMENT: MARKET, BY REGION, 2023–2028 (USD MILLION)
- TABLE 26 HEALTHCARE AND LIFE SCIENCES: MARKET, BY REGION, 2017–2022 (USD MILLION)
- TABLE 27 HEALTHCARE AND LIFE SCIENCES: MARKET, BY REGION, 2023–2028 (USD MILLION)
- TABLE 28 MANUFACTURING: MARKET, BY REGION, 2017–2022 (USD MILLION)
- TABLE 29 MANUFACTURING: MARKET, BY REGION, 2023–2028 (USD MILLION)
- TABLE 30 IT AND ITES: MARKET, BY REGION, 2017–2022 (USD MILLION)
- TABLE 31 IT AND ITES: MARKET, BY REGION, 2023–2028 (USD MILLION)
- TABLE 32 ENERGY AND UTILITIES: MARKET, BY REGION, 2017–2022 (USD MILLION)
- TABLE 33 ENERGY AND UTILITIES: MARKET, BY REGION, 2023–2028 (USD MILLION)
- TABLE 34 OTHER VERTICALS: MARKET, BY REGION, 2017–2022 (USD MILLION)
- TABLE 35 OTHER VERTICALS: MARKET, BY REGION, 2023–2028 (USD MILLION)
- TABLE 36 COMPOSABLE APPLICATIONS MARKET, BY REGION, 2017–2022 (USD MILLION)
- TABLE 37 COMPOSABLE APPLICATIONS MARKET, BY REGION, 2023–2028 (USD MILLION)
- TABLE 38 NORTH AMERICA: MARKET, BY OFFERING, 2017–2022 (USD MILLION)
- TABLE 39 NORTH AMERICA: MARKET, BY OFFERING, 2023–2028 (USD MILLION)
- TABLE 40 NORTH AMERICA: MARKET, BY VERTICAL, 2017–2022 (USD MILLION)
- TABLE 41 NORTH AMERICA: MARKET, BY VERTICAL, 2023–2028 (USD MILLION)
- TABLE 42 NORTH AMERICA: MARKET, BY COUNTRY, 2017–2022 (USD MILLION)
- TABLE 43 NORTH AMERICA: MARKET, BY COUNTRY, 2023–2028 (USD MILLION)
- TABLE 44 US: COMPOSABLE APPLICATIONS MARKET, BY OFFERING, 2017–2022 (USD MILLION)
- TABLE 45 US: MARKET, BY OFFERING, 2023–2028 (USD MILLION)
- TABLE 46 US: MARKET, BY VERTICAL, 2017–2022 (USD MILLION)
- TABLE 47 US: MARKET, BY VERTICAL, 2023–2028 (USD MILLION)
- TABLE 48 CANADA: MARKET, BY OFFERING, 2017–2022 (USD MILLION)
- TABLE 49 CANADA: MARKET, BY OFFERING, 2023–2028 (USD MILLION)
- TABLE 50 CANADA: MARKET, BY VERTICAL, 2017–2022 (USD MILLION)
- TABLE 51 CANADA: MARKET, BY VERTICAL, 2023–2028 (USD MILLION)
- TABLE 52 EUROPE: MARKET, BY OFFERING, 2017–2022 (USD MILLION)
- TABLE 53 EUROPE: MARKET, BY OFFERING, 2023–2028 (USD MILLION)
- TABLE 54 EUROPE: MARKET, BY VERTICAL, 2017–2022 (USD MILLION)
- TABLE 55 EUROPE: MARKET, BY VERTICAL, 2023–2028 (USD MILLION)
- TABLE 56 EUROPE: MARKET, BY COUNTRY, 2017–2022 (USD MILLION)
- TABLE 57 EUROPE: MARKET, BY COUNTRY, 2023–2028 (USD MILLION)
- TABLE 58 UK: COMPOSABLE APPLICATIONS MARKET, BY OFFERING, 2017–2022 (USD MILLION)
- TABLE 59 UK: MARKET, BY OFFERING, 2023–2028 (USD MILLION)
- TABLE 60 UK: MARKET, BY VERTICAL, 2017–2022 (USD MILLION)
- TABLE 61 UK: MARKET, BY VERTICAL, 2023–2028 (USD MILLION)
- TABLE 62 GERMANY: MARKET, BY OFFERING, 2017–2022 (USD MILLION)
- TABLE 63 GERMANY: MARKET, BY OFFERING, 2023–2028 (USD MILLION)
- TABLE 64 GERMANY: MARKET, BY VERTICAL, 2017–2022 (USD MILLION)
- TABLE 65 GERMANY: MARKET, BY VERTICAL, 2023–2028 (USD MILLION)
- TABLE 66 REST OF EUROPE: MARKET, BY OFFERING, 2017–2022 (USD MILLION)
- TABLE 67 REST OF EUROPE: MARKET, BY OFFERING, 2023–2028 (USD MILLION)
- TABLE 68 REST OF EUROPE: MARKET, BY VERTICAL, 2017–2022 (USD MILLION)
- TABLE 69 REST OF EUROPE: MARKET, BY VERTICAL, 2023–2028 (USD MILLION)
- TABLE 70 ASIA PACIFIC: MARKET, BY OFFERING, 2017–2022 (USD MILLION)
- TABLE 71 ASIA PACIFIC: MARKET, BY OFFERING, 2023–2028 (USD MILLION)
- TABLE 72 ASIA PACIFIC: MARKET, BY VERTICAL, 2017–2022 (USD MILLION)
- TABLE 73 ASIA PACIFIC: MARKET, BY VERTICAL, 2023–2028 (USD MILLION)
- TABLE 74 ASIA PACIFIC: MARKET, BY COUNTRY, 2017–2022 (USD MILLION)
- TABLE 75 ASIA PACIFIC: MARKET, BY COUNTRY, 2023–2028 (USD MILLION)
- TABLE 76 CHINA: MARKET, BY OFFERING, 2017–2022 (USD MILLION)
- TABLE 77 CHINA: MARKET, BY OFFERING, 2023–2028 (USD MILLION)
- TABLE 78 CHINA: MARKET, BY VERTICAL, 2017–2022 (USD MILLION)
- TABLE 79 CHINA: MARKET, BY VERTICAL, 2023–2028 (USD MILLION)
- TABLE 80 JAPAN: MARKET, BY OFFERING, 2017–2022 (USD MILLION)
- TABLE 81 JAPAN: MARKET, BY OFFERING, 2023–2028 (USD MILLION)
- TABLE 82 JAPAN: MARKET, BY VERTICAL, 2017–2022 (USD MILLION)
- TABLE 83 JAPAN: MARKET, BY VERTICAL, 2023–2028 (USD MILLION)
- TABLE 84 AUSTRALIA AND NEW ZEALAND: MARKET, BY OFFERING, 2017–2022 (USD MILLION)
- TABLE 85 AUSTRALIA AND NEW ZEALAND: MARKET, BY OFFERING, 2023–2028 (USD MILLION)
- TABLE 86 AUSTRALIA AND NEW ZEALAND: MARKET, BY VERTICAL, 2017–2022 (USD MILLION)
- TABLE 87 AUSTRALIA AND NEW ZEALAND: MARKET, BY VERTICAL, 2023–2028 (USD MILLION)
- TABLE 88 REST OF ASIA PACIFIC: MARKET, BY OFFERING, 2017–2022 (USD MILLION)
- TABLE 89 REST OF ASIA PACIFIC: MARKET, BY OFFERING, 2023–2028 (USD MILLION)
- TABLE 90 REST OF ASIA PACIFIC: MARKET, BY VERTICAL, 2017–2022 (USD MILLION)
- TABLE 91 REST OF ASIA PACIFIC: MARKET, BY VERTICAL, 2023–2028 (USD MILLION)
- TABLE 92 REST OF THE WORLD: MARKET, BY OFFERING, 2017–2022 (USD MILLION)
- TABLE 93 REST OF THE WORLD: MARKET, BY OFFERING, 2023–2028 (USD MILLION)
- TABLE 94 REST OF THE WORLD: MARKET, BY VERTICAL, 2017–2022 (USD MILLION)
- TABLE 95 REST OF THE WORLD: MARKET, BY VERTICAL, 2023–2028 (USD MILLION)
- TABLE 96 COMPOSABLE APPLICATIONS MARKET: DEGREE OF COMPETITION
- TABLE 97 COMPANY REGIONAL FOOTPRINT
- TABLE 98 COMPANY OFFERING FOOTPRINT
- TABLE 99 COMPANY VERTICAL FOOTPRINT
- TABLE 100 LIST OF STARTUPS/SMES
- TABLE 101 SME/STARTUP COMPANY OFFERING FOOTPRINT
- TABLE 102 SME/STARTUP COMPANY VERTICAL FOOTPRINT
- TABLE 103 SME/STARTUP COMPANY REGIONAL FOOTPRINT
- TABLE 104 MARKET: PRODUCT LAUNCHES, 2020–2023
- TABLE 105 MARKET: DEALS, 2020–2023
- TABLE 106 MARKET: OTHERS, 2021–2023
- TABLE 107 SALESFORCE: BUSINESS OVERVIEW
- TABLE 108 SALESFORCE: PRODUCTS/SOLUTIONS/SERVICES OFFERED
- TABLE 109 SALESFORCE: PRODUCT LAUNCHES AND ENHANCEMENTS
- TABLE 110 SALESFORCE: DEALS
- TABLE 111 DELL BOOMI: BUSINESS OVERVIEW
- TABLE 112 DELL BOOMI: PRODUCTS/SOLUTIONS OFFERED
- TABLE 113 DELL BOOMI: PRODUCT LAUNCHES AND ENHANCEMENTS
- TABLE 114 DELL BOOMI: DEALS
- TABLE 115 DELL BOOMI: OTHERS
- TABLE 116 MULESOFT: BUSINESS OVERVIEW
- TABLE 117 MULESOFT: PRODUCTS/SOLUTIONS/SERVICES OFFERED
- TABLE 118 MULESOFT: PRODUCT LAUNCHES AND ENHANCEMENTS
- TABLE 119 MULESOFT: DEALS
- TABLE 120 INFORMATICA: BUSINESS OVERVIEW
- TABLE 121 INFORMATICA: PRODUCTS/SOLUTIONS/SERVICES OFFERED
- TABLE 122 INFORMATICA: PRODUCT LAUNCHES AND ENHANCEMENTS
- TABLE 123 INFORMATICA: DEALS
- TABLE 124 SOFTWARE AG: BUSINESS OVERVIEW
- TABLE 125 SOFTWARE AG: PRODUCTS/SOLUTIONS/SERVICES OFFERED
- TABLE 126 SOFTWARE AG: PRODUCT LAUNCHES AND ENHANCEMENTS
- TABLE 127 SOFTWARE AG: DEALS
- TABLE 128 TIBCO SOFTWARE: BUSINESS OVERVIEW
- TABLE 129 TIBCO SOFTWARE: PRODUCTS/SOLUTIONS/SERVICES OFFERED
- TABLE 130 TIBCO SOFTWARE: PRODUCT LAUNCHES AND ENHANCEMENTS
- TABLE 131 TIBCO SOFTWARE : DEALS
- TABLE 132 MENDIX: BUSINESS OVERVIEW
- TABLE 133 MENDIX: PRODUCTS/SOLUTIONS/SERVICES OFFERED
- TABLE 134 MENDIX: PRODUCT LAUNCHES AND ENHANCEMENTS
- TABLE 135 MENDIX: DEALS
- TABLE 136 OUTSYSTEMS: BUSINESS OVERVIEW
- TABLE 137 OUTSYSTEMS: PRODUCTS/SOLUTIONS/SERVICES OFFERED
- TABLE 138 OUTSYSTEMS: PRODUCT LAUNCHES AND ENHANCEMENTS
- TABLE 139 OUTSYSTEMS: DEALS
- TABLE 140 OUTSYSTEMS: OTHERS
- TABLE 141 SNAPLOGIC: BUSINESS OVERVIEW
- TABLE 142 SNAPLOGIC: PRODUCTS/SOLUTIONS/SERVICES OFFERED
- TABLE 143 SNAPLOGIC: PRODUCT LAUNCHES AND ENHANCEMENTS
- TABLE 144 SNAPLOGIC: DEALS
- TABLE 145 OPENLEGACY: BUSINESS OVERVIEW
- TABLE 146 OPENLEGACY: PRODUCTS/SOLUTIONS/SERVICES OFFERED
- TABLE 147 OPENLEGACY: PRODUCT LAUNCHES AND ENHANCEMENTS
- TABLE 148 OPENLEGACY: DEALS
- TABLE 149 AGILEPOINT: BUSINESS OVERVIEW
- TABLE 150 AGILEPOINT: PRODUCTS/SOLUTIONS/SERVICES OFFERED
- TABLE 151 IBM: BUSINESS OVERVIEW
- TABLE 152 IBM: PRODUCTS/SOLUTIONS/SERVICES OFFERED
- TABLE 153 IBM: PRODUCT LAUNCHES
- TABLE 154 IBM: DEALS
- TABLE 155 ADJACENT MARKETS AND FORECASTS
- TABLE 156 LOW-CODE DEVELOPMENT PLATFORM MARKET, BY COMPONENT, 2018–2025 (USD MILLION)
- TABLE 157 PLATFORM: LOW-CODE DEVELOPMENT PLATFORM MARKET, BY REGION, 2018–2025 (USD MILLION)
- TABLE 158 SERVICES: LOW-CODE DEVELOPMENT PLATFORM MARKET, BY REGION, 2018–2025 (USD MILLION)
- TABLE 159 INTEGRATION PLATFORM AS A SERVICE MARKET, BY SERVICE TYPE, 2016–2020 (USD MILLION)
- TABLE 160 INTEGRATION PLATFORM AS A SERVICE MARKET, BY SERVICE TYPE, 2021–2026 (USD MILLION)
- TABLE 161 INTEGRATION PLATFORM AS A SERVICE MARKET, BY VERTICAL, 2016–2020 (USD MILLION)
- TABLE 162 INTEGRATION PLATFORM AS A SERVICE MARKET, BY VERTICAL, 2021–2026 (USD MILLION)
- FIGURE 1 COMPOSABLE APPLICATIONS MARKET: RESEARCH DESIGN
- FIGURE 2 MARKET: RESEARCH FLOW
- FIGURE 3 MARKET SIZE ESTIMATION METHODOLOGY—APPROACH (SUPPLY SIDE): REVENUE OF PLATFORM/SERVICES OF COMPOSABLE APPLICATIONS VENDORS
- FIGURE 4 MARKET SIZE ESTIMATION METHODOLOGY: SUPPLY-SIDE ANALYSIS
- FIGURE 5 MARKET SIZE ESTIMATION METHODOLOGY - APPROACH (DEMAND SIDE): MARKET
- FIGURE 6 MARKET SIZE AND YOY GROWTH RATE (2021–2028)
- FIGURE 7 NORTH AMERICA TO ACCOUNT FOR LARGEST MARKET SHARE IN 2023
- FIGURE 8 FASTEST-GROWING SEGMENTS OF MARKET
- FIGURE 9 DIGITAL TRANSFORMATION AND NEED TO BUILD MODULAR AND SCALABLE COMPOSABLE APPLICATIONS TO DRIVE MARKET
- FIGURE 10 PLATFORM SEGMENT TO ACCOUNT FOR LARGER MARKET SHARE IN 2023
- FIGURE 11 BANKING, FINANCIAL SERVICES, AND INSURANCE SEGMENT TO ACCOUNT FOR LARGEST MARKET SHARE IN 2023
- FIGURE 12 EUROPE TO EMERGE AS BEST MARKET FOR INVESTMENTS IN NEXT FIVE YEARS
- FIGURE 13 DRIVERS, RESTRAINTS, OPPORTUNITIES, AND CHALLENGES: MARKET
- FIGURE 14 COMPOSABLE APPLICATIONS: SPEED OF DEPLOYMENT OF IT RESOURCES
- FIGURE 15 VALUE CHAIN ANALYSIS: MARKET
- FIGURE 16 ECOSYSTEM: MARKET
- FIGURE 17 PORTER’S FIVE FORCES ANALYSIS: MARKET
- FIGURE 18 INFLUENCE OF STAKEHOLDERS ON BUYING PROCESS
- FIGURE 19 COMPOSABLE APPLICATIONS MARKET: PATENT ANALYSIS
- FIGURE 20 MARKET: TRENDS AND DISRUPTIONS IMPACTING CUSTOMERS/CLIENTS
- FIGURE 21 SERVICES SEGMENT TO RECORD HIGHER CAGR DURING FORECAST PERIOD
- FIGURE 22 BANKING, FINANCIAL SERVICES, AND INSURANCE SEGMENT TO HOLD LARGEST MARKET SIZE DURING FORECAST PERIOD
- FIGURE 23 NORTH AMERICA TO HOLD LARGEST MARKET SIZE DURING FORECAST PERIOD
- FIGURE 24 NORTH AMERICA: MARKET SNAPSHOT
- FIGURE 25 ASIA PACIFIC: MARKET SNAPSHOT
- FIGURE 26 MARKET: MARKET SHARE ANALYSIS
- FIGURE 27 MARKET: KEY COMPANY EVALUATION QUADRANT
- FIGURE 28 MARKET: REGIONAL SNAPSHOT OF KEY MARKET PLAYERS AND THEIR HEADQUARTERS
- FIGURE 29 MARKET: STARTUP/SME EVALUATION QUADRANT
- FIGURE 30 SALESFORCE: COMPANY SNAPSHOT
- FIGURE 31 INFORMATICA: COMPANY SNAPSHOT
- FIGURE 32 SOFTWARE AG: COMPANY SNAPSHOT
- FIGURE 33 IBM: COMPANY SNAPSHOT
This study involved multiple steps in estimating the current size of the composable applications market. Extensive secondary research was carried out to collect information on this industry. The next step was to validate these findings, assumptions, and sizing with industry experts across the value chain using primary research. The top-down and bottom-up approaches were employed to estimate the total market size. After that, the market breakup and data triangulation procedures were used to estimate the market size of the segments and sub-segments.
Secondary Research
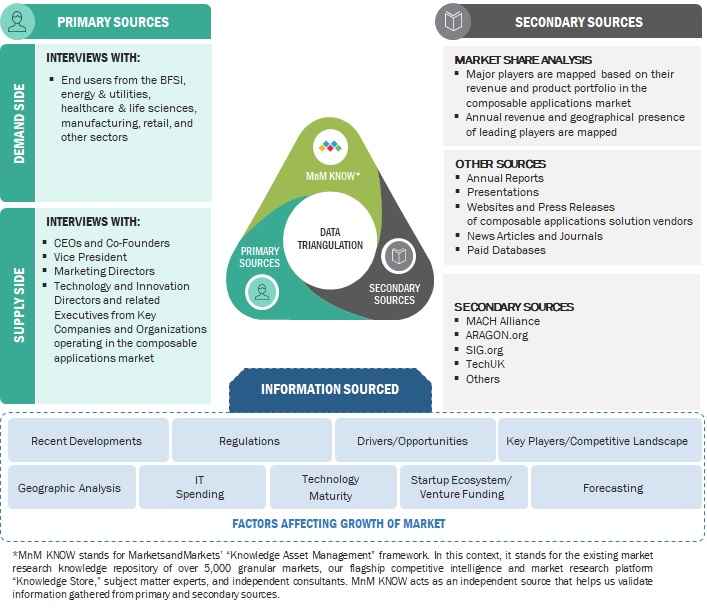
In the secondary research process, various sources were referred for identifying and collecting information for this study. The secondary sources included annual reports, press releases, investor presentations of companies, white papers, journals, certified publications, and articles from recognized authors, directories, and databases.
Primary Research
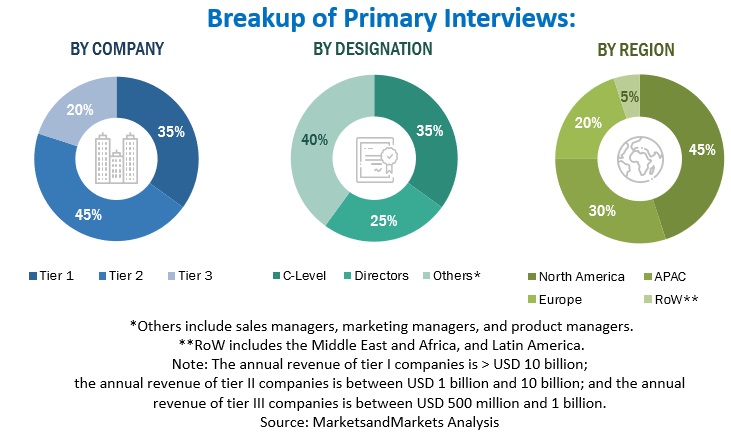
Various primary sources from the supply and demand sides were interviewed to obtain qualitative and quantitative information for this report in the primary research process. The primary sources from the supply side included various industry experts, including Chief Executive Officers (CEOs), Vice Presidents (VPs), marketing directors, technology and innovation directors, and related key executives from various key companies and organizations operating in the composable applications market. Extensive primary research was conducted to gather information, verify, and validate the critical numbers arrived at. It was also conducted to identify the segmentation types, industry trends, the competitive landscape of the composable application market players, and the key market dynamics, such as drivers, restraints, opportunities, challenges, and key strategies.
To know about the assumptions considered for the study, download the pdf brochure
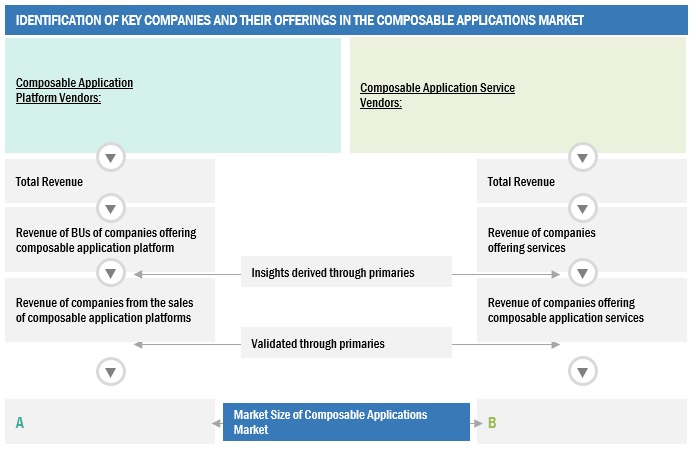
Market Size Estimation
In the market engineering process, the top-down and bottom-up approaches and several data triangulation methods, to perform the market estimation and market forecasting for the overall market segments and sub-segments listed in this report. Extensive qualitative and quantitative analysis was performed on the complete market engineering process to list key information/insights throughout the report. This entire procedure included studying the annual and financial reports of top market players and extensive interviews for key insights from industry leaders, such as CEOs, VPs, directors, and marketing executives. All percentage splits and breakups were determined using secondary sources and verified through primary sources. All possible parameters that affect the market covered in this research study have been accounted for, viewed in extensive detail, verified through primary research, and analyzed to get the final quantitative and qualitative data. This data is consolidated and added to detailed inputs and analysis from MarketsandMarkets.
Data Triangulation
After arriving at the overall market size using the market size estimation processes explained above, the market was split into several segments and sub-segments. The data triangulation and market breakup procedures were employed, wherever applicable, to complete the overall market engineering process and arrive at the exact statistics of each market segment and sub-segment. The data was triangulated by studying various factors and trends from both the demand and supply sides.
Market Definition
Composable applications are a set of independent, reusable programs/ pieces of code from an existing application - that are bundled with APIs (Application Programming Interfaces) to create or improve other existing applications. It allows organizations to develop applications that can be rebuilt and redeployed according to their needs.
Key stakeholders
- Low-Code Development Platform Providers
- Composable Applications Platform Providers
- IT Security Agencies
- Cloud Service Providers
- Professional Service Providers
- Composable Applications Vendors
- Independent Software Vendors
- Consultants/Consultancies/Advisory Firms
- System Integrators
- Third-Party Providers
- Value-added Resellers (VARs)
- Project Managers
- Business Analysts
Report Objectives
- To describe and forecast the global composable applications market by offering, vertical, and region based on individual growth trends and contributions toward the overall market
- To provide detailed information about the major factors (drivers, opportunities, restraints, and challenges) influencing the growth of the market
- To analyze the opportunities in the market for stakeholders by identifying the high-growth segments of the market
- To forecast the size of the market segments with respect to five main regions: North America, Europe, Asia Pacific, and the Rest of the World
- To analyze sub-segments of the market with respect to individual growth trends, prospects, and contributions to the overall market
- To profile the key players of the market and comprehensively analyze their market size and core competencies
- To track and analyze the competitive developments, such as product enhancements and product launches, acquisitions, partnerships, and collaborations in the composable applications market globally
Customization Options
MarketsandMarkets offers the following customization for this market report:
- Additional country-level analysis of the composable application market
- Profiling of additional market players (up to 5)
Product Analysis
- Product matrix, which provides a detailed comparison of the product portfolio of each company in the Composable Applications Market.


 Generating Response ...


Growth opportunities and latent adjacency in Composable Applications Market