Combination Starter Market by Type (Reversing & Non-reversing), by Rated Power, by Application, by Industry (Oil & Gas, Water & Wastewater, Infrastructure, Metals & Mining, Food & Beverages & Others) and by Region - Global Forecast and Trends to 2020


[152 Pages Report] The global combination starter market size touched USD 687.1 Million in 2014, at USD 926.6 Million by 2020, and is expected to grow at a CAGR of 5.19% from 2015to 2020. Factors driving the combination starter market include the increasing demand for pumps, low cost & compact nature of combination starters, and growing concerns regarding motor control and protection. The global combination starter market has been primarily segmented on the basis of its type which includes reversing and non-reversing. Secondly it has been segmented on the basis of power rating into up to 7.5KW, 7.5-75 KW and above 75 KW. The Third type of segmentation is by application which includes; pumps, fans, compressors, conveyors, and others. The market has been further segmented on the basis of end-use industry into oil & gas, water & wastewater, infrastructure, metals & mining, Food & Beverage and others. Finally, the market is segmented based on the regional markets into North America, South America, Europe, Asia-Pacific, and the Middle East & Africa. Historical Year � 2013
- Base Year � 2014
- Estimated Year � 2015
- Projected Year � 2020
- Forecast Period � 2015 to 2020
For company profiles, 2014 has been considered as the base year. Wherever information was unavailable for the base year, the prior year has been considered.
Research Methodology:
- This research study has involved extensive usage of secondary sources, directories, and databases (such as Hoovers, Bloomberg, Businessweek, Factiva, and OneSource) to identify and collect information useful for a technical, market-oriented, and commercial study of the combination starter market.
- In-depth interviews have been conducted with various primary respondents, including key industry participants, subject matter experts, C-level executives of market players, and industry consultants, among others.
- After arriving at the overall market size, the total market has been split into several segments and subsegments. To complete the overall market engineering process and arrive at exact statistics for all the segments and subsegments, the data triangulation and market breakdown procedure have been employed, wherever applicable.
- The data has been triangulated by studying various factors and trends from both, the demand and supply sides. Along with this, the market has been validated using both, the top-down and bottom-up approaches.
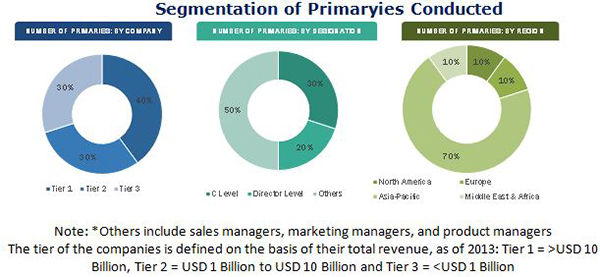
The figure below illustrates the breakdown of the primaries on the basis of company, designation, and region, conducted during the research study.
This study answers several questions for stakeholders such as OEMs, distributers & suppliers, consulting firms, private equity groups, investment houses, equity research firms, and others. The report provides information about key market segments to focus on in the next two to five years to prioritize efforts and investments.
Scope of the report:
- By Type:
- Non-reversing
- Reversing
- By Rated Power:
- Up to 7.5 kW
- 7.5 to 75 kW
- Above 75 kW
- By Application:
- Pumps
- Fans
- Compressors
- Conveyors
- Others
- By Industry:
- Oil & gas
- Water & wastewater
- Infrastructure (residential & commercial)
- Metals & mining
- Food & beverages
- Others
- By Region:
- Asia-Pacific
- Europe
- North America
- South America
- The Middle East & Africa
Available Customizations:
With the given market data, MarketsandMarkets offers customizations as per the client�s specific needs. The following customization options are available for the report:
Regional Analysis
- Further breakdown of region/country-specific analysis
Company Information
- Detailed analysis and profiling of additional market players (Up to 5)
Global combination starter market is projected to grow at a CAGR of 5.19% from 2015 to 2020, to reach a market size of USD 926.6 Million by 2020. This growth can be attributed to the increasing demand for motors and growing concerns related to motor control & protection.
All equipment and services related to electricity, power transmission, and electronics require motor control and protection, along with short circuit and overload protection. Combination starter plays a crucial role in safeguarding the equipment and related machinery from short circuits and overloads in the event of power abnormalities. The report segments the combination starter market on the basis of major end-user industries, which include oil & gas, water & wastewater, infrastructure, food & beverages, metals & mining, and other industries. Oil & gas, water & wastewater, and infrastructure are set to be the fastest-growing industries in the combination starter market from 2015 to 2020.
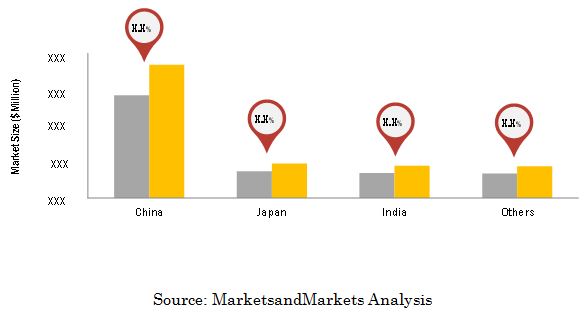
In terms of type, non-reversing combination starters are the fastest-growing segment in the market. The demand for these combination starters is higher than that of reversible combination starters. Non-reversing combination starters accounted for 79% of the total combination starter market in 2014. In most motor applications, the motor is required to move in only one direction; however, in some instances, such as in conveyors and escalators, the motor is required to move in forward and reverse directions as and when required. Non-reversing combination starters are expected to dominate the market throughout the forecast period. Asia-Pacific was the leading market for combination starters in 2014, owing to large scale industrialization and urbanization in the region. It is currently focusing on developing its existing infrastructure. China, Japan, and India are the fastest-growing markets for combination starters in the region, registering CAGRs of 5.42%, 5.23%, and 5.29% respectively during the forecast period. The figure below indicates the market sizes of Asia-Pacific countries in 2015 and 2020, along with their CAGR for 2015 to 2020.
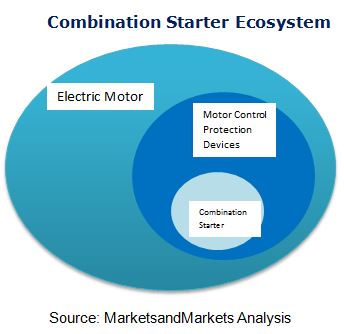
A combination starter is composed of a motor starter, circuit breaker or disconnecting switch, overload relay, an enclosure of desired specification, and wirings, among other elements. Prices of the major components required for combination starters are not very volatile, which makes the overall assembly of the device inexpensive which makes the combination starters highly preferable on capital perspectives. But the market is competitive with the presence of soft starters and variable frequency drives. A.
In spite of the high cost, variable frequency drives are increasingly adopted by the industries wherever the efficiency and superior control are required. This factor has proved to be a restraint for the combination starter market.
Some of the leading players in the combination starter market are ABB Ltd. (Switzerland), Siemens AG (Germany), Schneider Electric (France), Eaton Corporation (Ireland), and General Electric Company (U.S.). New product development was the strategy most widely adopted by top players in the market, constituting 31% of the total strategic developments during 2011-15s . It was followed by mergers & acquisitions, expansions, and other developments.
 Exclusive indicates content/data unique to MarketsandMarkets and not available with any competitors.
Table of Contents
1 Introduction (Page No. - 19)
1.1 Objectives of the Study
1.2 Market Definition
1.3 Market Scope
1.3.1 Markets Covered
1.3.2 Years Considered for the Study
1.4 Currency
1.5 Limitations
1.6 Stakeholders
2 Research Methodology (Page No. - 22)
2.1.1 Secondary Data
2.1.1.1 Key Data From Secondary Sources
2.1.2 Primary Data
2.1.2.1 Key Data From Primary Sources
2.2 Market Size Estimation
2.3 Breakdown of Primary Interviews
2.4 Market Breakdown & Data Triangulation
2.4.1 Key Industry Insights
2.5 Research Assumptions and Limitations
2.5.1 Assumptions
2.5.2 Limitations
3 Executive Summary (Page No. - 32)
4 Premium Insights (Page No. - 37)
4.1 Attractive Opportunities in the Combination Starter Market
4.2 Combination Starter Market: Application Segment
4.3 Combination Starter Market in Asia-Pacific
4.4 Non-Reversing Combination Starters to Dominate the Global Market During the Forecast Period
4.5 Combination Starter Market: Asia-Pacific
4.6 Combination Starter Market By Industry End-User
5 Market Overview (Page No. - 44)
5.1 Introduction
5.2 Combination Starter Market: Market Segmentation
5.2.1 By Type
5.2.2 By Application
5.2.3 By Rated Power (KW)
5.2.4 By Industry
5.2.5 By Region
5.3 Market Dynamics
5.3.1 Drivers
5.3.1.1 Increasing Demand for Pumps
5.3.1.2 Minimal Cost & Compact Nature
5.3.2 Restraints
5.3.2.1 Availability of More Sophisticated Products
5.3.2.2 Competitive Pricing of Vfds and Soft Starters in the Low-Voltage Segment
5.3.3 Opportunities
5.3.3.1 Applications Employing Numerous Motors
5.3.3.2 Opportunities in Hazardous Applications
5.3.4 Challenges
5.3.4.1 Widespread Adoption of Combination Starters
5.4 Impact of Market Dynamics
6 Industry Trends (Page No. - 51)
6.1 Introduction
6.2 Supply Chain Analysis
6.3 Porter�s Five Forces Analysis
6.3.1 Threat of New Entrants
6.3.2 Threat of Substitutes
6.3.3 Bargaining Power of Suppliers
6.3.4 Bargaining Power of Buyers
6.3.5 Intensity of Competitive Rivalry
7 Combination Starter Market, By Type (Page No. - 56)
7.1 Introduction
7.2 Non-Reversing Combination Starter Market
7.3 Reversing Combination Starter Market
8 Combination Starter Market, By Rated Power (KW) (Page No. - 59)
8.1 Introduction
8.2 Combination Starter With Rated Power Up to 7.5 KW
8.3 Combination Starter With Rated Power 7.5 to 75 KW
8.4 Combination Starter With Rated Power Above 75 KW
9 Combination Starter Market, By Industry (Page No. - 63)
9.1 Introduction
9.2 Oil & Gas
9.3 Water & Wastewater
9.4 Infrastructure (Residential & Commercial)
9.5 Metals & Mining
9.6 Food & Beverages
9.7 Other Industries
10 Combination Starter Market, By Application (Page No. - 71)
10.1 Introduction
10.2 Pumps
10.3 Fans
10.4 Compressors
10.5 Conveyors
10.6 Other Applications
11 Combination Starter Market, By Region (Page No. - 76)
11.1 Introduction
11.2 Asia-Pacific
11.3 By Type
11.4 By Rated Power
11.5 By Application
11.6 By Industry
11.7 By Country
11.7.1 China
11.7.2 Japan
11.7.3 India
11.7.4 Rest of Asia-Pacific
11.8 Europe
11.9 By Type
11.10 By Rated Power
11.11 By Application
11.12 By Industry
11.13 By Country
11.13.1 Germany
11.13.2 Russia
11.13.3 U.K.
11.13.4 France
11.13.5 Rest of Europe
11.14 North America
11.15 By Type
11.16 By Rated Power
11.17 By Application
11.18 By Industry
11.19 By Country
11.19.1 U.S.
11.19.2 Canada
11.19.3 Mexico
11.20 South America
11.21 By Type
11.22 By Rated Power
11.23 By Application
11.24 By Industry
11.25 By Country
11.25.1 Brazil
11.25.2 Argentina
11.25.3 Venezuela
11.25.4 Rest of South America
11.26 the Middle East & Africa
11.27 By Type
11.28 By Rated Power
11.29 By Application
11.30 By Industry
11.31 By Country
11.31.1 Saudi Arabia
11.31.2 Uae
11.31.3 South Africa
11.31.4 Rest of the Middle East & Africa
12 Competitive Landscape (Page No. - 107)
12.1 Overview
12.2 Market Share Analysis, By Key Players
12.3 Competitive Situation & Trends
12.4 New Product Development
12.5 Mergers & Acquisitions
12.6 Expansion
12.7 Other Developments
13 Company Profiles (Page No. - 116)
13.1 Introduction
13.2 ABB Ltd.
13.2.1 Business Overview
13.2.2 Products Offered
13.2.3 Developments, 2012�2015
13.2.4 SWOT Analysis
13.2.5 MnM View
13.3 Siemens AG
13.3.1 Business Overview
13.3.2 Products Offered
13.3.3 Developments, 2011�2012
13.3.4 SWOT Analysis
13.3.5 MnM View
13.4 Eaton Corporation Plc
13.4.1 Business Overview
13.4.2 Products Offered
13.4.3 Developments, 2011�2015
13.4.4 SWOT Analysis
13.4.5 MnM View
13.5 Schneider Electric SE
13.5.1 Business Overview
13.5.2 Products Offered
13.5.3 Developments, 2014�2015
13.5.4 SWOT Analysis
13.5.5 MnM View
13.6 General Electric Company
13.6.1 Business Overview
13.6.2 Products Offered
13.6.3 Developments, 2013
13.6.4 SWOT Analysis
13.6.5 MnM View
13.7 Emerson Electric Co.
13.7.1 Business Overview
13.7.2 Products Offered
13.7.3 Developments, 2012�2013
13.8 Rockwell Automation, Inc.
13.8.1 Business Overview
13.8.2 Products Offered
13.8.3 Developments, 2013�2014
13.9 Fuji Electric Fa Components & Systems Co., Ltd.
13.9.1 Business Overview
13.9.2 Products and Services
13.9.3 Developments, 2014
13.10 WEG SA
13.10.1 Business Overview
13.10.2 Products Offered
13.10.3 Developments, 2011�2015
13.11 Mitsubishi Electrical Corporation
13.11.1 Business Overview
13.11.2 Products and Services
13.11.3 Developments, 2014
13.12 Danfoss A/S
13.12.1 Business Overview
13.12.2 Products Offered
13.12.3 Developments, 2013
13.13 Toshiba International Corporation Ltd.
13.13.1 Business Overview
13.13.2 Products Offered
13.13.3 Developments, 2013�2014
14 Appendix (Page No. - 147)
14.1 Insights of Industry Experts
14.2 Discussion Guide
14.3 Related Reports
List of Tables (71 Tables)
Table 1 Impact of Market Dynamics
Table 2 Combination Starter Market Size, By Type, 2013�2020 (USD Million)
Table 3 Non-Reversing Type Combination Starter Market Size, By Region, 2013�2020 (USD Million)
Table 4 Reversing Type Combination Starter Market Size, By Region, 2013�2020 (USD Million)
Table 5 Combination Starter Market Size, By Rated Power (KW), 2013�2020 (USD Million)
Table 6 Combination Starter With Rated Power Up to 7.5 KW Market Size, 2013�2020 (USD Million)
Table 7 Combination Starter With Rated Power 7.5 to 75 KW, Market Size, 2013�2020 (USD Million)
Table 8 Combination Starter With Rated Power Above 75 KW, Market Size, 2013�2020 (USD Million)
Table 9 Combination Starter Market Size, By Industry, 2013�2020 (USD Million)
Table 10 Oil & Gas Market Size, By Region, 2013�2020 (USD Million)
Table 11 Water & Wastewater Market Size, By Region, 2013�2020 (USD Million)
Table 12 Infrastructure (Residential & Commercial) Market Size, By Region, 2013�2020 (USD Million)
Table 13 Mining Market Size, By Region, 2013�2020 (USD Million)
Table 14 Food & Beverages Market Size, By Region, 2013�2020 (USD Million)
Table 15 Other Industries Market Size, By Region, 2013�2020 (USD Million)
Table 16 Combination Starter Market Size, By Application, 2013�2020 (USD Million)
Table 17 Pumps Market Size, By Region, 2013�2020 (USD Million)
Table 18 Fans Market Size, By Region, 2013�2020 (USD Million)
Table 19 Compressors Market Size, By Region, 2013�2020 (USD Million)
Table 20 Conveyors Market Size, By Region, 2013�2020 (USD Million)
Table 21 Other Applications Market Size, By Region, 2013�2020 (USD Million)
Table 22 Combination Starter Market Size, By Region, 2013�2020 (USD Million)
Table 23 Asia-Pacific: Combination Starter Market Size, By Country, 2013�2020 (USD Million)
Table 24 Asia-Pacific: Combination Starter Market Size, By Type, 2013�2020 (USD Million)
Table 25 Asia-Pacific: Combination Starter Market Size, By Rated Power (KW), 2013�2020 (USD Million)
Table 26 Asia-Pacific: Combination Starter Market Size, By Application, 2013�2020 (USD Million)
Table 27 Asia-Pacific: Combination Starter Market Size, By Industry, 2013�2020 (USD Million)
Table 28 China: Combination Starter Market Size, By Type, 2013�2020 (USD Million)
Table 29 Japan: Combination Starter Market Size, By Type, 2013�2020 (USD Million)
Table 30 India: Combination Starter Market Size, By Type, 2013�2020 (USD Million)
Table 31 Rest of Asia-Pacific: Combination Starter Market Size, By Industry, 2013�2020 (USD Million)
Table 32 Europe: Combination Starter Market Size, By Country, 2013�2020 (USD Million)
Table 33 Europe: Combination Starter Market Size, By Type, 2013�2020 (USD Million)
Table 34 Europe: Combination Starter Market Size, By Rated Power (KW), 2013�2020 (USD Million)
Table 35 Europe: Combination Starter Market Size, By Application, 2013�2020 (USD Million)
Table 36 Europe: Combination Starter Market Size, By Industry, 2013�2020 (USD Million)
Table 37 Germany: By Market Size, By Type, 2013�2020 (USD Million)
Table 38 Russia: By Market Size, By Type, 2013�2020 (USD Million)
Table 39 U.K.: By Market Size, By Type, 2013�2020 (USD Million)
Table 40 France: By Market Size, By Industry, 2013�2020 (USD Million)
Table 41 Rest of Europe: By Market Size, By Industry, 2013�2020 (USD Million)
Table 42 North America: By Market Size, By Country, 2013�2020 (USD Million)
Table 43 North America: By Market Size, By Type, 2013�2020 (USD Million)
Table 44 North America: By Market Size, By Rated Power (KW), 2013�2020 (USD Million)
Table 45 North America: By Market Size, By Application, 2013�2020 (USD Million)
Table 46 North America: By Market Size, By Industry, 2013�2020 (USD Million)
Table 47 U.S.: By Market Size, By Type, 2013�2020 (USD Million)
Table 48 Canada: By Market Size, By Type, 2013�2020 (USD Million)
Table 49 Mexico: By Market Size, By Type, 2013�2020 (USD Million)
Table 50 South America: By Market Size, By Country, 2013�2020 (USD Million)
Table 51 South America: By Market Size, By Type, 2013�2020 (USD Million)
Table 52 South America: By Market Size, By Rated Power (KW), 2013�2020 (USD Million)
Table 53 South America: By Market Size, By Application, 2013�2020 (USD Million)
Table 54 South America: By Market Size, By Industry, 2013�2020 (USD Million)
Table 55 Brazil: By Market Size, By Type, 2013�2020 (USD Million)
Table 56 Argentina: By Market Size, By Type, 2013�2020 (USD Million)
Table 57 Venezuela: By Market Size, By Type, 2013�2020 (USD Million)
Table 58 Rest of South America: By Market Size, By Type, 2013�2020 (USD Million)
Table 59 The Middle East & Africa: By Market Size, By Country, 2013�2020 (USD Million)
Table 60 The Middle East & Africa: By Market Size, By Type, 2013�2020 (USD Million)
Table 61 The Middle East & Africa: By Market Size, By Rated Power (KW), 2013�2020 (USD Million)
Table 62 The Middle East & Africa: By Market Size, By Application, 2013�2020 (USD Million)
Table 63 The Middle East & Africa: By Market Size, By Industry, 2013�2020 (USD Million)
Table 64 Saudi Arabia: Combination Starter Market Size, By Type, 2013�2020 (USD Million)
Table 65 UAE: Combination Starter Market Size, By Type, 2013�2020 (USD Million)
Table 66 South Africa: Combination Starter Market Size, By Type, 2013�2020 (USD Million)
Table 67 Rest of the Middle East & Africa: Combination Starter Market Size, By Type, 2013�2020 (USD Million)
Table 68 New Product Developments, 2011�2015
Table 69 Mergers & Acquisitions, 2011�2015
Table 70 Expansions, 2011�2015
Table 71 Other Developments, 2011�2015
List of Figures (52 Figures)
Figure 1 Markets Covered: Combination Starter Market
Figure 2 Combination Starter Market: Research Design
Figure 3 Market Size Estimation Methodology: Top-Down Approach
Figure 4 Market Size Estimation Methodology: Bottom-Up Approach
Figure 5 Breakdown of Primary Interviews: By Company, Designation, & Region
Figure 6 Market Estimation Approach & Data Triangulation Methodology
Figure 7 Combination Starter Components
Figure 8 Asia-Pacific is Expected to Be the Largest Market During the Forecast Period
Figure 9 Pumps Application Estimated to Dominate the Market in 2015
Figure 10 Oil & Gas & Water & Wastewater Industries are Expected to Account for the Largest Share in the Global Combination Starter Market
Figure 11 Rising Importance of Motor Control & Protection is Expected to Drive the Demand for Combination Starters
Figure 12 The Pumps Application is Expected to Hold the Largest Market Share During the Forecast Period
Figure 13 China to Capture the Largest Share in the Asia-Pacific Combination Starter Market
Figure 14 Non-Reversing Combination Starters to Hold the Largest Market Share
Figure 15 Asia-Pacific Occupied the Largest Share in the Combination Starter Market in 2014
Figure 16 The Oil & Gas Industry Accounted for the Largest Share in the Combination Starter Market in 2014
Figure 17 Asia-Pacific Expected to Be the Largest & Fastest-Growing Market in the Global Combination Starter Market
Figure 18 Combination Starter Market Segmentation By Type, Application, Rated Power, Industry, & Region
Figure 19 the Growing Industrial Pump Market is Driving the Combination Starter Market
Figure 20 Supply Chain Analysis: Major Value is Added During the Manufacturing & Assembly Phase
Figure 21 Porter�s Five Forces Analysis: Combination Starter Market
Figure 22 Non-Reversing Combination Starters to Dominate the Combination Starter Market
Figure 23 Combination Starters With Rated Power 7.5 to 75 KW to Dominate the Market
Figure 24 Application vs. End-User Matrix
Figure 25 Oil & Gas Accounted for the Largest Market Share (Value)
Figure 26 Global Snapshot: Pumps Expected to Dominate the Combination Starter Market During the Forecast Period
Figure 27 Regional Snapshot: Asia-Pacific, North America, and Europe are Major Markets for Combination Starters
Figure 28 China: an Attractive Market for Combination Starters
Figure 29 Asia-Pacific Combination Starter Market Overview (2014)
Figure 30 Europe Combination Starter Market Overview (2014)
Figure 31 Companies Adopted New Product Development and Mergers & Acquisitions as Key Growth Strategies From 2011 to 2015
Figure 32 ABB Held the Largest Share in the Combination Starter Market in 2014
Figure 33 Market Evaluation Framework: New Product Development and Mergers & Acquisitions Fuelled Growth From 2011 to 2015
Figure 34 Battle for Market Share: New Product Development Was the Key Strategy
Figure 35 Regional Revenue Mix of the Top Five Players
Figure 36 ABB Ltd.: Company Snapshot
Figure 37 ABB Ltd: SWOT Analysis
Figure 38 Siemens AG: Company Snapshot
Figure 39 Siemens AG: SWOT Analysis
Figure 40 Eaton Corporation PLC: Company Snapshot
Figure 41 Eaton Corporation PLC: SWOT Analysis
Figure 42 Schneider Electric SE: Company Snapshot
Figure 43 Schneider Electric SE: SWOT Analysis
Figure 44 GE Company: Company Snapshot
Figure 45 GE Company: SWOT Analysis
Figure 46 Emerson Electric Co.: Company Snapshot
Figure 47 Rockwell Automation, Inc.: Company Snapshot
Figure 48 Fuji Electric FA Components & Systems Co., Ltd.: Company Snapshot
Figure 49 WEG SA: Company Snapshot
Figure 50 Mitsubishi Electrical Corp.: Company Snapshot
Figure 51 Danfoss A/S: Company Snapshot
Figure 52 Toshiba: Company Snapshot


Growth opportunities and latent adjacency in Combination Starter Market