Cognitive Computing Market by Component, Deployment Mode, Business Function, Application (IVA and Chatbot and Behavioral Analysis), Technology (Human Computer Interface and Deep Learning), Industry Vertical, and Region - Global Forecast to 2025


Cognitive Computing Market Growth & Trends
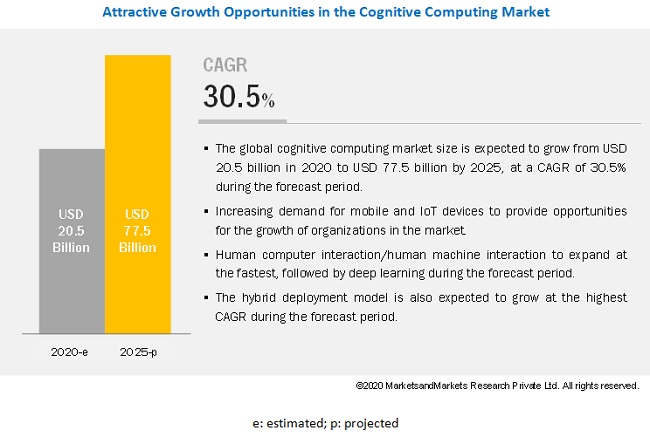
The global Cognitive Computing Market size was valued at USD 20.5 billion in 2020 and is expected to grow at a CAGR of 30.5% from 2020 to 2025. The revenue forecast for 2025 is projected to reach $77.5 billion. The base year for estimation is 2018, and the historical data spans from 2020 to 2025. The major growth factors of the market include continuous evolution in the computing environment: cloud, mobile, and analytics; utilizing cognitive abilities to reduce excess operational costs; and increasing demand for intelligent business processes.
Among business functions, the operations segment to grow at the highest CAGR during the forecast period
The cognitive computing market is segmented by business functions into Human Resources (HR), operations, finance and others (R&D and legal). The operations segment is expected to grow at the highest CAGR during the forecast period. Cognitive computing solutions can enable companies to increase operational efficiencies and reduce costs. Companies are adopting cognitive computing solutions and services as it helps them cater to real time use cases, such as production and supply chain optimization for product enhancement and gaining higher Return on Investments (RoI). The marketing and sales segment is expected to grow with the highest market share during the forecast period. Cognitive capabilities help marketers to adjust their content strategy and keep their subscribers engaged. Cognitive computing powered recommendation engines are broadly being used to suggest personalized content to the customers. Cognitive solutions and services help businesses make effective business decisions through competitive advantage, increased revenue and reduced costs. Numerous companies are implementing cognitive computing solutions and services to enhance operations and achieve the highest employee engagement. Cognitive computing solutions’ implementation assists companies in striking the right balance between operational cost, speed, flexibility, and quality.
Hybrid segment to grow at a rapid pace during the forecast period
The hybrid segment is projected to grow at the highest CAGR during the forecast period. Most vendors in the cognitive computing market offer hybrid-based cognitive solutions to maximize profits and automate the equipment maintenance process, effectively. The adoption of hybrid solutions is expected to grow, due to the benefits, such as easy maintenance of generated data, cost-effectiveness, agility, flexibility, scalability, and effective management of these solutions. Enterprises are adopting hybrid environment as it helps them overcome complexities related to the traditional IT environments. This has enabled the enterprises with an on-premises platform to take the advantage of cloud solutions. For example, AWS has introduced hybrid cloud solutions on their premises. The cloud segment is expected to have the largest market size during the forecast period, due to the large amount of data being generated. Organizations are deploying cloud solutions to store and access this growing data easily.
North America to hold the highest market share during the forecast period
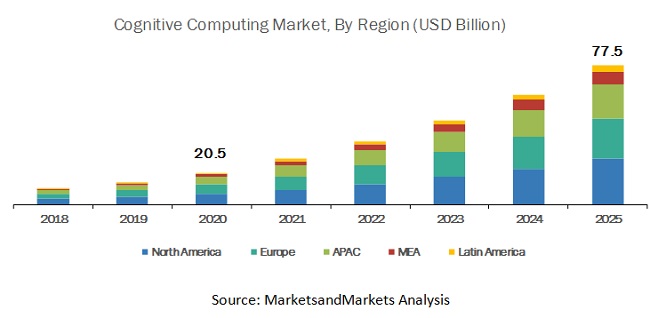
North America is expected to hold the highest share in the global cognitive computing market, while Asia Pacific (APAC) is expected to grow at the highest CAGR during the forecast period. North America is the most significant revenue contributor in the global market. The region is witnessing significant developments in the market. In North America, the high growth rate can be attributed to the increasing usage of internet and startups adopting cognitive computing solutions. Organizations, especially in the US, have started using cognitive computing solutions to analyze huge volumes of data to provide better solutions. Latest technological advancements, such as 5G and IoT have also aided in the boost of cognitive solutions in this region.
Key market players
Major vendors in the global cognitive computing market include Microsoft (US), Google (US), IBM (US), Numenta (US), SAS Institute (US), AWS (US), Enterra Solutions (US), CognitiveScale (US), SparkCognition (US), TCS (India), Expert System (US), Cisco (US), Virtusa (US), Cognitive Software Group (Australia), Red Skios (Spain), Artificial Solutions (Sweden), Acuiti (Australia), Vantage Labs (US), E-Zest (India), and BurstIQ (US). These vendors have adopted various organic and inorganic growth strategies, such as new product launches, partnerships and collaborations, and mergers and acquisitions, to expand their presence in the global market.
AWS was founded in 2006 and is headquartered in Washington, US. The company is a subsidiary of Amazon.com. It provides a diverse range of cloud computing products and services, which are tailored for the customers according to the needs. Amazon’s product portfolio comprises segments, such as compute, storage, database, migration, network and content delivery, developer tools, management tools, media services, Machine Learning (ML), and analytics. The company offers a wide range of products and services to customers present in 190 countries. It offers a wide range of products in the field of analytics, application integration, Augmented Reality (AR) and Virtual Reality (VR), IoT, blockchain, ML, robotics, satellite, quantum technologies, security, and many other fields. Additionally, the solutions segment offers website and web apps, mobile services, backup, storage and archive, financial services, and digital media. The company’s analytics services are purpose-built for a wide range of analytics use cases, such as interactive analysis, big data processing using Apache Spark and Hadoop, data warehousing, real-time analytics, operational analytics, dashboards, and visualizations. The company offers interactive analytics through Amazon Athena, real-time analytics through Amazon Kinesis, operational analytics through Amazon Elasticsearch Service, and dashboard and visualizations through Amazon QuickSight.
In the cognitive computing market, AWS offers ML and AI services, where Amazon SageMaker fully managed service enables developers and data scientists to quickly build, train, and deploy ML models at scale. Amazon Comprehend is a Natural Language Processing (NLP) service that uses ML to find insights and relationships in text without any machine learning experience.
Scope of the Report
|
Report Metric |
Details |
|
Market size available for years |
2018–2025 |
|
Base year considered |
2018 |
|
Forecast period |
2020–2025 |
|
Forecast units |
Billion (USD) |
|
Segments covered |
Component, Business Functions, Applications, Technology, Deployment Mode, Organization Size, Industry Vertical, and Region |
|
Geographies covered |
North America, Europe, APAC, Latin America, and MEA |
|
Companies covered |
Microsoft (US), Teradata (US), IBM (US), SAS (US), Google (US), AWS (US), CognitiveScale (US), SparkCognition (US),TCS (India), Expert System (US), Cisco (US), Virtusa (US), Acuiti (Australia), E-Zest(India), Vantage Labs (US), Red Skios (Spain), BurstIQ (US). |
This research report categorizes the cognitive computing market based on component, business functions, applications, technology, deployment mode, organization size, industry vertical (BFSI, retail and eCommerce, Travel and hospitality, government, IT and telecommunications, healthcare and lifesciences, manufacturing and media and entertainment), and region
By Component, the market is divided into the following segments:
- Platform
-
Service
- Managed Services
- Professional Services
By Technology, the cognitive computing market is divided into the following segments:
- Machine Learning (ML)
-
Human Computer Interaction
- Computer Vision
- Machine Vision
- Robotics
- Natural Language Processing (NLP)
-
Deep Learning
- Prescriptive and Predictive Modeling
- Decision Making
By application, the market is divided into the following segments:
- Automation
- Intelligent Virtual Assistants
- Behavioral Analysis
- Biometrics
- Others (eLearning and smart education and eTherapy)
By deployment mode, the cognitive computing market is divided into the following segments:
- On-premise
- Cloud
- Hybrid
By organization size, the market is divided into the following segments:
- Large Enterprises
- Small and Medium-Sized Enterprises (SMEs)
By business functions, the market is divided into the following segments:
- Human Resources (HR)
- Legal
- Finance
- Marketing and Advertising
By industry vertical, the cognitive computing market is divided into the following segments:
- BFSI
- Retail and eCommerce
- Telecommunication and IT
- Healthcare and Life Sciences
- Manufacturing
- Government and Defense
- Media and Entertainment
- Travel and Hospitality
- Others* (Energy and Utilities, Transportation and Logistics, and Education)
By region, the market is divided into the following segments:
-
North America
- US
- Canada
-
Europe
- UK
- Germany
- France
- Italy
- Rest of Europe*
-
Asia Pacific (APAC)
- China
- Japan
- India
- Rest of APAC*
-
Middle East and Africa (MEA)
- Middle East
- South Africa
-
Latin America
- Brazil
- Mexico
- Argentina
- Rest of Latin America*
Critical questions the report answers
- What are the current trends driving the cognitive computing market?
- In which vertical are most industrial companies deploying cognitive computing solutions?
- Where will recent developments of market vendors take the industry in the mid- to long-term?
- Who are the top vendors in the market, and what is their competitive analysis?
- What are the drivers and challenges faced by vendors in the market?
Frequently Asked Questions (FAQ):
How big is the Cognitive Computing Market?
What is the Cognitive Computing Market growth?
What is Cognitive Computing Market?
What are the top vendors in Cognitive Computing Market?
What are the applications of Cognitive Computing Market?
What are the technologies that impact Cognitive Computing Market industry?
To speak to our analyst for a discussion on the above findings, click Speak to Analyst
 Exclusive indicates content/data unique to MarketsandMarkets and not available with any competitors.
Table of Contents
1 Introduction (Page No. - 22)
1.1 Objectives of the Study
1.2 Market Definition
1.2.1 Inclusions and Exclusions
1.3 Market Scope
1.3.1 Market Segmentation
1.3.2 Regions Covered
1.3.3 Years Considered for the Study
1.4 Currency Considered
1.5 Stakeholders
2 Research Methodology (Page No. - 26)
2.1 Research Data
2.1.1 Secondary Data
2.1.2 Primary Data
2.1.2.1 Breakup of Primary Profiles
2.2 Market Breakup and Data Triangulation
2.2.1 Key Industry Insights
2.3 Market Size Estimation
2.3.1 Top-Down Approach
2.3.2 Bottom-Up Approach
2.4 Market Forecast
2.5 Assumptions for the Study
2.6 Limitations of the Study
3 Executive Summary (Page No. - 35)
4 Premium Insights (Page No. - 40)
4.1 Attractive Market Opportunities in the Cognitive Computing Market
4.2 Market By Region
4.3 Market in North America, By Business Function and Industry Vertical
5 Market Overview and Industry Trends (Page No. - 42)
5.1 Introduction
5.2 Market Dynamics
5.2.1 Drivers
5.2.1.1 Continuous Evolution in the Computing Environment: Cloud, Mobile, and Analytics
5.2.1.2 Rise in Customer Engagement Through Social Media Platforms
5.2.1.3 Increasing Demand for Intelligent Business Processes
5.2.2 Restraints
5.2.2.1 Inability to Recognize Customer Intent and Respond Effectively
5.2.3 Opportunities
5.2.3.1 Utilizing Cognitive Abilities to Reduce Excess Operational Costs
5.2.3.2 Growing Use of Deep Learning Technology in Artificial Intelligence Recommendation Engine Solutions
5.2.4 Challenges
5.2.4.1 Data Management and Regulations
5.3 Use Cases
5.3.1 Use Case: Building an Efficient Healthcare System With Welltok
5.3.2 Use Case: Standardizing Risk, Controls, and Issues Across Its Business Functions With IBM Openpages
5.3.3 Use Case: Enhancing Customer Experience With IBM Watson
5.3.4 Use Case: Improving Lifetime Value of Customers With AI
5.3.5 Use Case: Boosting Customers and Service Agents With AI-Based Cognitive Service Experience System
5.3.6 Use Case: Enhancing Customer Experience With Cognitive Services
5.4 Regulatory Implications
5.4.1 General Data Protection Regulation
5.4.2 United States Securities and Exchange Commission
5.4.3 Comprehensive Capital Analysis and Review
5.4.4 Dodd-Frank Act
5.4.5 Payment Card Industry Data Security Standard
5.4.6 The International Organization for Standardization 27001
5.4.7 California Consumer Privacy Act
5.4.8 Health Insurance Portability and Accountability Act of 1996
5.4.9 Health Information Technology for Economic and Clinical Health Act
5.4.10 European Market Infrastructure Regulation
5.4.11 Basel Committee on Banking Supervision 239 Compliance
5.4.12 Sarbanes-Oxley Act of 2002
5.4.13 Personal Data Protection Act
6 Cognitive Computing Market By Component (Page No. - 54)
6.1 Introduction
6.2 Platform
6.3 Services
6.3.1 Managed Services
6.3.2 Professional Services
7 Cognitive Computing Market By Business Function (Page No. - 59)
7.1 Introduction
7.2 Human Resource
7.3 Operations
7.4 Finance
7.5 Marketing and Sales
7.6 Others
7.6.1 Research and Development
7.6.2 Legal
8 Cognitive Computing Market By Application (Page No. - 66)
8.1 Introduction
8.2 Automation
8.3 Intelligent Virtual Assistants and Chatbots
8.4 Behavioral Analysis
8.5 Biometrics
8.6 Others
9 Cognitive Computing Market By Technology (Page No. - 72)
9.1 Introduction
9.2 Machine Learning
9.3 Human Machine Interface (HMI)/Human Computer Interface (HCI)
9.3.1 Computer Vision
9.3.2 Machine Vision
9.3.3 Robotics
9.4 Natural Language Processing
9.5 Deep Learning
10 Cognitive Computing Market By Deployment Mode (Page No. - 78)
10.1 Introduction
10.2 On-Premises
10.3 Cloud
10.4 Hybrid
11 Cognitive Computing Market By Organization Size (Page No. - 82)
11.1 Introduction
11.2 Small and Medium-Sized Enterprises
11.3 Large Enterprises
12 Cognitive Computing Market By Industry Vertical (Page No. - 86)
12.1 Introduction
12.2 Banking, Financial Services, and Insurance
12.3 Retail and eCommerce
12.4 Travel and Hospitality
12.5 Government
12.6 It and Telecommunications
12.7 Healthcare and Life Sciences
12.8 Manufacturing
12.9 Media and Entertainment
12.10 Others
13 Cognitive Computing Market By Region (Page No. - 97)
13.1 Introduction
13.2 North America
13.2.1 United States
13.2.2 Canada
13.3 Europe
13.3.1 United Kingdom
13.3.2 Germany
13.3.3 France
13.3.4 Italy
13.3.5 Rest of Europe
13.4 Asia Pacific
13.4.1 China
13.4.2 Singapore
13.4.3 India
13.4.4 Australia and New Zealand
13.4.5 Rest of Asia Pacific
13.5 Middle East and Africa
13.5.1 Middle East
13.5.2 Africa
13.6 Latin America
13.6.1 Brazil
13.6.2 Mexico
13.6.3 Argentina
13.6.4 Rest of Latin America
14 Competitive Landscape (Page No. - 154)
14.1 Introduction
14.1.1 Visionaries
14.1.2 Innovators
14.1.3 Dynamic Differentiators
14.1.4 Emerging Companies
15 Company Profiles (Page No. - 156)
15.1 Introduction
15.2 Google
(Business Overview, Solutions and Services Offered, Recent Developments, SWOT Analysis, and Right-To-Win)*
15.3 Microsoft
15.4 IBM
15.5 SAS
15.6 AWS
15.7 Artificial Solutions
15.8 Numenta
15.9 Enterra Solutions
15.10 Cognitivescale
15.11 Sparkcognition
15.12 TCS
15.13 Expert System
15.14 Cisco
15.15 Virtusa
15.16 Cognitive Software Group
15.17 Acuiti
15.18 E-Zest
15.19 Vantage Labs LLC
15.20 Red Skios LTD
15.21 Burstiq
*Details on Business Overview, Solutions and Services Offered, Recent Developments, SWOT Analysis, and Right-To-Win Might Not Be Captured in Case of Unlisted Companies.
16 Appendix (Page No. - 198)
16.1 Discussion Guide
16.2 Knowledge Store: Marketsandmarkets’ Subscription Portal
16.3 Available Customizations
16.4 Related Reports
16.5 Author Details
List of Tables (137 Tables)
Table 1 United States Dollar Exchange Rate, 2016–2018
Table 2 Factor Analysis
Table 3 Global Cognitive Computing Market Size and Growth Rate, 2018–2025 (USD Million, Y-O-Y%)
Table 4 Market Size By Component, 2018–2025 (USD Million)
Table 5 Market Size By Service, 2018–2025 (USD Million)
Table 6 Managed Services: Market Size By Region, 2018–2025 (USD Million)
Table 7 Professional Services: Market Size By Region, 2018–2025 (USD Million)
Table 8 Cognitive Computing Market Size, By Business Function, 2018–2025 (USD Million)
Table 9 Human Resource: Market Size By Region, 2018–2025 (USD Million)
Table 10 Operations: Market Size By Region, 2018–2025 (USD Million)
Table 11 Finance: Market Size By Region, 2018–2025 (USD Million)
Table 12 Marketing and Sales: Market Size By Region, 2018–2025 (USD Million)
Table 13 Others: Market Size By Region, 2018–2025 (USD Million)
Table 14 Cognitive Computing Market Size, By Application, 2018–2025 (USD Million)
Table 15 Automation: Market Size By Region, 2018–2025 (USD Million)
Table 16 Intelligent Virtual Assistants and Chatbots: Market Size By Region, 2018–2025 (USD Million)
Table 17 Behavioral Analysis: Cognitive Computing Market Size By Region, 2018–2025 (USD Million)
Table 18 Biometrics: Market Size By Region, 2018–2025 (USD Million)
Table 19 Others: Market Size By Region, 2018–2025 (USD Million)
Table 20 Cognitive Computing Market Size, By Technol0gy, 2018–2025 (USD Million)
Table 21 Machine Learning: Market Size By Region, 2018–2025 (USD Million)
Table 22 Human Machine Interface: Market Size By Region, 2018–2025 (USD Million)
Table 23 Natural Language Processing: Market Size By Region, 2018–2025 (USD Million)
Table 24 Deep Learning: Market Size By Region, 2018–2025 (USD Million)
Table 25 Cognitive Computing Market Size, By Deployment Mode, 2018–2025 (USD Million)
Table 26 on Premises: Market Size By Region, 2018–2025 (USD Million)
Table 27 Cloud: Market Size By Region, 2018–2025 (USD Million)
Table 28 Hybrid: Market Size By Region, 2018–2025 (USD Million)
Table 29 Market Size By Organization Size, 2018–2025 (USD Million)
Table 30 Small and Medium-Sized Enterprises: Market Size By Region, 2018–2025 (USD Million)
Table 31 Large Enterprises: Market Size By Region, 2018–2025 (USD Million)
Table 32 Cognitive Computing Market Size, By Industry Vertical, 2018–2025 (USD Million)
Table 33 Banking, Financial Services, and Insurance: Cognitive Computing Size, By Region, 2018–2025 (USD Million)
Table 34 Retail and eCommerce: Cognitive Computing, By Region, 2018–2025 (USD Million)
Table 35 Travel and Hospitality: Market By Region, 2018–2025 (USD Million)
Table 36 Government: Market Size By Region, 2018–2025 (USD Million)
Table 37 It and Telecommunications: Market Size By Region, 2018–2025 (USD Million)
Table 38 Healthcare and Life Sciences: Market Size By Region, 2018–2025 (USD Million)
Table 39 Manufacturing: Market Size By Region, 2018–2025 (USD Million)
Table 40 Media and Entertainment: Market Size By Region, 2018–2025 (USD Million)
Table 41 Others: Market Size By Region, 2018–2025 (USD Million)
Table 42 Cognitive Computing Market Size, By Region, 2018–2025 (USD Million)
Table 43 North America: Cognitive Computing, By Component, 2018–2025 (USD Million)
Table 44 North America: Cognitive Computing, By Business Function, 2018–2025 (USD Million)
Table 45 North America: Cognitive Computing Market, By Application, 2018–2025 (USD Million)
Table 46 North America: Market By Technology, 2018–2025 (USD Million)
Table 47 North America: Cognitive Computing, By Service, 2018–2025 (USD Million)
Table 48 North America: Cognitive Computing, By Deployment Mode, 2018–2025 (USD Million)
Table 49 North America: Cognitive Computing, By Organization Size, 2018–2025 (USD Million)
Table 50 North America: Cognitive Computing, By Industry Vertical, 2018–2025 (USD Million)
Table 51 North America: Cognitive Computing, By Country, 2018–2025 (USD Million)
Table 52 United States: Cognitive Computing, By Industry Vertical, 2018–2025 (USD Million)
Table 53 United States: Cognitive Computing, By Technology, 2018–2025 (USD Million)
Table 54 United States: Cognitive Computing, By Business Function, 2018–2025 (USD Million)
Table 55 Canada: Cognitive Computing, By Vertical, 2018–2025 (USD Million)
Table 56 Canada: Cognitive Computing, By Technology, 2018–2025 (USD Million)
Table 57 Canada: Cognitive Computing, By Business Function, 2018–2025 (USD Million)
Table 58 Europe: Cognitive Computing, By Component, 2018–2025 (USD Million)
Table 59 Europe: Cognitive Computing, By Business Function, 2018–2025 (USD Million)
Table 60 Europe: Cognitive Computing, By Technology, 2018–2025 (USD Million)
Table 61 Europe: Cognitive Computing, By Service, 2018–2025 (USD Million)
Table 62 Europe: Cognitive Computing Market Size, By Deployment Mode, 2018–2025 (USD Million)
Table 63 Europe: Cognitive Computing, By Organization Size, 2018–2025 (USD Million)
Table 64 Europe: Cognitive Computing, By Industry Vertical, 2018–2025 (USD Million)
Table 65 Europe: Cognitive Computing Market Size, By Country, 2018–2025 (USD Million)
Table 66 United Kingdom: Cognitive Computing, By Industry Vertical, 2018–2025 (USD Million)
Table 67 United Kingdom: Cognitive Computing, By Technology, 2018–2025 (USD Million)
Table 68 United Kingdom: Cognitive Computing, By Business Function, 2018–2025 (USD Million)
Table 69 Germany: Cognitive Computing, By Industry Vertical, 2018–2025 (USD Million)
Table 70 Germany: Cognitive Computing, By Technology, 2018–2025 (USD Million)
Table 71 Germany: Cognitive Computing, By Business Function, 2018–2025 (USD Million)
Table 72 France: Cognitive Computing, By Industry Vertical, 2018–2025 (USD Million)
Table 73 France: Cognitive Computing, By Technology, 2018–2025 (USD Million)
Table 74 France: Cognitive Computing, By Business Function, 2018–2025 (USD Million)
Table 75 Italy: Cognitive Computing Market Size, By Industry Vertical, 2018–2025 (USD Million)
Table 76 Italy: Market Size By Technology, 2018–2025 (USD Million)
Table 77 Italy: Market Size By Business Function, 2018–2025 (USD Million)
Table 78 Rest of Europe: Cognitive Computing Market Size, By Industry Vertical, 2018–2025 (USD Million)
Table 79 Rest of Europe: Market Size By Technology, 2018–2025 (USD Million)
Table 80 Rest of Europe: Market Size By Business Function, 2018–2025 (USD Million)
Table 81 Asia Pacific: Cognitive Computing Market Size, By Component, 2018–2025 (USD Million)
Table 82 Asia Pacific: Market Size By Country, 2018–2025 (USD Million)
Table 83 Asia Pacific: Market Size By Service, 2018–2025 (USD Million)
Table 84 Asia Pacific: Market Size By Deployment Mode, 2018–2025 (USD Million)
Table 85 Asia Pacific: Market Size By Technology, 2018–2025 (USD Million)
Table 86 Asia Pacific: Market Size By Organization Size, 2018–2025 (USD Million)
Table 87 Asia Pacific: Market Size By Business Function, 2018–2025 (USD Million)
Table 88 Asia Pacific: Market Size By Industry Vertical, 2018-2025 (USD Million)
Table 89 China: Cognitive Computing Market Size, By Industry Vertical, 2018-2025 (USD Million)
Table 90 China: Market Size By Technology, 2018–2025 (USD Million)
Table 91 China: Market Size By Business Function, 2018–2025 (USD Million)
Table 92 Singapore: Cognitive Computing Market Size, By Industry Vertical, 2018-2025 (USD Million)
Table 93 Singapore: Market Size By Technology, 2018–2025 (USD Million)
Table 94 Singapore: Market Size By Application, 2018–2025 (USD Million)
Table 95 India: Cognitive Computing Market Size, By Industry Vertical, 2018-2025 (USD Million)
Table 96 India: Market Size By Technology, 2018–2025 (USD Million)
Table 97 India: Market Size By Application, 2018–2025 (USD Million)
Table 98 Australia and New Zealand: Cognitive Computing Market Size, By Industry Vertical, 2018-2025 (USD Million)
Table 99 Australia and New Zealand: Market Size By Technology, 2018–2025 (USD Million)
Table 100 Australia and New Zealand: Market Size By Business Function, 2018–2025 (USD Million)
Table 101 Rest of Asia Pacific: Cognitive Computing Market Size, By Industry Vertical, 2018-2025 (USD Million)
Table 102 Rest of Asia Pacific: Market Size By Technology, 2018–2025 (USD Million)
Table 103 Rest of Asia Pacific: Market Size By Application, 2018–2025 (USD Million)
Table 104 Middle East and Africa: Cognitive Computing Market Size, By Component, 2018–2025 (USD Million)
Table 105 Middle East and Africa: Market Size By Service, 2018–2025 (USD Million)
Table 106 Middle East and Africa: Market Size By Business Function, 2018–2025 (USD Million)
Table 107 Middle East and Africa: Market Size By Technology, 2018–2025 (USD Million)
Table 108 Middle East and Africa: Market Size By Deployment Mode, 2018–2025 (USD Million)
Table 109 Middle East and Africa: Market Size By Organization Size, 2018–2025 (USD Million)
Table 110 Middle East and Africa: Market Size By Industry Vertical, 2018–2025 (USD Million)
Table 111 Middle East and Africa: Market Size By Country, 2018–2025 (USD Million)
Table 112 Middle East: Cognitive Computing Market Size, By Industry Vertical, 2018–2025 (USD Million)
Table 113 Middle East: Market Size By Technology, 2018–2025 (USD Million)
Table 114 Middle East: Market Size By Application, 2018–2025 (USD Million)
Table 115 Africa: Cognitive Computing Market Size, By Industry Vertical, 2018–2025 (USD Million)
Table 116 Africa: Market Size By Technology, 2018–2025 (USD Million)
Table 117 Africa: Market Size By Application, 2018–2025 (USD Million)
Table 118 Latin America: Cognitive Computing Market Size, By Component, 2018–2025 (USD Million)
Table 119 Latin America: Market Size By Service, 2018–2025 (USD Million)
Table 120 Latin America: Market Size By Deployment Mode, 2018–2025 (USD Million)
Table 121 Latin America: Market Size By Business Function, 2018–2025 (USD Million)
Table 122 Latin America: Market Size By Technology, 2018–2025 (USD Million)
Table 123 Latin America: Market Size By Organization Size, 2018–2025 (USD Million)
Table 124 Latin America: Market Size By Industry Vertical, 2018–2025 (USD Million)
Table 125 Latin America: Market Size By Country, 2018–2025 (USD Million)
Table 126 Brazil: Cognitive Computing Market Size, By Industry Vertical, 2018–2025 (USD Million)
Table 127 Brazil: Market Size By Technology, 2018–2025 (USD Million)
Table 128 Brazil: Market Size By Business Function, 2018–2025 (USD Million)
Table 129 Mexico: Cognitive Computing Market Size, By Industry Vertical, 2018–2025 (USD Million)
Table 130 Mexico: Market Size By Technology, 2018–2025 (USD Million)
Table 131 Mexico: Market Size By Application, 2018–2025 (USD Million)
Table 132 Argentina: Cognitive Computing Market Size, By Industry Vertical, 2018–2025 (USD Million)
Table 133 Argentina: Market Size By Technology, 2018–2025 (USD Million)
Table 134 Argentina: Market Size By Business Function, 2018–2025 (USD Million)
Table 135 Rest of Latin America: Cognitive Computing Market Size, By Industry Vertical, 2018–2025 (USD Million)
Table 136 Rest of Latin America: Market Size By Technology, 2018–2025 (USD Million)
Table 137 Rest of Latin America: Market Size By Business Function, 2018–2025 (USD Million)
List of Figures (43 Figures)
Figure 1 Cognitive Computing Market: Research Design
Figure 2 Market Size Estimation Methodology: Approach 1 (Supply Side): Revenue of Solutions/Services of the Cognitive Computing Market
Figure 3 Market Size Estimation Methodology: Approach 1 Bottom-Up (Supply Side): Collective Revenue of All Solutions/Services of the Cognitive Computing Market
Figure 4 Market Size Estimation Methodology: Approach 2 Top-Down (Demand Side): Share of Cognitive Computing Through the Overall Cognitive Computing Spending
Figure 5 Platform Segment to Hold A Larger Market Size in 2020
Figure 6 Marketing and Sales Segment to Hold the Highest Market Share in 2020
Figure 7 Cloud Segment to Hold the Highest Market Share in 2020
Figure 8 Large Enterprises Segment to Hold A Higher Market Share in 2020
Figure 9 Cognitive Computing Market Snapshot, By Industry Vertical
Figure 10 Market Snapshot, By Region
Figure 11 Enterprises Continuous Evolution in the Computing Environment: Cloud, Mobile, and Analytics, Coupled With Utilizing Cognitive Abilities to Reduce Excess Operational Costs, to Be the Key Factors Driving the Overall Growth of the Market
Figure 12 North America to Hold the Highest Market Share in 2020
Figure 13 Marketing and Sales Segment and Banking, Financial Services and Insurance Industry Vertical Accounted for the Highest Shares in the Cognitive Computing Market in 2020
Figure 14 Cognitive Computing Market: Drivers, Restraints, Opportunities, and Challenges
Figure 15 Services Segment to Grow at A Higher CAGR During the Forecast Period
Figure 16 Managed Services Segment to Grow at A Higher CAGR During the Forecast Period
Figure 17 Operations Segment to Witness the Highest CAGR During the Forecast Period
Figure 18 Behavioral Analysis Segment to Witness the Highest CAGR During the Forecast Period
Figure 19 Human Computer Interface Segment to Witness the Highest CAGR During the Forecast Period
Figure 20 Hybrid Segment to Witness the Highest CAGR During the Forecast Period
Figure 21 Small and Medium-Sized Enterprises Segment to Grow at A Higher CAGR During the Forecast Period
Figure 22 Healthcare and Life Sciences Industry Vertical to Register the Highest CAGR During the Forecast Period
Figure 23 Asia Pacific to Hold the Highest CAGR During the Forecast Period
Figure 24 India to Account for the Highest CAGR During the Forecast Period
Figure 25 Asia Pacific to Account for the Highest CAGR During the Forecast Period
Figure 26 North America: Market Snapshot
Figure 27 Asia Pacific: Market Snapshot
Figure 28 Cognitive Computing Market, Competitive Leadership Mapping, 2020
Figure 29 Google: Company Snapshot
Figure 30 SWOT Analysis: Google
Figure 31 Microsoft: Company Snapshot
Figure 32 SWOT Analysis: Microsoft
Figure 33 IBM: Company Snapshot
Figure 34 SWOT Analysis: IBM
Figure 35 SAS: Company Snapshot
Figure 36 SWOT Analysis: SAS
Figure 37 AWS: Company Snapshot
Figure 38 SWOT Analysis: AWS
Figure 39 TCS: Company Snapshot
Figure 40 Expert System: Company Snapshot
Figure 41 Cisco: Company Snapshot
Figure 42 SWOT Analysis: Cisco
Figure 43 Virtusa: Company Snapshot
The research study for cognitive computing market involved the use of extensive secondary sources, directories, as well as several journals (Journal of Management Information System, The International Journal of Data Science and Analytics, and International Journal of Business Analytics) and publications Cognitive Computing Consortium and International Journal of Science, Engineering and Technology Research (IJSETR, and International Conference on Big Data) to identify and collect the information useful for the comprehensive market research study on the cognitive computing market. The primary sources were mainly industry experts from the core and related industries, preferred cognitive computing provider, third-party service providers, consulting service providers, end users, and other commercial enterprises. In-depth interviews were conducted with various primary respondents, including key industry participants and subject-matter experts, to obtain and verify critical qualitative and quantitative information, as well as assess the prospects.
Secondary Research
The market size of companies globally offering cognitive computing solutions and services was arrived at based on the secondary data available through paid and unpaid sources. Further, by analyzing the product portfolios of the major companies and rating companies based on their performance and quality. In the secondary research process, various sources were referred to, for identifying and collecting information for this study. The secondary sources included annual reports, press releases, and investor presentations of companies; white papers, journals, and certified publications; and articles from recognized authors, directories, and paid databases. The data was also collected from secondary sources, such as IEEE Journals and magazines, and Journal/ forums for Machine Learning (ML). Secondary research was mainly used to obtain key information about the industry’s value chain and supply chain to identify the key players by various solutions, services, market classifications, and segmentations according to offerings of the major players and industry trends related to solutions, applications, verticals, and regions, and key developments from both market- and technology-oriented perspectives.
Primary Research
In the primary research process, various primary sources from both supply and demand sides were interviewed to obtain qualitative and quantitative information of the market. The primary sources from the supply side included various industry experts, such as Chief X Officers (CXOs), Vice Presidents (VPs), directors, from business development, marketing, product development/innovation teams, and related key executives from cognitive computing solution vendors, System Integrators (Sis), professional service providers, industry associations, and analytics consultants and key opinion leaders. Primary interviews were conducted to gather insights, such as market statistics, data of revenue collected from the solutions and services, market breakdowns, market size estimations, market forecasting, and data triangulation. Primary research also helped in understanding the various trends related to technology, application, deployment, and region. Stakeholders from demand side, such as Chief Information Officers (CIOs), Chief Technology Officers (CTOs), and Chief Strategy Officers (CSOs), and installation teams of the governments/end users who are using cognitive computing solutions were interviewed to understand the buyer’s perspective on the suppliers, products, service providers, and their current usage of cognitive computing solutions which would affect the overall market.
The following is the breakup of primary profiles:
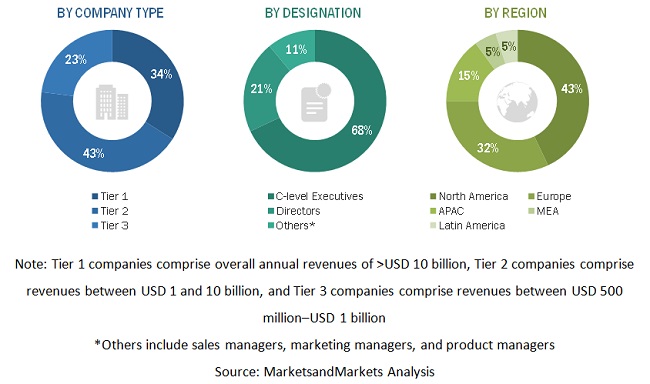
To know about the assumptions considered for the study, download the pdf brochure
Market Size Estimation
Multiple approaches were adopted for the estimation and forecasting of the cognitive computing market. The first approach involves the estimation of the market size by summation of companies’ revenue generated through the sale of solutions and services.
- The key players in the market were identified through extensive secondary research.
- The market size, in terms of value, was determined through primary and secondary research processes.
- All percentage, shares split, and breakups were determined using secondary sources and verified through primary sources.
Data Triangulation
After arriving at the overall market size using the market size estimation processes as explained above, the market was split into several segments and subsegments. To complete the overall market engineering process and arrive at the exact statistics of each market segment and subsegment, data triangulation and market breakup procedures were employed, wherever applicable. The overall market size was then used in the top-down procedure to estimate the size of other individual markets via percentage splits of the market segmentation.
Report Objectives
- To analyze the market based on components, business functions, deployment model, organization size, technology, application, industry verticals, and regions
- To define, segment, and project the global market size for Cognitive computing
- To understand the structure of the Cognitive computing market by identifying its various subsegments
- To provide detailed information about the key factors influencing the growth of the market (drivers, restraints, opportunities, and industry-specific challenges)
- To analyze the micromarkets concerning individual growth trends, prospects, and their contribution to the overall market
- To project the size of the market and its submarkets, in terms of value, for the five (North America, Europe, Asia Pacific, Middle East and Africa, and Latin America) regions (along with their respective key countries)
- To profile key players and comprehensively analyze their core competencies
- To understand the competitive landscape and identify significant growth strategies adopted by players across key regions
- To analyze competitive developments, such as expansions and fundings, new product launches, mergers and acquisitions, strategic partnerships and agreements in the Cognitive computing market
Available customizations
With the given market data, MarketsandMarkets offers customizations as per the company’s specific needs. The following customization options are available for the report:
Product analysis
- Product matrix provides a detailed comparison of the product portfolio of each company
Geographic analysis
- Further breakup of the North American cognitive computing market
- Further breakup of the European market
- Further breakup of the APAC market
- Further breakup of the Latin American market
- Further breakup of the MEA market
Company information
- Detailed analysis and profiling of additional market players up to 5


Growth opportunities and latent adjacency in Cognitive Computing Market
How growth of Cognitive Computing Market impacted by Mobile and Analytics?