Chemical Licensing Market by Type (C1 Derivatives, C2 Derivatives, C3 Derivatives, C4 Derivatives) End-Use Industry (Oil & Gas, Chemical), and Region (North America, Europe, Asia-Pacific, Middle East & Africa, South America) - Global Forecast to 2022


[123 Pages Report] chemical licensing market was valued at USD 10.18 Billion in 2016 and is projected to reach USD 13.81 Billion by 2022, at a CAGR of 5.2% from 2017 to 2022. The base year considered for the study is 2016, while the forecast period is from 2017 to 2022.
Objectives of the Study
- To define, segment, and forecast the chemical licensing market on the basis of type, end-use industry, and region
- To analyze the market segmentation and project the market size, in terms of value, for key regions such as North America, Europe, Asia Pacific, South America, and the Middle East & Africa as well as key countries in each of these regions
- To provide detailed information regarding major factors, such as drivers, restraints, opportunities, and challenges, influencing the growth of the chemical licensing market
- To analyze competitive developments such as contracts & agreements, mergers & acquisitions, and new technology developments in the chemical licensing market
- To strategically profile key players in the chemical licensing market
Both, the top-down and bottom-up approaches were used to estimate and validate the size of the chemical licensing market, and to determine the size of the various other dependent submarkets. The research study involved the extensive use of secondary sources, directories, and databases, such as D&B Hoovers, Bloomberg, Chemical Weekly, Factiva, and other government and private websites to identify and collect information useful for a technical, market-oriented, and commercial study of the chemical licensing market.
To know about the assumptions considered for the study, download the pdf brochure
Key players operating in the chemical licensing market include Johnson Matthey (UK), Mitsubishi Chemical Corporation (Japan), Sumitomo (Japan), ExxonMobil (US), and Shell (Netherlands).
Key Target Audience
- Chemical Licensing Providers
- Technologies Suppliers
- End-Use Industries
- Government & Regional Agencies, Research Organizations, and Investment Research Firms
Scope of the Report
This research report categorizes the chemical licensing market on the basis of type, end-use industry, and region.
On the Basis of Type
- C1 derivatives
- C2 derivatives
- C3 derivatives
- C4 derivatives
On the Basis of End User
- Oil & Gas
- Chemical
On the Basis of Region:
- North America
- Europe
- Asia Pacific
- South America
- Middle East & Africa
The market is further analyzed for key countries in each of these regions.
Available Customizations
Along with the market data, MarketsandMarkets offers customizations according to a company�s specific needs. The following customization options are available for the report:
Geographic Analysis
- Further breakdown of a region with respect to major countries
Company Information
- Detailed analysis and profiles of additional market players
Product Analysis
- Product Matrix, which provides a detailed comparison of the product portfolio of each company
The chemical licensing market is projected to grow from USD 10.72 Billion in 2017 to USD 13.81 Billion by 2022, at a CAGR of 5.2% during the forecast period. Chemical licensing is a branch of intellectual property licensing with the help of which industrial end users can own the rights to use a particular chemical technology. The chemical licensing market includes the licensing of the technology used in the manufacturing of C1 to C4 derivatives, as well as some aromatic derivatives. Technology licensing is highly growing in the downstream industry. The falling crude oil prices and increasing demand for downstream chemicals are boosting the demand for various technologies. The increasing population, expanding manufacturing sector, and rising regulatory requirements in the chemical industry are key factors projected to drive the growth of the chemical licensing market. The increasing demand for different carbon derivatives and the introduction of efficient technologies for the production of these derivatives are other factors boosting the chemical licensing market.
Based on the type of carbon derivatives manufactured by licensed technologies, the chemical licensing market is segmented into C1 derivatives, C2 derivatives, C3 derivatives, C4 derivatives, and other derivatives. The C2 derivatives segment is projected to be the largest segment in the chemical licensing market. Polyethylene and EDC-PVC manufacturing technologies are in high demand in the market; this demand is driving the growth of the C2 derivatives segment of the chemical licensing market.
Based on end-use industry, the chemical licensing market has been segmented into oil & gas, chemical, and agrochemical. Oil & gas is the largest end-use industry of the chemical licensing market. The continuous innovation in the oil & gas industry due to the increasing demand is one of the key factors driving the growth of the chemical licensing market.
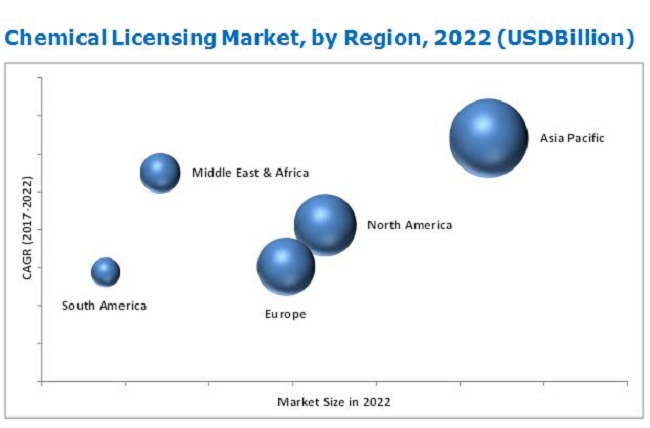
Asia Pacific accounted for the largest share of the chemical licensing market in 2017. This large share can be attributed to the increased demand for chemical licensing in emerging countries, such as India, China, Indonesia, and Thailand. The penetration of the chemical licensing in the oil & gas end-use industry is expected to grow at a higher CAGR in Asia-Pacific due to the high refinery capacities of China, India, South Korea, and Japan and the need for advanced sustainable and eco-friendly chemical production technologies.
The high cost of chemical manufacturing technologies is acting as a restraint to the growth of the chemical licensing market. Key companies profiled in the chemical licensing market research report include Johnson Matthey (UK), Mitsubishi Chemical Corporation (Japan), Sumitomo (Japan), ExxonMobil (US), and Shell (Netherlands). Companies have followed strategies such as mergers & acquisitions, contracts & agreements, and new technology developments to enhance their market share and widen their distribution network. These companies are also engaged in research & development activities to develop new technologies for the production process of hydrocarbons and its derivatives, thereby strengthening their foothold in the chemical licensing market. In September 2017, Mitsubishi Chemical Corporation entered into an agreement with Air Liquide Engineering & Construction to offer licenses for MCC's BTcB technology and Air Liquide E&C�s butadiene extraction technology to customers. Customers can use these technologies to manufacture butadiene through normal butene, substituting the conventional route through naphtha cracking.
To speak to our analyst for a discussion on the above findings, click Speak to Analyst
 Exclusive indicates content/data unique to MarketsandMarkets and not available with any competitors.
Table of Contents
1 Introduction (Page No. - 14)
1.1 Objectives of the Study
1.2 Market Definition
1.3 Market Scope
1.3.1 Years Considered for the Study
1.4 Currency
1.5 Limitations
1.6 Stakeholders
2 Research Methodology (Page No. - 17)
2.1 Research Data
2.1.1 Secondary Data
2.1.1.1 Key Data From Secondary Sources
2.1.2 Primary Data
2.1.2.1 Key Data From Primary Sources
2.1.2.2 Key Industry Insights
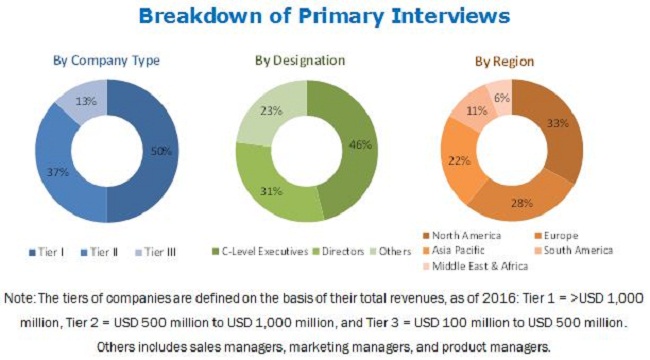
2.1.2.3 Breakdown of Primary Interviews
2.2 Market Size Estimation
2.2.1 Bottom-Up Approach
2.2.2 Top-Down Approach
2.3 Data Triangulation
2.4 Research Assumptions
3 Executive Summary (Page No. - 25)
4 Premium Insights (Page No. - 29)
4.1 Attractive Opportunities in the Chemical Licensing Market
5 Market Overview (Page No. - 31)
5.1 Introduction
5.1.1 Drivers
5.1.1.1 Increasing Demand for Petrochemicals in APAC
5.1.1.2 Stringent Environmental Regulations
5.1.1.3 Cost Optimization Strategies Implemented By Refiners
5.1.2 Restraints
5.1.2.1 In-House Technology Development By End Users
5.1.3 Opportunities
5.1.3.1 Increasing Refinery Capacities
5.1.3.2 Increasing Use of New Technologies for Sustainable Manufacturing
5.1.4 Challenges
5.1.4.1 Cost Optimization and High Licensing Cost
6 Industry Trends (Page No. - 34)
6.1 Porter�s Five Forces Analysis
6.1.1 Bargaining Power of Suppliers
6.1.2 Threat of New Entrants
6.1.3 Threat of Substitutes
6.1.4 Bargaining Power of Buyers
6.1.5 Intensity of Competitive Rivalry
7 Chemical Licensing Market, By Type (Page No. - 37)
7.1 Introduction
7.2 C1 Derivatives
7.2.1 Dimethyl Ether (DME)
7.2.2 Dimethylformamide (DMF)
7.2.3 Formaldehyde
7.2.4 Methanol
7.2.5 Methylamine
7.3 C2 Derivatives
7.3.1 Polymerization
7.3.2 Chlorination
7.3.3 Oxidation
7.4 C3 Derivatives
7.4.1 Polymerization
7.4.2 Ammoxidation
7.4.3 Oxidation
7.4.4 Esterification
7.5 C4 Derivatives
7.5.1 Butanediol
7.5.2 Maleic Anhydride
7.5.3 Polytetramethylene Ether Glycol
7.6 Other Derivatives
7.6.1 Purified Terephthalic Acid
7.6.2 Polybutylene Terephthalate
7.6.3 Bisphenol A
8 Chemical Licensing Market, By End�Use Industry (Page No. - 49)
8.1 Introduction
8.2 Oil & Gas
8.3 Chemical
8.4 Others
9 Chemical Licensing Market, By Region (Page No. - 54)
9.1 Introduction
9.2 North America
9.2.1 US
9.2.2 Canada
9.2.3 Mexico
9.3 APAC
9.3.1 China
9.3.2 India
9.3.3 Japan
9.3.4 South Korea
9.3.5 Indonesia
9.3.6 Malaysia
9.3.7 Australia & New Zealand
9.4 Europe
9.4.1 Germany
9.4.2 France
9.4.3 Russia
9.4.4 UK
9.4.5 Italy
9.4.6 Spain
9.5 MEA
9.5.1 Saudi Arabia
9.5.2 South Africa
9.6 South America
9.6.1 Brazil
9.6.2 Argentina
10 Competitive Landscape (Page No. - 89)
10.1 Introduction
10.1.1 Agreement & Contract
10.1.2 New Technology Development
10.1.3 Merger & Acquisition
10.2 Market Ranking
10.2.1 Introduction
10.2.2 Market Ranking of Key Players
11 Company Profiles (Page No. - 94)
(Overview, Financial*, Products & Services, Strategy, and Developments)
11.1 Shell Global Solutions
11.2 Exxon Mobil Corporation
11.3 Chevron Phillips Chemical Company
11.4 Sumitomo Chemical
11.5 Mitsubishi Chemical Corporation
11.6 Johnson Matthey
11.7 Mitsui Chemicals, Inc.
11.8 Huntsman Corporation
11.9 Eastman Chemical Company
11.10 Nova Chemicals Corporation
*Details Might Not Be Captured in Case of Unlisted Companies
12 Appendix (Page No. - 115)
12.1 Insights From Industry Experts
12.2 Discussion Guide
12.3 Knowledge Store: Marketsandmarkets Subscription Portal
12.4 Introducing RT: Real-Time Market Intelligence
12.5 Available Customizations
12.6 Related Reports
12.7 Author Details
List of Tables (69 Tables)
Table 1 Global Market Size, By Type, 2015�2022 (USD Million)
Table 2 Market Size for C1 Derivatives, By Region, 2015�2022 (USD Million)
Table 3 Market Size for C2 Derivatives, By Region, 2015�2022 (USD Million)
Table 4 Market Size for C3 Derivatives, By Region, 2015�2022 (USD Million)
Table 5 Market Size for C4 Derivatives, By Region, 2015�2022 (USD Million)
Table 6 Market Size for Other Derivatives, By Region, 2015�2022 (USD Million)
Table 7 Market Size, By End-Use Industry, 2015�2022 (USD Million)
Table 8 Market Size in Oil & Gas Industry, By Region, 2015�2022 (USD Million)
Table 9 Market Size in Chemical Industry, By Region, 2015�2022 (USD Million)
Table 10 Market Size in Other End-Use Industries, By Region, 2015�2022 (USD Million)
Table 11 Market Size, By Region, 2015�2022 (USD Million)
Table 12 North America: Market Size, By Country, 2015�2022 (USD Million)
Table 13 North America: Market Size, By Type, 2015�2022 (USD Million)
Table 14 North America: Market Size, By End-Use Industry, 2015�2022 (USD Million)
Table 15 US: Market Size, By Type, 2015�2022 (USD Million)
Table 16 US: Market Size, By End-Use Industry, 2015�2022 (USD Million)
Table 17 Canada: Market Size, By Type, 2015�2022 (USD Million)
Table 18 Canada: Market Size, By End-Use Industry, 2015�2022 (USD Million)
Table 19 Mexico: Market Size, By Type, 2015�2022 (USD Million)
Table 20 Mexico: Market Size, By End-Use Industry, 2015�2022 (USD Million)
Table 21 APAC: Market Size, By Country, 2015�2022 (USD Million)
Table 22 APAC: Market Size, By Type, 2015�2022 (USD Million)
Table 23 APAC: Market Size, By End-Use Industry, 2015�2022 (USD Million)
Table 24 China: Market Size, By Type, 2015�2022 (USD Million)
Table 25 China: Market Size, By End-Use Industry, 2015�2022 (USD Million)
Table 26 India: Market Size, By Type, 2015�2022 (USD Million)
Table 27 India: Market Size, By End-Use Industry, 2015�2022 (USD Million)
Table 28 Japan: Market Size, By Type, 2015�2022 (USD Million)
Table 29 Japan: Market Size, By End-Use Industry, 2015�2022 (USD Million)
Table 30 South Korea: Market Size, By Type, 2015�2022 (USD Million)
Table 31 South Korea: Market Size, By End-Use Industry, 2015�2022 (USD Million)
Table 32 Indonesia: Market Size, By Type, 2015�2022 (USD Million)
Table 33 Indonesia: Market Size, By End-Use Industry, 2015�2022 (USD Million)
Table 34 Malaysia: Market Size, By Type, 2015�2022 (USD Million)
Table 35 Malaysia: Market Size, By End-Use Industry, 2015�2022 (USD Million)
Table 36 Australia & New Zealand: Market Size, By Type, 2015�2022 (USD Million)
Table 37 Australia & New Zealand: Market Size, By End-Use Industry, 2015�2022 (USD Million)
Table 38 Europe: Market Size, By Country, 2015�2022 (USD Million)
Table 39 Europe: Market Size, By Type, 2015�2022 (USD Million)
Table 40 Europe: Market Size, By End-Use Industry, 2015�2022 (USD Million)
Table 41 Germany: Market Size, By Type, 2015�2022 (USD Million)
Table 42 Germany: Market Size, By End-Use Industry, 2015�2022 (USD Million)
Table 43 France: Market Size, By Type, 2015�2022 (USD Million)
Table 44 France: Market Size, By End-Use Industry, 2015�2022 (USD Million)
Table 45 Russia: Market Size, By Type, 2015�2022 (USD Million)
Table 46 Russia: Market Size, By End-Use Industry, 2015�2022 (USD Million)
Table 47 UK: Market Size, By Type, 2015�2022 (USD Million)
Table 48 UK: Market Size, By End-Use Industry, 2015�2022 (USD Million)
Table 49 Italy: Market Size, By Type, 2015�2022 (USD Million)
Table 50 Italy: Market Size, By End-Use Industry, 2015�2022 (USD Million)
Table 51 Spain: Market Size, By Type, 2015�2022 (USD Million)
Table 52 Spain: Market Size, By End-Use Industry, 2015�2022 (USD Million)
Table 53 MEA: Market Size, By Country, 2015�2022 (USD Million)
Table 54 MEA: Market Size, By Type, 2015�2022 (USD Million)
Table 55 MEA: Market Size, By End-Use Industry, 2015�2022 (USD Million)
Table 56 Saudi Arabia: Market Size, By Type, 2015�2022 (USD Million)
Table 57 Saudi Arabia: Market Size, By End-Use Industry, 2015�2022 (USD Million)
Table 58 South Africa: Market Size, By Type, 2015�2022 (USD Million)
Table 59 South Africa: Market Size, By End-Use Industry, 2015�2022 (USD Million)
Table 60 South America: Market Size, By Country, 2015�2022 (USD Million)
Table 61 South America: Market Size, By Type, 2015�2022 (USD Million)
Table 62 South America: Market Size, By End-Use Industry, 2015�2022 (USD Million)
Table 63 Brazil: Market Size, By Type, 2015�2022 (USD Million)
Table 64 Brazil: Market Size, By End-Use Industry, 2015�2022 (USD Million)
Table 65 Argentina: Market Size, By Type, 2015�2022 (USD Million)
Table 66 Argentina: Market Size, By End-Use Industry, 2015�2022 (USD Million)
Table 67 Agreement & Contract, 2014�2017
Table 68 New Technology Development, 2014�2017
Table 69 Merger & Acquisition, 2014�2017
List of Figures (40 Figures)
Figure 1 Chemical Licensing Market: Research Design
Figure 2 Market Size Estimation Methodology: Bottom-Up Approach
Figure 3 Market Size Estimation Methodology: Top-Down Approach
Figure 4 Chemical Licensing Market: Data Triangulation
Figure 5 C2 Derivatives to Lead the Chemical Licensing Market
Figure 6 Oil & Gas to Be the Leading End-Use Industry of the Chemical Licensing Market
Figure 7 APAC to Be the Leading Chemical Licensing Market
Figure 8 APAC and North America to Drive Demand for Chemical Licensing
Figure 9 C2 Derivatives Segment Led the Chemical Licensing Market in 2016
Figure 10 China Lea the APAC Chemical Licensing Market
Figure 11 Increasing Demand for Petrochemicals and Stringent Regulations to Drive the Market
Figure 12 Porter�s Five Forces Analysis
Figure 13 C2 Derivatives Segment Lead the Market in 2016 (USD Million)
Figure 14 MEA to Register the Highest CAGR for the C1 Derivatives Segment Between 2017 and 2022
Figure 15 APAC to Register the Highest CAGR for the C2 Derivatives Segment Between 2017 and 2022
Figure 16 APAC to Register the Highest CAGR for the C3 Derivatives Segment Between 2017 and 2022
Figure 17 APAC to Register the Highest CAGR for the C4 Derivatives Segment Between 2017 and 2022
Figure 18 APAC to Register the Highest CAGR for Other Derivatives Between 2017 and 2022
Figure 19 APAC to Account for the Largest Share of the Market in the Oil & Gas Industry
Figure 20 APAC to Be the Largest Market in Chemical Industry During the Forecast Period
Figure 21 APAC to Register the Highest CAGR in Other Industries During the Forecast Period
Figure 22 India to Record the Highest CAGR in the Market Between 2017 and 2022
Figure 23 Oil & Gas Segment to Be Largest End-Use Industry in North America
Figure 24 India to Witness the Highest CAGR in the APAC Market (2017�2022)
Figure 25 Market to Witness Highest-Growth in the Oil & Gas Industry in the Mea
Figure 26 Companies Adopted Agreement & Contract as the Key Growth Strategy Between 2014 and 2017
Figure 27 Ranking of Chemical Licensing Providers, 2016
Figure 28 Shell Global Solutions: Company Snapshot
Figure 29 Exxon Mobil Corporation: Company Snapshot
Figure 30 Exxon Mobil Corporation: SWOT Analysis
Figure 31 Chevron Phillips Chemical Company: Company Snapshot
Figure 32 Chevron Phillips Chemical Company: SWOT Analysis
Figure 33 Sumitomo Chemical: Company Snapshot
Figure 34 Sumitomo Chemical: SWOT Analysis
Figure 35 Mitsubishi Chemical Corporation: SWOT Analysis
Figure 36 Johnson Matthey: Company Snapshot
Figure 37 Mitsui Chemicals, Inc.: Company Snapshot
Figure 38 Huntsman Corporation: Company Snapshot
Figure 39 Eastman Chemical Company: Company Snapshot
Figure 40 Nova Chemicals Corporation: Company Snapshot


Growth opportunities and latent adjacency in Chemical Licensing Market