Cenospheres Market by Type (Gray Cenosphere, White Cenosphere), End-use Industry (Refractory, Construction, Oil & Gas, Automotive, Paints & Coatings), and Region - Global Forecasts to 2022


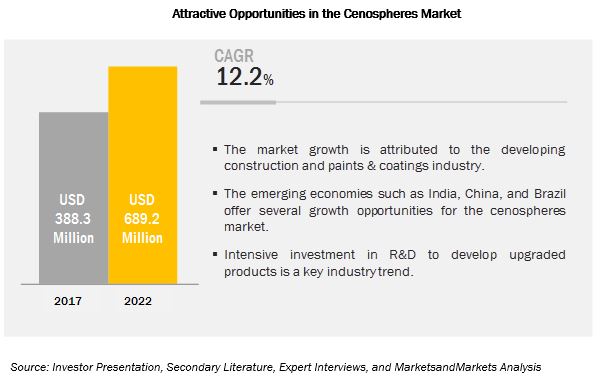
[136 Pages Report] MarketsandMarkets forecasts the Cenospheres Market to grow from USD 388.3 million in 2017 to USD 689.2 million by 2022, at a Compound Annual Growth Rate (CAGR) of 12.2% during the forecast period. The growing demand from major end-use industries such as paints & coatings, refractory, construction, and oil & gas is expected to drive the market in the future. Limited source of raw material and lack of quality control across developing countries are the major restraints to the market.
By end use industry, household and personal care segment accounts for the largest market of Cenospheres market
By end use industry, the oil & gas segment is expected to lead the market during the forecast period. The growing shale gas exploration and production activities in the North American region, and rising production activities in the Middle East is expected to drive the demand of cenospheres in oil & gas industry.
By type, gray cenosphere type to record the highest CAGR during the forecast period
By product type, the grey cenosphere type of the cenospheres market is projected to grow at the highest during the forecast period, in terms of value. Gray cenospheres occur more frequently than white cenospheres in fly ash. These cenospheres have low content of alumina and high content of silica and iron. Gray cenospheres are used in various applications, such as concretes, plastics, resins, coatings, bricks, and rubbers.
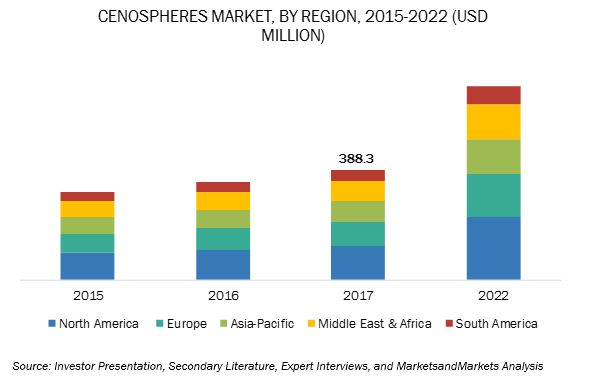
North America to grow at the highest CAGR during the forecast period.
North America is projected to be the fastest-growing cenospheres market during the forecast period, due to the growing oil & gas and automotive industries in the region. The market in Middle East & Africa, Asia-Pacific, and South America is also expected to witness significant growth, due to growing demand for cenospheres from the oil & gas and construction industries in these regions.
Market Dynamics
Drivers: Superior structural properties
Cenospheres are lightweight fillers that provide significant cost benefits. They possess excellent structural advantages, such as reduced weight, low density, electrical characteristics, high melting temperature, and high fluidity, which make cenospheres viable for use in a variety of end-use industries such as construction, oil & gas, paints & coatings, and refractory. Cenospheres are used in these industries due to their unique combination of spherical shape, high compression, low specific gravity, good thermal &acoustical insulation properties, and inertness to acids and alkalis. Cenospheres are 75% lighter than different minerals such as clay and talc & calcium carbonate used as fillers and 30% lighter than most resins.
Opportunity: Reclamation of fly ash lagoons
According to the industry experts, there would be an increase in the supply of cenospheres, mainly due to the reclamation of the stockpiled fly ash lagoons produced at coal-fired power stations in China and Malaysia. These old dumps contain fly ash along with other valuable minerals (including cenospheres) that have not been utilized by thermal power plants for years.
For instance, in 2012, RockTron (U.K.) signed a deal with Malaysian energy provider Tenaga Nasional Berhad (TNB) to reclaim high-performance fillers from the fly ash produced at coal-fired power stations and reuse these materials. There is a shift in the trend toward glass microspheres that used in the refractory industry. Few properties of glass microspheres have increased its demand in various end-use industries, therefore increasing the need to reclaim fly ash lagoons. For instance, glass microspheres are high strength, lightweight additives, which increase buoyancy and help pipelines and equipment survive as drillers.
Restraints: Limited source of raw material
Cenospheres are extracted from the fly ash generated as a by-product of coal combustion at thermal power plants. Earlier, fly ash was released directly into the atmosphere; however, due to pollution concerns, fly ash needs to be captured before its release. Therefore, end-use industries use fly ash in their applications, as extracting cenospheres would require further processing of the fly ash. Hence, the governments are keen on promoting fly ash over cenospheres. This has resulted in limited sources to extract cenospheres; making it difficult for manufacturers to produce cenospheres according to their requirement. Therefore, the end users are finding new alternatives to cenospheres. For instance, some construction companies have started using perlite as a substitute for cenospheres, whereas few oilfield companies are using glass bubbles instead of cenospheres.
Scope of the Report
|
Report Metric |
Details |
|
Market size available for years |
2015–2022 |
|
Base year considered |
2016 |
|
Forecast period |
2017–2022 |
|
Forecast units |
Million (USD) |
|
Segments covered |
Type (Gray Cenospheres, White Cenospheres), End-use Industry (Oil & gas, Construction, Automotive, Refractory, Paints & coatings, Others)> |
|
Geographies covered |
APAC, North America, Europe, MEA, and South America |
|
Companies covered |
Petra India Group (India), Cenosphere India Pvt. Ltd. (India), Durgesh Merchandise Pvt. Ltd. (India), Omya AG (Switzerland), Qingdao Eastchem Inc. (China), Envirospheres (Australia), Scotash Limited (U.K.), PR Ecoenergy Pvt. Ltd. (India), Ceno Technologies (U.S.), and Reslab Microfiller (Australia). |
The research report categorizes the Cenospheres Market to forecast the revenues and analyze the trends in each of the following sub-segments:
Cenospheres Market, by Type:
- Gray cenospheres
- White cenospheres
Cenospheres Market, by End-use Industry:
- Oil & gas
- Construction
- Automotive
- Refractory
- Paints & coatings
- Aerospace
- Syntactic Foams
- Specialty Cements
- Building Materials
- Others
Cenospheres Market, By Region
- Asia Pacific (APAC)
- North America
- Europe
- Middle East and Africa (MEA)
- South America
Key Market Players
Petra India Group (India), Cenosphere India Pvt. Ltd. (India), Durgesh Merchandise Pvt. Ltd. (India), Omya AG (Switzerland), Qingdao Eastchem Inc. (China), Envirospheres (Australia), Scotash Limited (U.K.), PR Ecoenergy Pvt. Ltd. (India), Ceno Technologies (U.S.), and Reslab Microfiller (Australia).
Recent Developments
- In September 2011, opened a processing unit of cenospheres in Nagpur, India. This expansion helped the company to increase its production as well as optimize the cost of production.
- In March 2014, announced to expand its cenosphere business by constructing a new plant. This expansion increased the company’s total cenospheres production capacity to 6,000 metric tons.
- In June 2014, announced to expand its cenospheres processing capacity from 700 metric tons to 2,000 metric tons.
Critical questions the report answers:
- Where will all these developments take the industry in the long term?
- What are the upcoming trends for the Cenospheres market?
- Which segment provides the most opportunity for growth?
- Who are the leading vendors operating in this market?
- What are the opportunities for new market entrants?
“To speak to our analyst for a discussion on the above findings, please fill in the required details by clicking on the Speak to Analyst tab.”
 Exclusive indicates content/data unique to MarketsandMarkets and not available with any competitors.
Table of Contents
1 Introduction (Page No. - 12)
1.1 Objectives of the Study
1.2 Market Definition
1.3 Scope of the Study
1.3.1 Markets Covered
1.3.2 Years Considered for the Study
1.3.3 Currency
1.3.4 Limitations
1.4 Stakeholders
2 Research Methodology (Page No. - 16)
2.1 Research Data
2.1.1 Secondary Data
2.1.1.1 Key Data From Secondary Sources
2.1.2 Primary Data
2.1.2.1 Key Data From Primary Sources
2.1.2.2 Key IndUStry Insights
2.1.2.3 Breakdown of Primary Interviews
2.2 Market Size Estimation
2.2.1 Bottom-Up Approach
2.2.2 Top-Down Approach
2.3 Data Triangulation
2.4 Assumptions
3 Executive Summary (Page No. - 24)
4 Premium Insights (Page No. - 28)
4.1 Attractive Market Opportunities for Cenospheres Manufacturers
4.2 Cenospheres Market, By Region
4.3 Cenospheres Market Share, By Type
4.4 Cenospheres Market, By End-USe IndUStry
4.5 Cenospheres Market Attractiveness
4.6 Cenospheres Market in North America, By Major End-USe IndUStry and Country
5 Market Overview (Page No. - 32)
5.1 Introduction
5.2 Market Dynamics
5.2.1 Drivers
5.2.1.1 Superior Structural Properties
5.2.1.2 Rising Demand From End-USe IndUStries
5.2.2 Restraints
5.2.2.1 Limited Source of Raw Material
5.2.2.2 Lack of Quality Control Across Developing Countries
5.2.3 Opportunities
5.2.3.1 Reclamation of Fly Ash Lagoons
5.2.4 Short-, Medium-, and Long-Term Impact Analysis
5.3 Porter’s Five Forces Analysis
5.3.1 Threat of New Entrants
5.3.2 Bargaining Power of Suppliers
5.3.3 Threat of Substitutes
5.3.4 Bargaining Power of Buyers
5.3.5 Intensity of Competitive Rivalry
5.4 Macroeconomic Indicators
5.4.1 Automotive IndUStry
5.5 Construction IndUStry
5.5.1 Trends and Forecast of the Construction IndUStry in North America
5.5.2 Trends and Forecast of the Construction IndUStry in Europe
5.5.3 Trends and Forecast of the Construction IndUStry in Asia-Pacific
5.5.4 Trends and Forecast of the Construction IndUStry in Middle East & Africa
5.5.5 Trends and Forecast of the Construction IndUStry in South America
6 Cenospheres Market, By Type (Page No. - 47)
6.1 Introduction
6.2 Gray Cenospheres
6.3 White Cenospheres
7 Cenospheres Market, By End-USe IndUStry (Page No. - 52)
7.1 Introduction
7.2 Oil & Gas
7.2.1 Drilling Mud
7.2.2 Well Cementing
7.3 Refractory
7.4 Construction
7.4.1 Production Aid
7.4.2 Volumetric Filler
7.5 Automotive
7.6 Paints & Coatings
7.7 Aerospace
7.8 Syntactic Foams
7.9 Specialty Cements
7.10 Building Materials
7.11 Others
7.11.1 Bulk Fillers
8 Regional Analysis (Page No. - 63)
8.1 Introduction
8.2 North America
8.2.1 U.S.
8.2.2 Canada
8.2.3 Mexico
8.3 Asia-Pacific
8.3.1 China
8.3.2 India
8.3.3 Japan
8.3.4 South Korea
8.3.5 Taiwan
8.3.6 Thailand
8.3.7 Malaysia
8.4 Europe
8.4.1 Germany
8.4.2 RUSsia
8.4.3 U.K.
8.4.4 France
8.4.5 Italy
8.4.6 Spain
8.4.7 Poland
8.5 Middle East & Africa
8.5.1 Middle East
8.5.2 Africa
8.6 South America
8.6.1 Brazil
8.6.2 Argentina
9 Competitive Landscape (Page No. - 113)
9.1 Market Share Analysis of Key Players
9.2 Competitive Benchmarking
10 Company Profiles (Page No. - 115)
10.1 Introduction
10.2 Ceno Technologies
10.2.1 BUSiness Overview
10.2.2 Products Offered
10.3 Cenosphere India Pvt. Ltd.
10.3.1 BUSiness Overview
10.3.1 Products Offered
10.3.2 Recent Developments
10.4 Durgesh Merchandise Pvt. Ltd.
10.4.1 BUSiness Overview
10.4.2 Products Offered
10.5 Envirospheres
10.5.1 BUSiness Overview
10.5.2 Products Offered
10.6 Omya Ag
10.6.1 BUSiness Overview
10.6.2 Products Offered
10.7 Petra India Group
10.7.1 BUSiness Overview
10.7.2 Products Offered
10.7.3 Recent Developments
10.8 Pr Ecoenergy Pvt. Ltd.
10.8.1 BUSiness Overview
10.8.2 Products Offered
10.8.3 Recent Developments
10.9 Qingdao Eastchem Inc.
10.9.1 BUSiness Overview
10.9.2 Products Offered
10.10 Reslab Microfiller
10.10.1 BUSiness Overview
10.10.2 Products Offered
10.11 Scotash Limited
10.11.1 BUSiness Overview
10.11.2 Products Offered
10.12 Other Cenospheres Producers
10.12.1 Vipra Ferro Alloys Pvt. Ltd.
10.12.2 Shanghai Green Sub-Nanoseale Material Co.,Ltd
10.12.3 Ashtech India Pvt Ltd.
10.12.4 Krishna Udyog
10.12.5 American Iodine Company Inc.
10.12.6 Cenospheres Trade & Engineering S.A.
10.12.7 Prakash Mica Exports Pvt. Ltd.
10.12.8 Delamin Limited
10.12.9 Shishir Export HoUSe
10.12.10 Wolkem Omega Minerals India Pvt Ltd.
10.12.11 Ets Inc.
10.12.12 Excellex Solutions
10.12.13 Microspheres Sa
10.12.14 Khetan Group
10.12.15 Sun Microspheres
11 Appendix (Page No. - 130)
11.1 DiscUSsion Guide
11.2 Knowledge Store: Marketsandmarkets’ Subscription Portal
11.3 Introducing RT: Real Time Market Intelligence
11.4 Available CUStomizations
11.5 Related Reports
11.6 Author Details
List of Tables (96 Tables)
Table 1 Key Features of Cenospheres
Table 2 Vehicles Production, By Country, 2011–2015 (ThoUSand Unit)
Table 3 Cenospheres Market Size, By Type, 2015–2022 (Kiloton)
Table 4 Cenospheres Price, By Type, 2015–2022 (USD/Ton)
Table 5 Analysis of Gray Cenospheres
Table 6 Gray Cenospheres Market Size, By Region, 2015–2022 (Kiloton)
Table 7 Analysis of White Cenospheres
Table 8 White Cenospheres Market Size, By Region, 2015–2022 (Kiloton)
Table 9 Cenospheres Market Size, By End-USe IndUStry, 2015–2022 (Kiloton)
Table 10 Cenospheres Market Size, By End-USe IndUStry, 2015–2022 (USD Million)
Table 11 Cenospheres Market Size in Oil & Gas End-USe IndUStry, By Region, 2015–2022 (Kiloton)
Table 12 Cenospheres Market Size in Refractory End-USe IndUStry, By Region, 2015–2022 (Kiloton)
Table 13 Cenospheres Market Size in Construction End-USe IndUStry, By Region, 2015–2022 (Kiloton)
Table 14 Cenospheres Market Size in Automotive End-USe IndUStry, By Region, 2015–2022 (Kiloton)
Table 15 Cenospheres Market Size in Paints & Coatings End-USe IndUStry, By Region, 2015–2022 (Kiloton)
Table 16 Cenospheres Market Size in Aerospace End-USe IndUStry, By Region, 2015–2022 (Kiloton)
Table 17 Cenospheres Market Size in Syntactic Foams End-USe IndUStry, By Region, 2015–2022 (Kiloton)
Table 18 Cenospheres Market Size in Specialty Cements End-USe IndUStry, By Region, 2015–2022 (Kiloton)
Table 19 Cenospheres Market Size in Building Materials End-USe IndUStry, By Region, 2015–2022 (Kiloton)
Table 20 Cenospheres Market Size in Others End-USe IndUStry, By Region, 2015–2022 (Kiloton)
Table 21 Cenospheres Market Size in Bulk Fillers in Others End-USe IndUStry, By Region, 2015–2022 (Kiloton)
Table 22 Cenospheres Market Size, By Region, 2015–2022 (Kiloton)
Table 23 Cenospheres Price, By Region, 2015–2022 (USD/Ton)
Table 24 Cenospheres Market Size, By Region, 2015–2022 (USD Million)
Table 25 North America: Cenospheres Market Size, By Country, 2015–2022 (Kiloton)
Table 26 North America: Cenospheres Price, By Country, 2015–2022 (USD/Ton)
Table 27 North America: Cenospheres Market Size, By Country, 2015–2022 (USD Million)
Table 28 North America: Cenospheres Market Size, By End-USe IndUStry, 2015–2022 (Kiloton)
Table 29 North America: Cenospheres Price, By End-USe IndUStry, 2015–2022 (USD/Ton)
Table 30 North America: Cenospheres Market Size, By End-USe IndUStry, 2015–2022 (USD Million)
Table 31 U.S.: Cenospheres Market Size, By End-USe IndUStry, 2015–2022 (Kiloton)
Table 32 U.S.: Cenospheres Market Size, By End-USe IndUStry, 2015–2022 (USD Million)
Table 33 Canada: Cenospheres Market Size, By End-USe IndUStry, 2015–2022 (Kiloton)
Table 34 Canada: Cenospheres Market Size, By End-USe IndUStry, 2015–2022 (USD Million)
Table 35 Mexico: Cenospheres Market Size, By End-USe IndUStry, 2015–2022 (Kiloton)
Table 36 Mexico: Cenospheres Market Size, By End-USe IndUStry, 2015–2022 (USD Million)
Table 37 Asia-Pacific: Cenospheres Market Size, By Country, 2015–2022 (Kiloton)
Table 38 Asia-Pacific: Cenospheres Price, By Country, 2015–2022 (USD/Ton)
Table 39 Asia-Pacific: Cenospheres Market Size, By Country, 2015–2022 (USD Million)
Table 40 Asia-Pacific: Cenospheres Market Size, By End-USe IndUStry, 2015–2022 (Kiloton)
Table 41 Asia-Pacific: Cenospheres Price, By End-USe IndUStry, 2015–2022 (USD/Ton)
Table 42 Asia-Pacific: Cenospheres Market Size, By End-USe IndUStry, 2015–2022 (USD Million)
Table 43 China: Cenospheres Market Size, By End-USe IndUStry, 2015–2022 (Kiloton)
Table 44 China: Cenospheres Market Size, By End-USe IndUStry, 2015–2022 (USD Million)
Table 45 India: Cenospheres Market Size, By End-USe IndUStry, 2015–2022 (Kiloton)
Table 46 India: Cenospheres Market Size, By End-USe IndUStry, 2015–2022 (USD Million)
Table 47 Japan: Cenospheres Market Size, By End-USe IndUStry, 2015–2022 (Kiloton)
Table 48 Japan: Cenospheres Market Size, By End-USe IndUStry, 2015–2022 (USD Million)
Table 49 South Korea: Cenospheres Market Size, By End-USe IndUStry, 2015–2022 (Kiloton)
Table 50 South Korea: Cenospheres Market Size, By End-USe IndUStry, 2015–2022 (USD Million)
Table 51 Taiwan: Cenospheres Market Size, By End-USe IndUStry, 2015–2022 (Kiloton)
Table 52 Taiwan: Cenospheres Market Size, By End-USe IndUStry, 2015–2022 (USD Million)
Table 53 Thailand: Cenospheres Market Size, By End-USe IndUStry, 2015–2022 (Kiloton)
Table 54 Thailand: Cenospheres Market Size, By End-USe IndUStry, 2015–2022 (USD Million)
Table 55 Malaysia: Cenospheres Market Size, By End-USe IndUStry, 2015–2022 (Kiloton)
Table 56 Malaysia: Cenospheres Market Size, By End-USe IndUStry, 2015–2022 (USD Million)
Table 57 Europe: Cenospheres Market Size, By Country, 2015–2022 (Kiloton)
Table 58 Europe: Cenospheres Price, By Country, 2015–2022 (USD/Ton)
Table 59 Europe: Cenospheres Market Size, By Country, 2015–2022 (USD Million)
Table 60 Europe: Cenospheres Market Size, By End-USe IndUStry, 2015–2022 (Kiloton)
Table 61 Europe: Cenospheres Price, By End-USe IndUStry, 2015-2022 (USD/Ton)
Table 62 Europe: Cenospheres Market Size, By End-USe IndUStry, 2015–2022 (USD Million)
Table 63 Germany: Cenospheres Market Size, By End-USe IndUStry, 2015–2022 (Kiloton)
Table 64 Germany: Cenospheres Market Size, By End-USe IndUStry, 2015–2022 (USD Million)
Table 65 RUSsia: Cenospheres Market Size, By End-USe IndUStry, 2015–2022 (Kiloton)
Table 66 RUSsia: Cenospheres Market Size, By End-USe IndUStry, 2015–2022 (USD Million)
Table 67 U.K.: Cenospheres Market Size, By End-USe IndUStry, 2015–2022 (Kiloton)
Table 68 U.K.: Cenospheres Market Size, By End-USe IndUStry, 2015–2022 (USD Million)
Table 69 France: Cenospheres Market Size, By End-USe IndUStry, 2015–2022 (Kiloton)
Table 70 France: Cenospheres Market Size, By End-USe IndUStry, 2015–2022 (USD Million)
Table 71 Italy: Cenospheres Market Size, By End-USe IndUStry, 2015–2022 (Kilotons)
Table 72 Italy: Cenospheres Market Size, By End-USe IndUStry, 2015–2022 (USD Million)
Table 73 Spain: Cenospheres Market Size, By End-USe IndUStry, 2015–2022 (Kiloton)
Table 74 Spain: Cenospheres Market Size, By End-USe IndUStry, 2015–2022 (USD Million)
Table 75 Poland: Cenospheres Market Size, By End-USe IndUStry, 2015–2022 (Kiloton)
Table 76 Poland: Cenospheres Market Size, By End-USe IndUStry, 2015–2022 (USD Million)
Table 77 Middle East & Africa: Cenospheres Market Size, By Region, 2015–2022 (Kiloton)
Table 78 Middle East & Africa: Cenospheres Price, By Region, 2015–2022 (USD/Ton)
Table 79 Middle East & Africa: Cenospheres Market Size, By Region, 2015–2022 (USD Million)
Table 80 Middle East & Africa: Cenospheres Market Size, By End-USe IndUStry, 2015–2022 (Kiloton)
Table 81 Middle East & Africa: Cenospheres Price, By End-USe IndUStry, 2015–2022 (USD/Ton)
Table 82 Middle East & Africa: Cenospheres Market Size, By End-USe IndUStry, 2015–2022 (USD Million)
Table 83 Middle East: Cenospheres Market Size, By End-USe IndUStry, 2015–2022 (Kiloton)
Table 84 Middle East: Cenospheres Market Size, By End-USe IndUStry, 2015–2022 (USD Million)
Table 85 Africa: Cenospheres Market Size, By End-USe IndUStry, 2015–2022 (Kiloton)
Table 86 Africa: Cenospheres Market Size, By End-USe IndUStry, 2015–2022 (USD Million)
Table 87 South America: Cenospheres Market Size, By Country, 2015–2022 (Kiloton)
Table 88 South America: Cenospheres Price, By Country, 2015–2022 (USD/Ton)
Table 89 South America: Cenospheres Market Size, By Country, 2015–2022 (USD Million)
Table 90 South America: Cenospheres Market Size, By End-USe IndUStry, 2015–2022 (Kiloton)
Table 91 South America: Cenospheres Price, By End-USe IndUStry, 2015–2022 (USD/Ton)
Table 92 South America: Cenospheres Market Size, By End-USe IndUStry, 2015–2022 (USD Million)
Table 93 Brazil: Cenospheres Market Size, By End-USe IndUStry, 2015–2022 (Kiloton)
Table 94 Brazil: Cenospheres Market Size, By End-USe IndUStry, 2015–2022 (USD Million)
Table 95 Argentina: Cenospheres Market Size, By End-USe IndUStry, 2015–2022 (Kiloton)
Table 96 Argentina: Cenospheres Market Size, By End-USe IndUStry, 2015–2022 (USD Million)
List of Figures (55 Figures)
Figure 1 Cenospheres Market: Research Design
Figure 2 Cenospheres Market: Data Triangulation
Figure 3 Gray Cenospheres to Dominate the Market During the Forecast Period
Figure 4 Oil & Gas to Be the Largest and Fastest-Growing End-USe IndUStry of Cenospheres
Figure 5 North America to Be the Fastest-Growing Market During the Forecast Period
Figure 6 Attractive Opportunities in the Cenospheres Market
Figure 7 North America to Register the Highest Cagr Between 2017 and 2022
Figure 8 Gray Cenospheres Dominated the Market in 2016
Figure 9 Oil & Gas to Be the Largest and Fastest-Growing End-USe IndUStry of Cenospheres Between 2017 and 2022
Figure 10 Asia-Pacific to Witness High Demand for Cenospheres Between 2017 and 2022
Figure 11 U.S. is the Largest Market for Cenospheres in North America
Figure 12 Drivers, Restraints, and Opportunities in the Cenospheres Market
Figure 13 Overview of Factors Governing the Cenospheres Market
Figure 14 Porter’s Five Forces Analysis
Figure 15 Asia-Pacific Recorded the Highest Number of Vehicles Produced in 2015
Figure 16 Construction IndUStry in U.S. Contributes Maximum to the Gdp of North America, 2017 vs. 2022
Figure 17 Construction IndUStry in U.K. Contributes Maximum to the Gdp of Europe, 2017 vs. 2022
Figure 18 Construction IndUStry in China Contributes Maximum to the Gdp of Asia-Pacific, 2017 vs. 2022
Figure 19 Construction IndUStry in Saudi Arabia Contributes Maximum to the Gdp of Middle East & Africa, 2017 vs. 2022
Figure 20 Construction IndUStry in Brazil Contributes Maximum to the Gdp of South America, 2017 vs. 2022
Figure 21 Gray Cenospheres to Dominate the Market Between 2017 and 2022
Figure 22 North America to Lead the Gray Cenospheres Market
Figure 23 North America to Lead the White Cenospheres Market
Figure 24 Oil & Gas to Be the Largest End-USe IndUStry of Cenospheres During the Forecast Period
Figure 25 Middle East & Africa to Be the Second-Largest Market for Cenospheres in Oil & Gas End-USe IndUStry
Figure 26 Asia-Pacific to Lead the Cenospheres Market in Refractory End-USe IndUStry
Figure 27 Asia-Pacific to Lead Cenospheres Market in Construction End-USe IndUStry
Figure 28 North America to Lead Cenospheres Market in Automotive End-USe IndUStry
Figure 29 North America is the Largest Cenospheres Market in Paints & Coatings End-USe IndUStry
Figure 30 North America to Lead the Cenospheres Market
Figure 31 Regional Snapshot: North America is the Key Cenospheres Market
Figure 32 North America Market Snapshot: Oil & Gas to Dominate the Market
Figure 33 U.S. to Be the Largest Cenospheres Market in North America
Figure 34 Oil & Gas to Be the Largest End-USe IndUStry of Cenospheres in North America
Figure 35 Oil & Gas to Be the Largest End-USe IndUStry of Cenospheres in U.S.
Figure 36 Asia-Pacific Market Snapshot: Refractory is the Largest End-USe IndUStry of Cenospheres in the Region
Figure 37 China to Be the Largest Cenospheres Market in Asia-Pacific
Figure 38 Refractory to Be the Largest End-USe IndUStry of Cenospheres in Asia-Pacific in 2017
Figure 39 Oil & Gas to Be the Largest End-USe IndUStry of Cenospheres in China
Figure 40 Oil & Gas to Be the Largest End-USe IndUStry of Cenospheres in India
Figure 41 Refractory to Be the Largest End-USe IndUStry of Cenospheres in South Korea
Figure 42 Refractory to Be the Largest End-USe IndUStry of Cenospheres in Malaysia
Figure 43 Germany to Lead the Cenospheres Market in Europe
Figure 44 Oil & Gas to Be the Largest End-USe IndUStry of Cenospheres in Europe
Figure 45 Automotive to Be the Largest End-USe IndUStry of Cenospheres in Germany
Figure 46 Oil & Gas to Be the Largest End-USe IndUStry of Cenospheres in RUSsia
Figure 47 Oil & Gas to Be the Largest End-USe IndUStry of Cenospheres in the U.K.
Figure 48 Middle East Dominates the Cenospheres Market in Middle East & Africa
Figure 49 Oil & Gas to Dominate the Cenospheres Market in Middle East & Africa
Figure 50 Oil & Gas to Be the Largest End-USe IndUStry of Cenospheres in Africa
Figure 51 Brazil to Be the Largest Cenospheres Market in South America
Figure 52 Oil & Gas End-USe IndUStry to Dominate the Cenospheres Market in South America
Figure 53 Oil & Gas to Be the Largest End-USe IndUStry of Cenospheres in Brazil
Figure 54 Ceno Technologies Dominated the Cenospheres Market in 2016
Figure 55 Competetive Benchmarking of the Major Players


Growth opportunities and latent adjacency in Cenospheres Market
cenosphere export market
Market data and insight on global Cenosphere market in OEM
General information on Cenospheres
Report on Cenospheres
We need identified buyers in countries other than Middle East for purposes of selling our product Cenosphere.