Cell Viability Assays Market by Product (MTT Assay, XTT Assay, Calcein, Resazurin, Flow Cytometry, Spectrophotometer), Cell Type (Human, Animal, Microbial), Application (Basic Research, Stem Cell, Discovery & Development) - Global Forecast to 2023


The cell viability assays market was valued at USD 2.54 billion in 2017 and is expected to reach USD 4.16 billion by 2023, at a CAGR of 8.4% during the forecast period. The base year considered for the study is 2017 and the forecast period is 2018 to 2023.
Objectives of the Study
- To define, describe, segment, and forecast the global cell viability assays market by product, application, cell type, end user, and region
- To provide detailed information about the factors influencing market growth (drivers, restraints, opportunities, and industry-specific challenges)
- To analyze micromarkets with respect to individual growth trends, prospects, and contributions to the overall market
- To analyze market opportunities for stakeholders and provide details of the competitive landscape for key players
- To forecast the size of the cell viability assays market in five main regions (along with major countries) North America, Europe, Asia Pacific, Latin America, and the Middle East and Africa
- To profile key players in the global cell viability assays market and comprehensively analyze their core competencies and market shares
- To track and analyze competitive developments such as mergers and acquisitions; new product/technology launches; expansions; collaborations and agreements; and R&D activities of the leading players in the global cell viability assays industry
Research Methodology
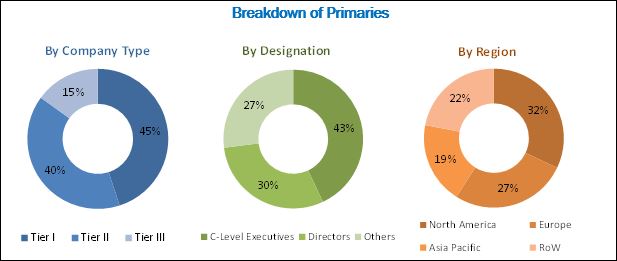
Top-down and bottom-up approaches were used to validate the size of the global cell viability assays market and estimate the size of other dependent submarkets. Various secondary sources such as directories; industry journals; databases such as D&B Hoovers, Bloomberg Business, and Factiva; and annual reports of companies have been used to identify and collect information useful for the study of this market. Primary sources such as experts from both the supply and demand sides have been interviewed to obtain and validate information as well as to assess the dynamics of this market. The breakdown of primary profiles is shown in the figure below:
To know about the assumptions considered for the study, download the pdf brochure
The prominent players in the global cell viability assays market are Thermo Fisher Scientific (US), Bio-Rad Laboratories (US), Merck (Germany), GE Healthcare (US), BioTek Instruments (US), PerkinElmer (US), Promega Corporation (US), Biotium (US), Abcam plc (UK), Canvax (Spain), Abnova (Taiwan), G-Biosciences (US), Creative Bioarray (US), Danaher Corporation (US), and Becton, Dickinson and Company (US).
Target Audience:
- Manufacturers of cell viability instruments and consumables
- Distributors of cell viability instruments and consumables
- Research and development organizations
- Hospitals and clinics
- Diagnostic centers
- Market research and consulting firms
- Venture capitalists and investors
Cell Viability Assays Market Scope
The research report categorizes the market into the following segments and subsegments:
By Product
-
Consumables
- Reagents
-
Assay Kits
-
Tetrazolium Reduction Assay Kits
- MTT Assay Kits
- Other Tetrazolium Assay Kits
- Resazurin Cell Viability Assay Kits
- Calcein-AM Cell Viability Assay Kits
- Other Assay Kits
-
Tetrazolium Reduction Assay Kits
- Microplates
-
Instruments
- Spectrophotometers
- Flow Cytometers
- Automated Cell Counters
- Cell Imaging & Analysis Systems
By Application
- Basic Research
- Stem Cell Research
- Drug Discovery & Development
- Clinical & Diagnostic Applications
- Other Applications
By End User
- Academic and Research Institutes
- Pharmaceutical and Biotechnology Companies
- Hospital and Diagnostic Laboratories
- Other End Users
By Region
-
North America
- US
- Canada
-
Europe
- Germany
- France
- UK
- Italy
- Spain
- Rest of Europe
-
Asia Pacific
- Japan
- China
- India
- Rest of Asia Pacific
- Latin America
- Middle East & Africa
Available Customizations
With the given market data, MarketsandMarkets offers customizations as per the company’s specific needs. The following customization options are available for the report:
Company Information
- Detailed analysis and profiling of additional market players
Geographic Analysis
- Further breakdown of the Rest of Asia Pacific cell viability assays market into South Korea, Australia, New Zealand, and others
- Further breakdown of the Latin American cell viability assays market into Brazil, Mexico, and others.
The global cell viability assays market is projected to reach USD 4.16 billion by 2023 from USD 2.78 billion in 2018, at a CAGR of 8.4%. Factors contributing to the growth of this market include the rising incidence and prevalence of chronic and infectious diseases, growing availability of funds for research, rising demand for cell-based assays in research, and increasing focus on the development of cell-based therapeutics.
The report analyzes the global cell viability assays market by product, cell type, application, end user, and region. On the basis of product, the consumables segment is expected to account for the largest share of the market in 2018. The large share can be attributed to the repeated consumption of consumables in various cell viability procedures. The growing focus on stem cell and cancer research is another major driver for the growth of the cell viability consumables market during the forecast period. In addition, the growing application of cell viability in quality control procedures in various industries such as food and beverage, pharmaceutical, biotechnology products manufacturing, and in the field of environmental monitoring and water treatment is also expected to play a key role in the growth of the cell viability consumables market during the forecast period.
Based on cell type, the human cells segment is expected to register the highest CAGR during the forecast period. This can be attributed to the growing investments by government bodies and private sector organizations in research activities that are focused on developing new treatments for various human diseases.
Based on application, the drug discovery & development application segment is expected to account for the largest share of the global cell viability assays market in 2018. The large share of this segment can be attributed to the rising incidence and prevalence of chronic and infectious diseases and increasing government support for developing new treatments for various human diseases.
Based on end user, the pharmaceutical and biotechnology companies segment is expected to register the highest CAGR during the forecast period. This can be attributed to the increasing number of R&D activities undertaken by these companies for the development of biopharmaceutical products.
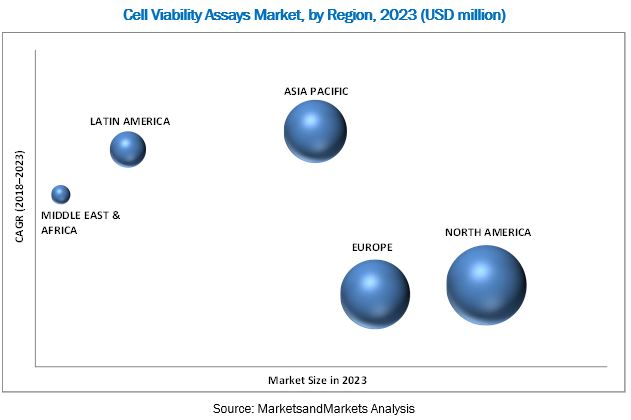
Geographically, the global cell viability assays market is segmented into North America, Europe, Asia Pacific, Latin America, and the Middle East & Africa. In 2018, North America is expected to account for the largest share of the cell viability assays market, followed by Europe and Asia Pacific. The dominance of the North American region can be attributed to the growing incidence of various infectious diseases, investment initiatives by the government, and the high-quality infrastructure for clinical and laboratory research. Various additional advantages such as the availability of insurance coverage for laboratory testing procedures, rising healthcare and R&D expenditure, and the presence of well-structured distribution channels in the region are also supporting the growth of the market.
The prominent players in the global cell viability assays market are Thermo Fisher Scientific (US), Bio-Rad Laboratories (US), Merck (Germany), GE Healthcare (US), BioTek Instruments (US), PerkinElmer (US), Promega Corporation (US), Biotium (US), Abcam plc (UK), Canvax (Spain), Abnova (Taiwan), G-Biosciences (US), Creative Bioarray (US), Danaher Corporation (US), and Becton, Dickinson and Company (US).
Frequently Asked Questions (FAQs):
What is the size of Cell Viability Assays Market?
The cell viability assays market was valued at USD 2.54 billion in 2017 and is expected to reach USD 4.16 billion by 2023, at a CAGR of 8.4%.
What are the major growth factors of Cell Viability Assays Market?
The major factors driving the growth of this market include the rising incidence and prevalence of chronic and infectious diseases, growing availability of funds for research, rising demand for cell-based assays in research, and increasing focus on the development of cell-based therapeutics.
Who all are the prominent players of Cell Viability Assays Market?
The prominent players in the global cell viability assays market are Thermo Fisher Scientific (US), Bio-Rad Laboratories (US), Merck (Germany), GE Healthcare (US), BioTek Instruments (US), PerkinElmer (US), Promega Corporation (US), Biotium (US), Abcam plc (UK), Canvax (Spain), Abnova (Taiwan), G-Biosciences (US), Creative Bioarray (US), Danaher Corporation (US), and Becton, Dickinson and Company (US).
To speak to our analyst for a discussion on the above findings, click Speak to Analyst
 Exclusive indicates content/data unique to MarketsandMarkets and not available with any competitors.
Table of Contents
1 Introduction (Page No. - 20)
1.1 Objectives of the Study
1.2 Market Definition
1.3 Market Scope
1.3.1 Markets Covered
1.3.2 Years Considered for the Study
1.4 Currency
1.5 Limitations
1.6 Stakeholders
2 Research Methodology (Page No. - 24)
2.1 Research Data
2.1.1 Secondary Sources
2.1.1.1 Key Data From Secondary Sources
2.1.2 Primary Sources
2.1.2.1 Key Data From Primary Sources
2.2 Market Size Estimation
2.3 Market Breakdown and Data Triangulation
2.4 Market Share Estimation
2.5 Assumptions for the Study
3 Executive Summary (Page No. - 34)
4 Premium Insights (Page No. - 40)
4.1 Cell Viability Assays Market Overview
4.2 Cell Viability Assays Market: Geographic Overview (2017)
4.3 Regional Mix: Cell Viability Assays Market (2018–2023)
4.4 Asia Pacific: Cell Viability Assays Market, By End User & Country (2017)
4.5 Cell Viability Assays Market: Developed vs Developing Markets
5 Market Overview (Page No. - 45)
5.1 Introduction
5.2 Market Dynamics
5.2.1 Drivers
5.2.1.1 Rising Incidence and Prevalence of Chronic and Infectious Diseases
5.2.1.2 Growing Availability of Funds for Research
5.2.1.3 Rising Demand for Cell-Based Assays in Research
5.2.1.4 Increasing Focus on the Development of Cell-Based Therapeutics
5.2.2 Restraint
5.2.2.1 High Cost of Instruments
5.2.3 Opportunities
5.2.3.1 Emerging Markets
5.2.3.2 Growing Focus on Stem Cell Research
6 Cell Viability Assays Market, By Product (Page No. - 51)
6.1 Introduction
6.2 Consumables
6.2.1 Reagents
6.2.2 Assay Kits
6.2.2.1 Tetrazolium Reduction Assay Kits
6.2.2.1.1 Mtt Assay Kits
6.2.2.1.2 Other Tetrazolium Assay Kits
6.2.2.2 Resazurin Cell Viability Assay Kits
6.2.2.3 Calcein-Am Cell Viability Assay Kits
6.2.2.4 Other Assay Kits
6.2.3 Microplates
6.3 Instruments
6.3.1 Automated Cell Counters
6.3.2 Flow Cytometers
6.3.3 Spectrophotometers
6.3.4 Cell Imaging & Analysis Systems
7 Cell Viability Assays Market, By Cell Type (Page No. - 75)
7.1 Introduction
7.2 Human Cells
7.3 Animal Cells
7.4 Microbial Cells
8 Cell Viability Assays Market, By Application (Page No. - 81)
8.1 Introduction
8.2 Drug Discovery and Development
8.3 Basic Research
8.4 Stem Cell Research
8.5 Clinical and Diagnostic Applications
8.6 Other Applications
9 Cell Viability Assays Market, By End User (Page No. - 89)
9.1 Introduction
9.2 Pharmaceutical & Biotechnology Companies
9.3 Academic & Research Institutes
9.4 Hospital & Diagnostic Laboratories
9.5 Other End Users
10 Cell Viability Assays Market, By Region (Page No. - 96)
10.1 Introduction
10.2 North America
10.2.1 US
10.2.2 Canada
10.3 Europe
10.3.1 Germany
10.3.2 France
10.3.3 UK
10.3.4 Italy
10.3.5 Spain
10.3.6 Rest of Europe
10.4 Asia Pacific
10.4.1 Japan
10.4.2 China
10.4.3 India
10.4.4 Rest of Asia Pacific
10.5 Latin America
10.6 Middle East & Africa
11 Competitive Landscape (Page No. - 176)
11.1 Overview
11.2 Market Share Analysis
11.2.1 Market Share Analysis: Cell Viability Assay Kits Market
11.3 Competitive Situation and Trends
11.3.1 Product Launches
11.3.2 Expansions
11.3.3 Acquisitions
11.3.4 Other Strategies
12 Company Profiles (Page No. - 184)
(Business Overview, Products Offered, Recent Developments, SWOT Analysis, MnM View)*
12.1 Thermo Fisher Scientific
12.2 Merck KGaA
12.3 Bio-Rad Laboratories
12.4 GE Healthcare
12.5 Danaher Corporation
12.6 Becton, Dickinson and Company
12.7 Promega Corporation
12.8 Biotium
12.9 Abcam PLC
12.10 Creative Bioarray
12.11 Biotek Instruments
12.12 Perkinelmer
*Business Overview, Products Offered, Recent Developments, SWOT Analysis, MnM View Might Not Be Captured in Case of Unlisted Companies.
13 Appendix (Page No. - 221)
13.1 Insights of Industry Experts
13.2 Discussion Guide
13.3 Knowledge Store: Marketsandmarkets’ Subscription Portal
13.4 Available Customizations
13.5 Related Reports
13.6 Author Details
List of Tables (184 Tables)
Table 1 Cell Viability Assays Market: Impact Analysis of Drivers, Restraints, and Opportunities
Table 2 Increase in Cancer Patient Population, By Cancer Type
Table 3 Cell Viability Assays Market, By Product, 2016–2023 (USD Million)
Table 4 Cell Viability Assays Market, By Country, 2016–2023 (USD Million)
Table 5 Cell Viability Consumables Market, By Type, 2016–2023 (USD Million)
Table 6 Cell Viability Consumables Market, By Country, 2016–2023 (USD Million)
Table 7 Cell Viability Reagents Market, By Country, 2016–2023 (USD Million)
Table 8 Cell Viability Assay Kits Market, By Type, 2016–2023 (USD Million)
Table 9 Cell Viability Assay Kits Market, By Country, 2016–2023 (USD Million)
Table 10 Cell Viability Assay Kits Offered By Prominent Players
Table 11 Tetrazolium Reduction Assay Kits Market, By Type, 2016–2023 (USD Million)
Table 12 Tetrazolium Reduction Assay Kits Market, By Country, 2016–2023 (USD Million)
Table 13 Mtt Assay Kits Market, By Country, 2016–2023 (USD Million)
Table 14 Other Tetrazolium Assay Kits Market, By Country, 2016–2023 (USD Million)
Table 15 Resazurin Cell Viability Assay Kits Market, By Country, 2016–2023 (USD Million)
Table 16 Calcein-Am Cell Viability Assay Kits Market, By Country, 2016–2023 (USD Million)
Table 17 Other Assay Kits Market, By Country, 2016–2023 (USD Million)
Table 18 Cell Viability Microplates Market, By Country, 2016–2023 (USD Million)
Table 19 Cell Viability Instruments Market, By Type, 2016–2023 (USD Million)
Table 20 Cell Viability Instruments Market, By Country, 2016–2023 (USD Million)
Table 21 Automated Cell Counters Market, By Country, 2016–2023 (USD Million)
Table 22 Flow Cytometers Market, By Country, 2016–2023 (USD Million)
Table 23 Spectrophotometers Market, By Country, 2016–2023 (USD Million)
Table 24 Cell Imaging & Analysis Systems Market, By Country, 2016–2023 (USD Million)
Table 25 Cell Viability Assays Market, By Cell Type, 2016–2023 (USD Million)
Table 26 Cell Viability Assays Market for Human Cells, By Country/Region, 2016–2023 (USD Million)
Table 27 Cell Viability Assays Market for Animal Cells, By Country/Region, 2016–2023 (USD Million)
Table 28 Cell Viability Assays Market for Microbial Cells, By Country/Region, 2016–2023 (USD Million)
Table 29 Cell Viability Assays Market, By Application, 2016–2023 (USD Million)
Table 30 Cell Viability Assays Market for Drug Discovery and Development, By Country, 2016–2023 (USD Million)
Table 31 Cell Viability Assays Market for Basic Research, By Country, 2016–2023 (USD Million)
Table 32 Cell Viability Assays Market for Stem Cell Research, By Country, 2016–2023 (USD Million)
Table 33 Cell Viability Assays Market for Clinical and Diagnostic Applications, By Country, 2016–2023 (USD Million)
Table 34 Cell Viability Assays Market for Other Applications, By Country, 2016–2023 (USD Million)
Table 35 Cell Viability Assays Market, By End User, 2016–2023 (USD Million)
Table 36 Cell Viability Assays Market for Pharmaceutical & Biotechnology Companies, By Country, 2016–2023 (USD Million)
Table 37 Cell Viability Assays Market for Academic & Research Institutes, By Country, 2016–2023 (USD Million)
Table 38 Cell Viability Assays Market for Hospital & Diagnostic Laboratories, By Country, 2016–2023 (USD Million)
Table 39 Cell Viability Assays Market for Other End Users, By Country, 2016–2023 (USD Million)
Table 40 Cell Viability Assays Market, By Region, 2016–2023 (USD Million)
Table 41 North America: Cell Viability Assays Market, By Country, 2016–2023 (USD Million)
Table 42 North America: Cell Viability Assays Market, By Product, 2016–2023 (USD Million)
Table 43 North America: Cell Viability Consumables Market, By Type, 2016–2023 (USD Million)
Table 44 North America: Cell Viability Assay Kits Market, By Type, 2016–2023 (USD Million)
Table 45 North America: Cell Viability Tetrazolium Reduction Assay Kits Market, By Type, 2016–2023 (USD Million)
Table 46 North America: Cell Viability Instruments Market, By Type, 2016–2023 (USD Million)
Table 47 North America: Cell Viability Assays Market, By Cell Type, 2016–2023 (USD Million)
Table 48 North America: Cell Viability Assays Market, By Application, 2016–2023 (USD Million)
Table 49 North America: Cell Viability Assays Market, By End User, 2016–2023 (USD Million)
Table 50 US: Cell Viability Assays Market, By Product, 2016–2023 (USD Million)
Table 51 US: Cell Viability Consumables Market, By Type, 2016–2023 (USD Million)
Table 52 US: Cell Viability Assay Kits Market, By Type, 2016–2023 (USD Million)
Table 53 US: Cell Viability Tetrazolium Reduction Assay Kits Market, By Type, 2016–2023 (USD Million)
Table 54 US: Cell Viability Instruments Market, By Type, 2016–2023 (USD Million)
Table 55 US: Cell Viability Assays Market, By Cell Type, 2016–2023 (USD Million)
Table 56 US: Cell Viability Assays Market, By Application, 2016–2023 (USD Million)
Table 57 US: Cell Viability Assays Market, By End User, 2016–2023 (USD Million)
Table 58 Canada: Cell Viability Assays Market, By Product, 2016–2023 (USD Million)
Table 59 Canada: Cell Viability Consumables Market, By Type, 2016–2023 (USD Million)
Table 60 Canada: Cell Viability Assay Kits Market, By Type, 2016–2023 (USD Million)
Table 61 Canada: Cell Viability Tetrazolium Reduction Assay Kits Market, By Type, 2016–2023 (USD Million)
Table 62 Canada: Cell Viability Instruments Market, By Type, 2016–2023 (USD Million)
Table 63 Canada: Cell Viability Assays Market, By Cell Type, 2016–2023 (USD Million)
Table 64 Canada: Cell Viability Assays Market, By Application, 2016–2023 (USD Million)
Table 65 Canada: Cell Viability Assays Market, By End User, 2016–2023 (USD Million)
Table 66 Europe: Cell Viability Assays Market, By Country, 2016–2023 (USD Million)
Table 67 Europe: Cell Viability Assays Market, By Product, 2016–2023 (USD Million)
Table 68 Europe: Cell Viability Consumables Market, By Type, 2016–2023 (USD Million)
Table 69 Europe: Cell Viability Assay Kits Market, By Type, 2016–2023 (USD Million)
Table 70 Europe: Cell Viability Tetrazolium Reduction Assay Kits Market, By Type, 2016–2023 (USD Million)
Table 71 Europe: Cell Viability Instruments Market, By Type, 2016–2023 (USD Million)
Table 72 Europe: Cell Viability Assays Market, By Cell Type, 2016–2023 (USD Million)
Table 73 Europe: Cell Viability Assays Market, By Application, 2016–2023 (USD Million)
Table 74 Europe: Cell Viability Assays Market, By End User, 2016–2023 (USD Million)
Table 75 Germany: Cell Viability Assays Market, By Product, 2016–2023 (USD Million)
Table 76 Germany: Cell Viability Consumables Market, By Type, 2016–2023 (USD Million)
Table 77 Germany: Cell Viability Assay Kits Market, By Type, 2016–2023 (USD Million)
Table 78 Germany: Cell Viability Tetrazolium Reduction Assay Kits Market, By Type, 2016–2023 (USD Million)
Table 79 Germany: Cell Viability Instruments Market, By Type, 2016–2023 (USD Million)
Table 80 Germany: Cell Viability Assays Market, By Cell Type, 2016–2023 (USD Million)
Table 81 Germany: Cell Viability Assays Market, By Application, 2016–2023 (USD Million)
Table 82 Germany: Cell Viability Assays Market, By End User, 2016–2023 (USD Million)
Table 83 France: Cell Viability Assays Market, By Product, 2016–2023 (USD Million)
Table 84 France: Cell Viability Consumables Market, By Type, 2016–2023 (USD Million)
Table 85 France: Cell Viability Assay Kits Market, By Type, 2016–2023 (USD Million)
Table 86 France: Cell Viability Tetrazolium Reduction Assay Kits Market, By Type, 2016–2023 (USD Million)
Table 87 France: Cell Viability Instruments Market, By Type, 2016–2023 (USD Million)
Table 88 France: Cell Viability Assays Market, By Cell Type, 2016–2023 (USD Million)
Table 89 France: Cell Viability Assays Market, By Application, 2016–2023 (USD Million)
Table 90 France: Cell Viability Assays Market, By End User, 2016–2023 (USD Million)
Table 91 UK: Cell Viability Assays Market, By Product, 2016–2023 (USD Million)
Table 92 UK: Cell Viability Consumables Market, By Type, 2016–2023 (USD Million)
Table 93 UK: Cell Viability Assay Kits Market, By Type, 2016–2023 (USD Million)
Table 94 UK: Cell Viability Tetrazolium Reduction Assay Kits Market, By Type, 2016–2023 (USD Million)
Table 95 UK: Cell Viability Instruments Market, By Type, 2016–2023 (USD Million)
Table 96 UK: Cell Viability Assays Market, By Cell Type, 2016–2023 (USD Million)
Table 97 UK: Cell Viability Assays Market, By Application, 2016–2023 (USD Million)
Table 98 UK: Cell Viability Assays Market, By End User, 2016–2023 (USD Million)
Table 99 Italy: Cell Viability Assays Market, By Product, 2016–2023 (USD Million)
Table 100 Italy: Cell Viability Consumables Market, By Type, 2016–2023 (USD Million)
Table 101 Italy: Cell Viability Assay Kits Market, By Type, 2016–2023 (USD Million)
Table 102 Italy: Cell Viability Tetrazolium Reduction Assay Kits Market, By Type, 2016–2023 (USD Million)
Table 103 Italy: Cell Viability Instruments Market, By Type, 2016–2023 (USD Million)
Table 104 Italy: Cell Viability Assays Market, By Cell Type, 2016–2023 (USD Million)
Table 105 Italy: Cell Viability Assays Market, By Application, 2016–2023 (USD Million)
Table 106 Italy: Cell Viability Assays Market, By End User, 2016–2023 (USD Million)
Table 107 Spain: Cell Viability Assays Market, By Product, 2016–2023 (USD Million)
Table 108 Spain: Cell Viability Consumables Market, By Type, 2016–2023 (USD Million)
Table 109 Spain: Cell Viability Assay Kits Market, By Type, 2016–2023 (USD Million)
Table 110 Spain: Cell Viability Tetrazolium Reduction Assay Kits Market, By Type, 2016–2023 (USD Million)
Table 111 Spain: Cell Viability Instruments Market, By Type, 2016–2023 (USD Million)
Table 112 Spain: Cell Viability Assays Market, By Cell Type, 2016–2023 (USD Million)
Table 113 Spain: Cell Viability Assays Market, By Application, 2016–2023 (USD Million)
Table 114 Spain: Cell Viability Assays Market, By End User, 2016–2023 (USD Million)
Table 115 RoE: Cell Viability Assays Market, By Product, 2016–2023 (USD Million)
Table 116 RoE: Cell Viability Consumables Market, By Type, 2016–2023 (USD Million)
Table 117 RoE: Cell Viability Assay Kits Market, By Type, 2016–2023 (USD Million)
Table 118 RoE: Cell Viability Tetrazolium Reduction Assay Kits Market, By Type, 2016–2023 (USD Million)
Table 119 RoE: Cell Viability Instruments Market, By Type, 2016–2023 (USD Million)
Table 120 RoE: Cell Viability Assays Market, By Cell Type, 2016–2023 (USD Million)
Table 121 RoE: Cell Viability Assays Market, By Application, 2016–2023 (USD Million)
Table 122 RoE: Cell Viability Assays Market, By End User, 2016–2023 (USD Million)
Table 123 Asia Pacific: Cell Viability Assays Market, By Country, 2016–2023 (USD Million)
Table 124 Asia Pacific: Cell Viability Assays Market, By Product, 2016–2023 (USD Million)
Table 125 Asia Pacific: Cell Viability Consumables Market, By Type, 2016–2023 (USD Million)
Table 126 Asia Pacific: Cell Viability Assay Kits Market, By Type, 2016–2023 (USD Million)
Table 127 Asia Pacific: Cell Viability Tetrazolium Reduction Assay Kits Market, By Type, 2016–2023 (USD Million)
Table 128 Asia Pacific: Cell Viability Instruments Market, By Type, 2016–2023 (USD Million)
Table 129 Asia Pacific: Cell Viability Assays Market, By Cell Type, 2016–2023 (USD Million)
Table 130 Asia Pacific: Cell Viability Assays Market, By Application, 2016–2023 (USD Million)
Table 131 Asia Pacific: Cell Viability Assays Market, By End User, 2016–2023 (USD Million)
Table 132 Japan: Cell Viability Assays Market, By Product, 2016–2023 (USD Million)
Table 133 Japan: Cell Viability Consumables Market, By Type, 2016–2023 (USD Million)
Table 134 Japan: Cell Viability Assay Kits Market, By Type, 2016–2023 (USD Million)
Table 135 Japan: Cell Viability Tetrazolium Reduction Assay Kits Market, By Type, 2016–2023 (USD Million)
Table 136 Japan: Cell Viability Instruments Market, By Type, 2016–2023 (USD Million)
Table 137 Japan: Cell Viability Assays Market, By Cell Type, 2016–2023 (USD Million)
Table 138 Japan: Cell Viability Assays Market, By Application, 2016–2023 (USD Million)
Table 139 Japan: Cell Viability Assays Market, By End User, 2016–2023 (USD Million)
Table 140 China: Cell Viability Assays Market, By Product, 2016–2023 (USD Million)
Table 141 China: Cell Viability Consumables Market, By Type, 2016–2023 (USD Million)
Table 142 China: Cell Viability Assay Kits Market, By Type, 2016–2023 (USD Million)
Table 143 China: Cell Viability Tetrazolium Reduction Assay Kits Market, By Type, 2016–2023 (USD Million)
Table 144 China: Cell Viability Instruments Market, By Type, 2016–2023 (USD Million)
Table 145 China: Cell Viability Assays Market, By Cell Type, 2016–2023 (USD Million)
Table 146 China: Cell Viability Assays Market, By Application, 2016–2023 (USD Million)
Table 147 China: Cell Viability Assays Market, By End User, 2016–2023 (USD Million)
Table 148 India: Cell Viability Assays Market, By Product, 2016–2023 (USD Million)
Table 149 India: Cell Viability Consumables Market, By Type, 2016–2023 (USD Million)
Table 150 India: Cell Viability Assay Kits Market, By Type, 2016–2023 (USD Million)
Table 151 India: Cell Viability Tetrazolium Reduction Assay Kits Market, By Type, 2016–2023 (USD Million)
Table 152 India: Cell Viability Instruments Market, By Type, 2016–2023 (USD Million)
Table 153 India: Cell Viability Assays Market, By Cell Type, 2016–2023 (USD Million)
Table 154 India: Cell Viability Assays Market, By Application, 2016–2023 (USD Million)
Table 155 India: Cell Viability Assays Market, By End User, 2016–2023 (USD Million)
Table 156 RoAPAC: Cell Viability Assays Market, By Product, 2016–2023 (USD Million)
Table 157 RoAPAC: Cell Viability Consumables Market, By Type, 2016–2023 (USD Million)
Table 158 RoAPAC: Cell Viability Assay Kits Market, By Type, 2016–2023 (USD Million)
Table 159 RoAPAC: Cell Viability Tetrazolium Reduction Assay Kits Market, By Type, 2016–2023 (USD Million)
Table 160 RoAPAC: Cell Viability Instruments Market, By Type, 2016–2023 (USD Million)
Table 161 RoAPAC: Cell Viability Assays Market, By Cell Type, 2016–2023 (USD Million)
Table 162 RoAPAC: Cell Viability Assays Market, By Application, 2016–2023 (USD Million)
Table 163 RoAPAC: Cell Viability Assays Market, By End User, 2016–2023 (USD Million)
Table 164 Latin America: Cell Viability Assays Market, By Product, 2016–2023 (USD Million)
Table 165 Latin America: Cell Viability Consumables Market, By Type, 2016–2023 (USD Million)
Table 166 Latin America: Cell Viability Assay Kits Market, By Type, 2016–2023 (USD Million)
Table 167 Latin America: Cell Viability Tetrazolium Reduction Assay Kits Market, By Type, 2016–2023 (USD Million)
Table 168 Latin America: Cell Viability Instruments Market, By Type, 2016–2023 (USD Million)
Table 169 Latin America: Cell Viability Assays Market, By Cell Type, 2016–2023 (USD Million)
Table 170 Latin America: Cell Viability Assays Market, By Application, 2016–2023 (USD Million)
Table 171 Latin America: Cell Viability Assays Market, By End User, 2016–2023 (USD Million)
Table 172 Middle East & Africa: Cell Viability Assays Market, By Product, 2016–2023 (USD Million)
Table 173 Middle East & Africa: Cell Viability Consumables Market, By Type, 2016–2023 (USD Million)
Table 174 Middle East & Africa: Cell Viability Assay Kits Market, By Type, 2016–2023 (USD Million)
Table 175 Middle East & Africa: Cell Viability Tetrazolium Reduction Assay Kits Market, By Type, 2016–2023 (USD Million)
Table 176 Middle East & Africa: Cell Viability Instruments Market, By Type, 2016–2023 (USD Million)
Table 177 Middle East & Africa: Cell Viability Assays Market, By Cell Type, 2016–2023 (USD Million)
Table 178 Middle East & Africa: Cell Viability Assays Market, By Application, 2016–2023 (USD Million)
Table 179 Middle East & Africa: Cell Viability Assays Market, By End User, 2016–2023 (USD Million)
Table 180 Growth Strategy Matrix (2015–2018)
Table 181 Product Launches, 2015–2018
Table 182 Expansions, 2015–2018
Table 183 Acquisitions, 2015–2018
Table 184 Other Strategies, 2015–2018
List of Figures (39 Figures)
Figure 1 Research Design
Figure 2 Primary Sources
Figure 3 Breakdown of Primary Interviews (Supply Side): By Company Type, Designation, and Region
Figure 4 Breakdown of Primary Interviews (Demand Side): By End User, Designation, and Region
Figure 5 Bottom-Up Approach
Figure 6 Top-Down Approach
Figure 7 Data Triangulation Methodology
Figure 8 Cell Viability Assays Market, By Product, 2018 vs 2023 (USD Million)
Figure 9 Cell Viability Instruments Market, By Type, 2018 vs 2023 (USD Million)
Figure 10 Cell Viability Consumables Market, By Type, 2018 vs 2023 (USD Million)
Figure 11 Cell Viability Assays Market, By Cell Type, 2018 vs 2023 (USD Million)
Figure 12 Cell Viability Assays Market, By Application, 2018 vs 2023 (USD Million)
Figure 13 Cell Viability Assays Market, By End User, 2018 vs 2023 (USD Million)
Figure 14 Geographical Snapshot of the Cell Viability Assays Market
Figure 15 Rising Incidence and Prevalence of Chronic and Infectious Diseases is Expected to Drive Market Growth
Figure 16 The US Held the Largest Share of the Market in 2017
Figure 17 APAC to Register the Highest Growth Rate During the Forecast Period (2018–2023)
Figure 18 Pharmaceutical and Biotechnology Companies Accounted for the Largest Share of the APAC Cell Viability Assays Market in 2017
Figure 19 Developing Markets to Register A Higher Growth Rate During the Forecast Period
Figure 20 Reagents to Dominate the Cell Viability Consumables Market During the Forecast Period
Figure 21 Automated Cell Counters to Dominate the Cell Viability Instruments Market During the Forecast Period
Figure 22 Human Cells Segment to Witness the Highest Growth Rate During the Forecast Period (2018–2023)
Figure 23 Drug Discovery and Development Estimated to Be the Largest Application of Cell Viability Assays in 2018
Figure 24 Cell Viability Assays Market, By End User, 2018 vs 2023 (USD Million)
Figure 25 Cell Viability Assays Market: Geographic Snapshot (2017)
Figure 26 North America: Cell Viability Assays Market Snapshot
Figure 27 NIH Funding on Stem Cell Research, 2013–2016 (USD Billion)
Figure 28 Europe: Cell Viability Assays Market Snapshot
Figure 29 Asia Pacific: Cell Viability Assays Market Snapshot
Figure 30 Product Launches—Key Growth Strategy Adopted By Market Players From 2015 to May 2018
Figure 31 Cell Viability Assay Kits Market, By Key Player, 2017
Figure 32 Thermo Fisher Scientific: Company Snapshot (2017)
Figure 33 Merck KGaA: Company Snapshot (2017)
Figure 34 Bio-Rad Laboratories: Company Snapshot (2017)
Figure 35 GE Healthcare: Company Snapshot (2017)
Figure 36 Danaher Corporation: Company Snapshot (2017)
Figure 37 Becton, Dickinson and Company: Company Snapshot (2017)
Figure 38 Abcam PLC: Company Snapshot (2017)
Figure 39 Perkinelmer: Company Snapshot (2017)

 Generating Response ...


Growth opportunities and latent adjacency in Cell Viability Assays Market