Carbon Credit Trading Platform Market Size, Share and Trends

Carbon Credit Trading Platform Market by Type (Voluntary, Regulated), System Type (Cap and Trade, Baseline and Credit), End Use (Industrial, Utilities, Energy, Petrochemical, Aviation) and Region - Global Forecast to 2027

Report Code: EP 8509 Nov, 2022, by marketsandmarkets.com

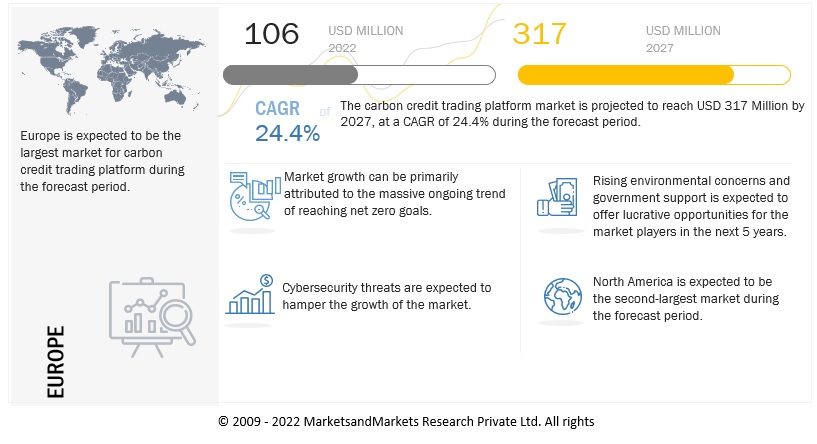
[184 Pages Report] The carbon credit trading platform market is expected to grow from an estimated USD 106 million in 2022 to USD 317 million by 2027, at a CAGR of 24.4% during the forecast period. The increasing demand for carbon credit trading platforms is due to the strong eagerness of industries and businesses to act on climate change and reduce global warming. Also, the demand is driven by the rising investments in carbon capture technologies as well as renewable energy adoption.
Carbon Credit Trading Platform Market

To know about the assumptions considered for the study, Request for Free Sample Report

Carbon Credit Trading Platform Market Dynamics

Driver: Rising number of markets permitting the partial use of carbon credits

The world is working towards achieving the net zero goals. Climate change entails a whole economic transition. Navigating consequent risks and opportunities require a mix of innovative tools including carbon credits. The increasing demand for carbon credits in the upcoming years is a driving factor for the carbon trading platforms. The carbon credit is treated as a financial tool to reduce (not increase) carbon emissions by storing carbons for future or later use. Many businesses are now adopting this technique of partially using carbon credits which is benefitting them a lot. They use as much as they want according to the limit set for a project and if they have few left, it is then used later for another project. This not only helps them to save a lot of money but also invest in more such credits in the future when required. Hence, these permissions help in driving the market for carbon credit

Restraints: Transparency and Traceability issues in the market

The increasing price of carbon credits may act as a market restraint in the forecast period. There is a fluctuation in prices and hence the rising prices and demand is leading to high transaction volumes.

Opportunities: Growing regulatory (compliance) and industry association requirements

Though carbon offset credits used to be common in the Voluntary Carbon Market (VCM), it is observed that there is a rising trend of their inclusion in the compliance markets. The China Emissions Trading System (ETS) is one example given. Other examples are the case of Singapore and California. The EU ETS is the largest ETS in the world and has a  strong  presence and aims to ban the use of carbon offsets and credits in its low-carbon transition. The regulatory/compliance markets covers sectors that are working actively towards achieving the net zero goals. There is a high reliability on carbon offsets and trading of carbon credits, to achieve the net zero commitments.

Challenges: Trading Platforms involve fraudulent activities because of a lack of cyber security

Fraudulent activities hamper the growth of the Carbon Credit Trading Platform market. The European Union Emission Trading System (EU ETS) has experienced the fraudulent traders in the past years. The activity has resulted in losses of approximately 5 billion euros for several national tax revenues. The preventive measures for these fraudulent activities have been adopted by countries, that is changing the taxation rules on the transactions. The lack of cybersecurity can cause huge loss and can destabilize the trust of consumers and businesses to engage in the digital trade.
Carbon Credit Trading Platform Market Size, and Share

To know about the assumptions considered for the study, download the pdf brochure

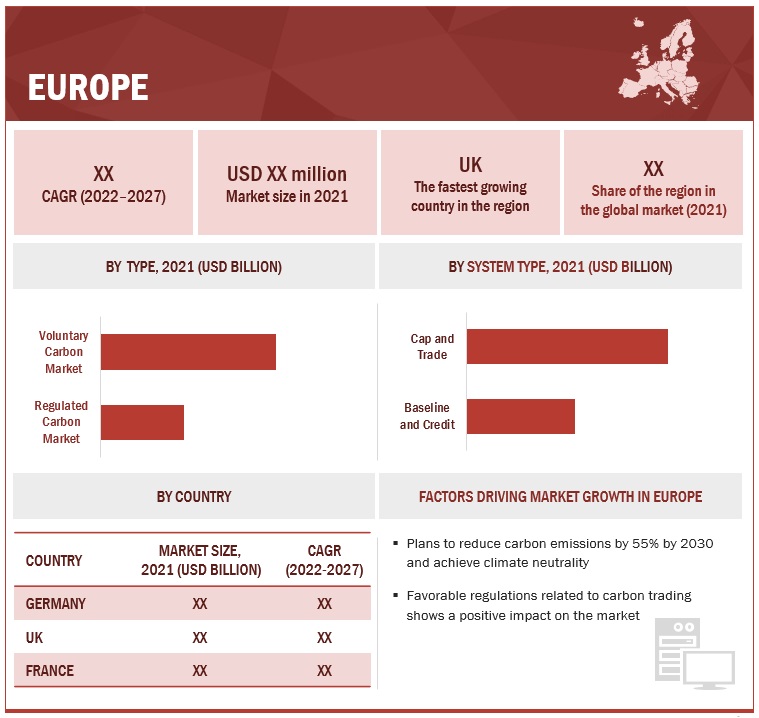
The cap and trade segment by system type expected to hold the largest market share from 2022 to 2027

Based on the system type, cap and trade is estimated to be the largest market from 2020 to 2027. The cap and trade system allows the market to determine a carbon price, and that price drives investment decisions and market innovation. Thus, it boosts the demand for the carbon credit trading platform. The cap and trade system creates an exchange value for emissions. Companies with emissions credits can sell them to gain profits, creating a new earning source for industries. Hence, this segment is expected to witness a higher growth rate during the forecast period.

Utilities followed by the industrial segment is projected to emerge as the largest segment, by end use, in the carbon credit trading platform market

Based on the end use, utilities is projected to hold the highest market share during the forecast period. Power companies are now focusing on ecology and pursuing innovative approaches and global best practices for reducing carbon emissions significantly. The use of higher efficiency conventional fuel technologies and lesser emission-intensive fuels, evaluation and implementation of new and renewable energy facets demonstrate companies’ environmental commitment. Carbon emissions from the power sector and electrical companies are increasing rapidly; therefore, there is an urgent need for decarbonization in these sectors, which eventually propels the demand for carbon credits. The market for the industrial segment is growing owing to the increased emissions over the years due to heavy manufacturing and industrial activities. Heavy industries are creating maximum environmental impact as their daily operations emit greenhouse gases, leading to global warming. These industries are focused on executing decarbonization initiatives to tackle climate change, driving the demand for carbon credit trading platforms. The need for carbon trading and demand for carbon credits play a crucial role.

Asia Pacific is expected to be the fastest growing market during the forecast period.

In Asia Pacific, the leading national emission trading system (ETS) is in the Republic of Korea. China is seeking an emission trading system (ETS) that fits with its context, offers flexibility, is without major faults, and can improve operations. This seeks to identify practical solutions for the successful design and implementation of national emissions trading systems in Asia, increase their consistency and harmonization and encourage connectivity at a regional and international level. Hence, the demand for carbon credits to control carbon emissions will rise substantially, further driving the growth of the carbon credit trading platform market in this region.

Key Players

Intercontinental Exchange, Inc. (US), Nasdaq, Inc. (US), CME Group (US), AirCarbon Exchange (ACX) (Singapore), Carbon Trade Exchange (CTX) (UK), Xpansiv (US), Carbonplace (England), Planetly (Germany), Likvidi (UK), Toucan (Germany), BetaCarbon (Australia), ClimateTrade (US), Carbon Credit Capital (US), Flowcarbon (US), Carbonex (UK)
Carbon Credit Trading Platform Market Size, and Share

Want to explore hidden markets that can drive new revenue in Carbon Credit Trading Platform Market?

Scope of the Report

Report Metric

Details

Market Revenue in 2022

$106 million

Estimated Value by 2027

$317 million

Growth Rate

Poised to grow at a CAGR of 24.4%

Largest Share Segments

  • Power Sector and Electrical Companies

Market Report Segmentation

type, system type, end-use, and region

Growth Drivers

  • Escalating carbon emissions leading to global warming
  • Rising number of markets permitting partial use of carbon offsets
  • Increasing investments in carbon capture and removal technologies

Growth Opportunities
  • Growing number of regulatory (compliance) standards and industry association requirements

Geographies covered

Asia Pacific, North America, Europe, and Rest of the World

Companies covered

Nasdaq Inc. (US), EEX Group (Germany), AirCarbon Exchange (Singapore), Carbon Trade Exchange (UK), Xpansiv (US), CME Group (US), Climate Impact X (Singapore), Carbonplace (England), Planetly (Germany), Likvidi (UK), Toucan (Germany), BetaCarbon (Australia), MOSS.Earth (Brazil), ClimateTrade (US), Carbon Credit Capital (US), Flowcarbon (US), Carbonex (UK), PathZero (Australia), South Pole (Switzerland), Public Investment Fund (Saudi Arabia)

This research report categorizes the carbon credit trading platform market based on type, system type, end-use, and region.

Based on type:

  • Voluntary Carbon Market
  • Regulated Carbon Market

Based on system type:

  • Cap and Trade
  • Baseline and Credit

Based on end use:

  • Industrial
  • Utilities
  • Energy
  • Petrochemical
  • Aviation
  • Others

Based on the region:

  • North America
  • Asia Pacific
  • Europe
  • Rest of the World

Recent Developments

  • In July 2022, Aircarbon exchange (ACX), signed a collaboration agreement with the Nairobi international financial center (NIFC) and the Nairobi Securities Exchange (NSE) to develop a Kenya carbon exchange during the official launch of the Nairobi international financial center (NIFC). The partnership will establish a carbon ecosystem in Kenya connected to ACX’s international client order book, allowing buyers and sellers, international and domestic, to transact efficiently and transparently.
  • In March 2022, CarbonX, a carbon asset developer, has signed a memorandum of understanding (MOU) with the AirCarbon exchange (ACX) to develop a carbon marketplace in Indonesia jointly. The partnership will provide Indonesian carbon project developers with a domestic carbon market linked to ACX's international client order book. Also, the carbon marketplace will allow the growing Indonesian carbon market to rapidly scale up.
  • In September 2021, CTX & IBAC –Partnership to support Business Aviation Voluntary Commitments on Climate Change. The International Business Aviation Council (IBAC) represents over 18,000 operators worldwide on Aviation emissions reductions.

Frequently Asked Questions (FAQ):

To speak to our analyst for a discussion on the above findings, click Speak to Analyst

Exclusive indicates content/data unique to MarketsandMarkets and not available with any competitors.

TABLE OF CONTENTS
 
1 INTRODUCTION (Page No. - 23)
    1.1 STUDY OBJECTIVES 
    1.2 MARKET DEFINITION 
    1.3 INCLUSIONS AND EXCLUSIONS 
           1.3.1 MARKET, BY TYPE
           1.3.2 MARKET, BY SYSTEM TYPE
           1.3.3 MARKET, BY END USE
           1.3.4 MARKET, BY REGION
    1.4 MARKET SCOPE 
           1.4.1 MARKET SEGMENTATION
           1.4.2 REGIONAL SCOPE
           1.4.3 YEARS CONSIDERED
    1.5 CURRENCY CONSIDERED 
    1.6 LIMITATIONS 
    1.7 STAKEHOLDERS 
 
2 RESEARCH METHODOLOGY (Page No. - 28)
    2.1 RESEARCH DATA 
           FIGURE 1 MARKET: RESEARCH DESIGN
    2.2 MARKET BREAKDOWN AND DATA TRIANGULATION 
           FIGURE 2 DATA TRIANGULATION
           2.2.1 SECONDARY DATA
                    2.2.1.1 Key data from secondary sources
           2.2.2 PRIMARY DATA
                    2.2.2.1 Breakdown of primaries
                    2.2.2.2 Key data from primary sources
                               FIGURE 3 BREAKDOWN OF PRIMARY INTERVIEWS: BY COMPANY TYPE, DESIGNATION,  AND REGION
                               FIGURE 4 MAIN METRICS CONSIDERED WHILE ANALYZING AND ASSESSING DEMAND  FOR CARBON CREDIT TRADING PLATFORMS
    2.3 MARKET SIZE ESTIMATION 
           2.3.1 BOTTOM-UP APPROACH
                    FIGURE 5 MARKET SIZE ESTIMATION METHODOLOGY: BOTTOM-UP APPROACH
           2.3.2 TOP-DOWN APPROACH
                    FIGURE 6 MARKET SIZE ESTIMATION METHODOLOGY: TOP-DOWN APPROACH
           2.3.3 DEMAND-SIDE ANALYSIS
                    2.3.3.1 Regional analysis
                    2.3.3.2 Country-level analysis
                    2.3.3.3 Demand-side assumptions
                    2.3.3.4 Demand-side calculations
           2.3.4 SUPPLY-SIDE ANALYSIS
                    FIGURE 7 KEY STEPS CONSIDERED FOR ASSESSING SUPPLY OF CARBON CREDIT TRADING PLATFORMS
                    FIGURE 8 MARKET: SUPPLY-SIDE ANALYSIS
                    2.3.4.1 Supply-side calculations
                    2.3.4.2 Supply-side assumptions
           2.3.5 FORECAST
 
3 EXECUTIVE SUMMARY (Page No. - 40)
    TABLE 1 MARKET SNAPSHOT 
    FIGURE 9 EUROPE DOMINATED GLOBAL CARBON CREDIT TRADING PLATFORM  MARKET IN 2021 
    FIGURE 10 REGULATED CARBON MARKET SEGMENT TO ACCOUNT FOR LARGER SHARE OF MARKET, BY TYPE, FROM 2022 TO 2027 
    FIGURE 11 CAP AND TRADE SEGMENT TO COMMAND MARKET, BY SYSTEM TYPE, THROUGHOUT FORECAST PERIOD 
    FIGURE 12 UTILITIES SEGMENT TO DOMINATE MARKET, BY END USE, THROUGHOUT FORECAST PERIOD 
 
4 PREMIUM INSIGHTS (Page No. - 45)
    4.1 ATTRACTIVE OPPORTUNITIES FOR KEY PLAYERS IN MARKET 
           FIGURE 13 STRATEGIES DRIVING NET-ZERO GOALS TO BOOST MARKET BETWEEN 2022 AND 2027
    4.2 MARKET, BY REGION 
           FIGURE 14 ASIA PACIFIC TO EXHIBIT HIGHEST CAGR IN GLOBAL MARKET DURING FORECAST PERIOD
    4.3 EUROPE: MARKET,  BY TYPE AND COUNTRY, 2021 
           FIGURE 15 REGULATED CARBON MARKET SEGMENT AND UK ACCOUNTED FOR  LARGEST MARKET SHARES IN EUROPE IN 2021
    4.4 MARKET, BY TYPE 
           FIGURE 16 REGULATED CARBON MARKET SEGMENT TO ACCOUNT FOR LARGER MARKET SHARE IN 2027
    4.5 MARKET, BY SYSTEM TYPE 
           FIGURE 17 CAP AND TRADE SEGMENT TO HOLD LARGER MARKET SHARE THAN BASELINE AND CREDIT SEGMENT IN 2027
    4.6 MARKET, BY END USE 
           FIGURE 18 UTILITIES SEGMENT TO DOMINATE MARKET, BY END USE, IN 2027
 
5 MARKET OVERVIEW (Page No. - 48)
    5.1 INTRODUCTION 
    5.2 MARKET DYNAMICS 
           FIGURE 19 MARKET: DRIVERS, RESTRAINTS, OPPORTUNITIES, AND CHALLENGES
           5.2.1 DRIVERS
                    5.2.1.1 Escalating carbon emissions leading to global warming
                               FIGURE 20 GLOBAL ENERGY-RELATED CO2 EMISSIONS, 2010 TO 2021
                    5.2.1.2 Rising number of markets permitting partial use of  carbon offsets
                               FIGURE 21 ANNUAL INVESTMENT IN CLEAN ENERGY, ENERGY EFFICIENCY,  AND INFRASTRUCTURE PROJECTS (USD BILLION)
                    5.2.1.3 Increasing investments in carbon capture and removal technologies
                               TABLE 2 MAJOR INVESTMENTS TO REDUCE CARBON FOOTPRINTS
           5.2.2 RESTRAINTS
                    5.2.2.1 Lack of market transparency and traceability
           5.2.3 OPPORTUNITIES
                    5.2.3.1 Growing number of regulatory (compliance) standards and industry association requirements
                               TABLE 3 STATUS AND SECTORS COVERED IN EMISSION TRADING SCHEMES WORLDWIDE, 2021
                               TABLE 4 CREDITS ISSUED, REGISTERED ACTIVITIES, AVERAGE 2021 PRICE,  AND SECTORS COVERED BY CREDITING MECHANISMS
           5.2.4 CHALLENGES
                    5.2.4.1 Fraudulent activities on trading platforms due to lack of cybersecurity
                               FIGURE 22 GLOBAL CARBON MARKET ANNUAL TRADING VALUE,  2012–2021 (USD BILLION)
    5.3 TRENDS/DISRUPTIONS IMPACTING CUSTOMER BUSINESS 
           5.3.1 REVENUE SHIFT AND NEW REVENUE POCKETS FOR CARBON CREDIT TRADING PLATFORM PROVIDERS
                    FIGURE 23 REVENUE SHIFT FOR PROVIDERS OF CARBON CREDIT TRADING PLATFORMS
    5.4 TECHNOLOGY ANALYSIS 
           5.4.1 DEVELOPMENT OF BLOCKCHAIN-BASED CARBON CREDIT PLATFORM
    5.5 MARKET MAPPING 
           FIGURE 24 MARKET MAPPING: MARKET
           TABLE 5 MARKET PLAYER: ROLE IN ECOSYSTEM
    5.6 VALUE CHAIN ANALYSIS 
           FIGURE 25 VALUE CHAIN ANALYSIS: MARKET
           5.6.1 PROJECT DEVELOPERS
           5.6.2 EXCHANGE PARTNERS
           5.6.3 TRADERS/BROKERS/CARBON EMITTERS
           5.6.4 END USERS/CARBON EMITTERS
    5.7 PRICING ANALYSIS 
           5.7.1 AVERAGE SELLING PRICE OF CARBON CREDIT, BY TYPE
                    TABLE 6 AVERAGE SELLING PRICE OF CARBON CREDIT, 2021
                    TABLE 7 REGION-WISE AVERAGE SELLING PRICE OF CARBON CREDIT, BY TYPE, 2021
                    FIGURE 26 AVERAGE SELLING PRICE OF CARBON CREDIT TYPES, BY REGION
    5.8 KEY CONFERENCES AND EVENTS, 2022–2024 
           TABLE 8 MARKET: LIST OF CONFERENCES AND EVENTS
           5.8.1 REGULATORY BODIES, GOVERNMENT AGENCIES,  AND OTHER ORGANIZATIONS
                    TABLE 9 NORTH AMERICA: LIST OF REGULATORY BODIES, GOVERNMENT AGENCIES,  AND OTHER ORGANIZATIONS
                    TABLE 10 EUROPE: LIST OF REGULATORY BODIES, GOVERNMENT AGENCIES,  AND OTHER ORGANIZATIONS
                    TABLE 11 ASIA PACIFIC: LIST OF REGULATORY BODIES, GOVERNMENT AGENCIES,  AND OTHER ORGANIZATIONS
                    TABLE 12 REST OF THE WORLD: LIST OF REGULATORY BODIES, GOVERNMENT AGENCIES,  AND OTHER ORGANIZATIONS
           5.8.2 CODES AND REGULATIONS RELATED TO ENERGY MANAGEMENT SYSTEMS
                    TABLE 13 MARKET: CODES AND REGULATIONS
    5.9 INNOVATIONS AND PATENT REGISTRATIONS 
           TABLE 14 MARKET: INNOVATIONS AND  PATENT REGISTRATIONS, JANUARY 2020–DECEMBER 2021
    5.10 PORTER’S FIVE FORCES ANALYSIS 
           FIGURE 27 PORTER’S FIVE FORCES ANALYSIS FOR MARKET
           TABLE 15 MARKET: PORTER’S FIVE FORCES ANALYSIS
           5.10.1 THREAT OF SUBSTITUTES
           5.10.2 BARGAINING POWER OF SUPPLIERS
           5.10.3 BARGAINING POWER OF BUYERS
           5.10.4 THREAT OF NEW ENTRANTS
           5.10.5 INTENSITY OF COMPETITIVE RIVALRY
    5.11 KEY STAKEHOLDERS AND BUYING CRITERIA 
           5.11.1 KEY STAKEHOLDERS IN BUYING PROCESS
                    FIGURE 28 INFLUENCE OF KEY STAKEHOLDERS ON BUYING PROCESS FOR TOP 3 END USES
                    TABLE 16 INFLUENCE OF KEY STAKEHOLDERS ON BUYING PROCESS FOR TOP 3 END USES
    5.12 BUYING CRITERIA 
                    FIGURE 29 KEY BUYING CRITERIA FOR TOP 3 END USES
                    TABLE 17 KEY BUYING CRITERIA FOR TOP 3 END USES
    5.13 CASE STUDY ANALYSIS 
           5.13.1 BANCO SABADELL TO MOVE FORWARD WITH CARBON OFFSETTING WITH CLIMATE TRADE
                    5.13.1.1 Problem statement: 2021
                    5.13.1.2 Solution
           5.13.2 BEN & JERRY’S OFFSET PROVIDES SEED FUNDING FOR MORE SUSTAINABLE AGRICULTURE
                    5.13.2.1 Problem statement: 2021
                    5.13.2.2 Solution
 
6 MARKET, BY TYPE (Page No. - 79)
    6.1 INTRODUCTION 
           FIGURE 30 MARKET, BY TYPE, 2021
           TABLE 18 MARKET, BY TYPE, 2020–2027 (USD MILLION)
    6.2 VOLUNTARY CARBON MARKET 
           6.2.1 LAUNCH OF PARIS AGREEMENT TO ACHIEVE NET-ZERO GOALS TO DRIVE MARKET
                    TABLE 19 VOLUNTARY CARBON MARKET: MARKET, BY REGION, 2020–2027 (USD MILLION)
    6.3 REGULATED CARBON MARKET 
           6.3.1 LEGALLY BINDING COMPLIANCE REGIMES FOR EMISSION REDUCTION TO PUSH MARKET GROWTH
                    TABLE 20 REGULATED CARBON MARKET: MARKET,  BY REGION, 2020–2027 (USD MILLION)
 
7 MARKET, BY SYSTEM TYPE (Page No. - 83)
    7.1 INTRODUCTION 
           FIGURE 31 MARKET, BY SYSTEM TYPE, 2021
           TABLE 21 MARKET, BY SYSTEM TYPE,  2020–2027 (USD MILLION)
    7.2 CAP AND TRADE 
           7.2.1 WIDE ACCEPTANCE OF CAP AND TRADE PROGRAMS GLOBALLY TO PROPEL MARKET GROWTH
                    TABLE 22 CAP AND TRADE: MARKET, BY REGION,  2020–2027 (USD MILLION)
    7.3 BASELINE AND CREDIT 
           7.3.1 HIGH ADOPTION OF DECARBONIZATION STRATEGIES TO SUPPORT MARKET GROWTH
                    TABLE 23 BASELINE AND CREDIT: MARKET, BY REGION, 2020–2027 (USD MILLION)
 
8 MARKET, BY END USE (Page No. - 87)
    8.1 INTRODUCTION 
           FIGURE 32 MARKET, BY END USE, 2021
           TABLE 24 MARKET, BY END USE, 2020–2027 (USD MILLION)
    8.2 INDUSTRIAL 
           8.2.1 ADDRESSING CLIMATE CHANGE ISSUES THROUGH DECARBONIZATION INITIATIVES TO BOOST MARKET
                    TABLE 25 INDUSTRIAL: MARKET, BY REGION,  2020–2027 (USD MILLION)
    8.3 UTILITIES 
           8.3.1 ADOPTION OF ECO-FRIENDLY TECHNOLOGIES IN DECARBONIZATION PROJECTS TO PROPEL MARKET GROWTH
                    TABLE 26 UTILITIES: MARKET, BY REGION,  2020–2027 (USD MILLION)
    8.4 ENERGY 
           8.4.1 COMMITMENT OF MANY COMPANIES TO REACH NET-ZERO CARBON EMISSIONS BY 2050 TO CREATE OPPORTUNITIES FOR VOLUNTARY CARBON CREDITS
                    TABLE 27 ENERGY: MARKET, BY REGION,  2020–2027 (USD MILLION)
    8.5 PETROCHEMICAL 
           8.5.1 REGULATING EMBEDDED EMISSIONS DURING PRODUCTION TO HELP REDUCE EMISSIONS AND PETROCHEMICAL WASTE
                    TABLE 28 PETROCHEMICAL: MARKET, BY REGION,  2020–2027 (USD MILLION)
    8.6 AVIATION 
           8.6.1 IATA’S COMMITMENT TO ACHIEVE NET ZERO EMISSIONS BY 2050 TO ENCOURAGE AIRLINES TO ADOPT CARBON CREDIT TRADING PLATFORM
                    TABLE 29 AVIATION: MARKET, BY REGION,  2020–2027 (USD MILLION)
    8.7 OTHERS 
           TABLE 30 OTHERS: MARKET, BY REGION,  2020–2027 (USD MILLION)
 
9 MARKET, BY REGION (Page No. - 95)
    9.1 INTRODUCTION 
           FIGURE 33 ASIA PACIFIC EXPECTED TO BE FASTEST-GROWING MARKET FOR CARBON CREDIT TRADING PLATFORMS DURING FORECAST PERIOD
           FIGURE 34 MARKET, BY REGION, 2021 (%)
           TABLE 31 MARKET, BY REGION, 2020–2027 (USD MILLION)
    9.2 EUROPE 
           FIGURE 35 EUROPE: MARKET SNAPSHOT
           9.2.1 BY TYPE
                    TABLE 32 EUROPE: MARKET, BY TYPE,  2020–2027 (USD MILLION)
           9.2.2 BY SYSTEM TYPE
                    TABLE 33 EUROPE: MARKET, BY SYSTEM TYPE,  2020–2027 (USD MILLION)
           9.2.3 BY END USE
                    TABLE 34 EUROPE: MARKET, BY END USE,  2020–2027 (USD MILLION)
           9.2.4 BY COUNTRY
                    TABLE 35 EUROPE: MARKET, BY COUNTRY,  2020–2027 (USD MILLION)
                    9.2.4.1 Germany
                               9.2.4.1.1 Commitment toward climate protection to stimulate market growth
                               TABLE 36 GERMANY: MARKET, BY END USE,  2020–2027 (USD MILLION)
                    9.2.4.2 UK
                               9.2.4.2.1 Incentivization of smart UK ETS for GHG emission reduction to push market growth
                               TABLE 37 UK: MARKET, BY END USE,  2020–2027 (USD MILLION)
                    9.2.4.3 France
                               9.2.4.3.1 Increasing investments in decarbonization to accelerate market growth
                               TABLE 38 FRANCE: MARKET, BY END USE,  2020–2027 (USD MILLION)
                    9.2.4.4 Spain
                               9.2.4.4.1 Large and complex refining industry to propel market growth
                               TABLE 39 SPAIN: MARKET, BY END USE,  2020–2027 (USD MILLION)
                    9.2.4.5 Rest of Europe
                               TABLE 40 REST OF EUROPE: MARKET, BY END USE,  2020–2027 (USD MILLION)
    9.3 NORTH AMERICA 
           FIGURE 36 NORTH AMERICA: MARKET SNAPSHOT
           9.3.1 BY TYPE
                    TABLE 41 NORTH AMERICA: MARKET, BY TYPE,  2020–2027 (USD MILLION)
           9.3.2 BY SYSTEM TYPE
                    TABLE 42 NORTH AMERICA: MARKET, BY SYSTEM TYPE, 2020–2027 (USD MILLION)
           9.3.3 BY END USE
                    TABLE 43 NORTH AMERICA: MARKET, BY END USE,  2020–2027 (USD MILLION)
           9.3.4 BY COUNTRY
                    TABLE 44 NORTH AMERICA: MARKET, BY COUNTRY,  2020–2027 (USD MILLION)
                    9.3.4.1 US
                               9.3.4.1.1 Country’s goal to achieve net-zero target to drive market growth
                               TABLE 45 US: MARKET, BY END USE,  2020–2027 (USD MILLION)
                    9.3.4.2 Canada
                               9.3.4.2.1 Rising focus of natural gas and oil industry on reducing GHG emissions to propel market growth
                               TABLE 46 CANADA: MARKET, BY END USE,  2020–2027 (USD MILLION)
                    9.3.4.3 Mexico
                               9.3.4.3.1 Implementation of carbon tax and emission trading system to boost demand for carbon credit trading platforms
                               TABLE 47 MEXICO: MARKET, BY END USE,  2020–2027 (USD MILLION)
    9.4 ASIA PACIFIC 
           9.4.1 BY TYPE
                    TABLE 48 ASIA PACIFIC: MARKET, BY TYPE,  2020–2027 (USD MILLION)
           9.4.2 BY SYSTEM TYPE
                    TABLE 49 ASIA PACIFIC: MARKET, BY SYSTEM TYPE,  2020–2027 (USD MILLION)
           9.4.3 BY END USE
                    TABLE 50 ASIA PACIFIC: MARKET, BY END USE,  2020–2027 (USD MILLION)
           9.4.4 BY COUNTRY
                    TABLE 51 ASIA PACIFIC: MARKET, BY COUNTRY,  2020–2027 (USD MILLION)
                    9.4.4.1 China
                               9.4.4.1.1 Carbon-neutrality targets to create need for carbon trading platforms
                               TABLE 52 CHINA: MARKET, BY END USE,  2020–2027 (USD MILLION)
                    9.4.4.2 Japan
                               9.4.4.2.1 Adoption of carbon credit trading approach to support market growth
                               TABLE 53 JAPAN: MARKET, BY END USE,  2020–2027 (USD MILLION)
                    9.4.4.3 South Korea
                               9.4.4.3.1 Introduction of emission trading systems to accelerate market growth
                               TABLE 54 SOUTH KOREA: MARKET, BY END USE,  2020–2027 (USD MILLION)
                    9.4.4.4 New Zealand
                               9.4.4.4.1 New Zealand Emissions Trading Scheme to help reduce GHG emissions
                               TABLE 55 NEW ZEALAND: MARKET, BY END USE,  2020–2027 (USD MILLION)
                    9.4.4.5 Rest of Asia Pacific
                               TABLE 56 REST OF ASIA PACIFIC: MARKET, BY END USE, 2020–2027 (USD MILLION)
    9.5 REST OF THE WORLD 
           9.5.1 BY TYPE
                    TABLE 57 REST OF THE WORLD: MARKET, BY TYPE,  2020–2027 (USD MILLION)
           9.5.2 BY SYSTEM TYPE
                    TABLE 58 REST OF THE WORLD: MARKET, BY SYSTEM TYPE, 2020–2027 (USD MILLION)
           9.5.3 BY END USE
                    TABLE 59 REST OF THE WORLD: MARKET, BY END USE, 2020–2027 (USD MILLION)
           9.5.4 BY REGION
                    TABLE 60 REST OF THE WORLD: MARKET, BY REGION,  2020–2027 (USD MILLION)
                    9.5.4.1 South America
                               9.5.4.1.1 Voluntary carbon credits to drive market in South America
                    9.5.4.2 Middle East & Africa
                               9.5.4.2.1 Urgency to reduce CO2 emissions to boost market growth
 
10 COMPETITIVE LANDSCAPE (Page No. - 121)
     TABLE 61 OVERVIEW OF KEY STRATEGIES DEPLOYED BY TOP PLAYERS, AUGUST 2018–APRIL 2022 
     10.1 MARKET SHARE ANALYSIS OF TOP FIVE PLAYERS 
               TABLE 62 MARKET: DEGREE OF COMPETITION
               FIGURE 37 MARKET SHARE ANALYSIS, 2021
     10.2 REVENUE ANALYSIS OF TOP MARKET PLAYERS 
               FIGURE 38 TOP PLAYERS IN MARKET FROM  2017 TO 2021
     10.3 COMPANY EVALUATION QUADRANT, 2021 
             10.3.1 STARS
             10.3.2 PERVASIVE PLAYERS
             10.3.3 EMERGING LEADERS
             10.3.4 PARTICIPANTS
                       FIGURE 39 COMPETITIVE LEADERSHIP MAPPING: CARBON CREDIT TRADING PLATFORM, 2021
     10.4 START-UPS/SMES EVALUATION QUADRANT, 2021 
             10.4.1 PROGRESSIVE COMPANIES
             10.4.2 RESPONSIVE COMPANIES
             10.4.3 DYNAMIC COMPANIES
             10.4.4 STARTING BLOCKS
                       FIGURE 40 MARKET: START-UPS/SMES EVALUATION QUADRANT, 2021
     10.5 COMPETITIVE BENCHMARKING 
               TABLE 63 MARKET: DETAILED LIST OF KEY START-UPS/SMES
               TABLE 64 MARKET: COMPETITIVE BENCHMARKING OF KEY PLAYERS [START-UPS/SMES]
     10.6 CARBON CREDIT TRADING PLATFORM: COMPANY FOOTPRINT 
               TABLE 65 BY TYPE: COMPANY FOOTPRINT
               TABLE 66 BY SYSTEM TYPE: COMPANY FOOTPRINT
               TABLE 67 BY END USE: COMPANY FOOTPRINT
               TABLE 68 BY REGION: COMPANY FOOTPRINT
               TABLE 69 COMPANY FOOTPRINT
     10.7 COMPETITIVE SCENARIO 
               TABLE 70 MARKET: PRODUCT LAUNCHES,  JUNE 2022–FEBRUARY 2021
               TABLE 71 MARKET: DEALS, FEBRUARY 2021–AUGUST 2022
               TABLE 72 MARKET: OTHERS, JANUARY 2018–APRIL 2021
 
11 COMPANY PROFILES (Page No. - 139)
(Business overview, Products offered, Recent Developments, MNM view)*
     11.1 KEY PLAYERS 
             11.1.1 INTERCONTINENTAL EXCHANGE, INC.
                       TABLE 73 INTERCONTINENTAL EXCHANGE, INC.: BUSINESS OVERVIEW
                       FIGURE 41 INTERCONTINENTAL EXCHANGE, INC.: COMPANY SNAPSHOT (2021)
                       TABLE 74 INTERCONTINENTAL EXCHANGE, INC.: PRODUCTS/SOLUTIONS/SERVICES OFFERED
                       TABLE 75 INTERCONTINENTAL EXCHANGE, INC.: PRODUCT LAUNCHES
                       TABLE 76 INTERCONTINENTAL EXCHANGE, INC.: DEALS
             11.1.2 XPANSIV
                       TABLE 77 XPANSIV: BUSINESS OVERVIEW
                       TABLE 78 XPANSIV: PRODUCTS/SOLUTIONS/SERVICES OFFERED
                       TABLE 79 XPANSIV: DEALS
             11.1.3 EEX GROUP
                       TABLE 80 EEX GROUP: BUSINESS OVERVIEW
                       FIGURE 42 EEX GROUP: COMPANY SNAPSHOT (2021)
                       TABLE 81 EEX GROUP: PRODUCTS/SOLUTIONS/SERVICES OFFERED
             11.1.4 NASDAQ, INC.
                       TABLE 82 NASDAQ, INC.: BUSINESS OVERVIEW
                       FIGURE 43 NASDAQ, INC.: COMPANY SNAPSHOT (2021)
                       TABLE 83 NASDAQ, INC.: PRODUCTS/SOLUTIONS/SERVICES OFFERED
                       TABLE 84 NASDAQ, INC.: DEALS
             11.1.5 AIRCARBON EXCHANGE (ACX)
                       TABLE 85 AIRCARBON EXCHANGE (ACX): BUSINESS OVERVIEW
                       TABLE 86 AIRCARBON EXCHANGE (ACX): PRODUCTS/SOLUTIONS/SERVICES OFFERED
                       TABLE 87 AIRCARBON EXCHANGE (ACX): PRODUCT LAUNCHES
                       TABLE 88 AIRCARBON EXCHANGE (ACX): OTHERS
             11.1.6 CARBON TRADE EXCHANGE (CTX)
                       TABLE 89 CARBON EXCHANGE (CTX): BUSINESS OVERVIEW
                       TABLE 90 CARBON TRADE EXCHANGE (CTX): PRODUCTS/SOLUTIONS/SERVICES OFFERED
                       TABLE 91 CARBON TRADE EXCHANGE (CTX): DEALS
             11.1.7 CME GROUP
                       TABLE 92 CME GROUP: BUSINESS OVERVIEW
                       FIGURE 44 CME GROUP: COMPANY SNAPSHOT
                       TABLE 93 CME GROUP: PRODUCTS/SOLUTIONS/SERVICES OFFERED
                       TABLE 94 CME GROUP: PRODUCT LAUNCHES
                       TABLE 95 CME GROUP: DEALS
             11.1.8 CLIMATE IMPACT X
                       TABLE 96 CLIMATE IMPACT X: BUSINESS OVERVIEW
                       TABLE 97 CLIMATE IMPACT X: PRODUCTS/SOLUTIONS/SERVICES OFFERED
                       TABLE 98 CARBON IMPACT X (CIX): PRODUCTS/SOLUTIONS/SERVICES OFFERED
                       TABLE 99 CLIMATE IMPACT X: OTHERS
             11.1.9 CARBONPLACE
                       TABLE 100 CARBONPLACE: BUSINESS OVERVIEW
                       TABLE 101 CARBONPLACE: PRODUCTS/SOLUTIONS/SERVICES OFFERED
                       TABLE 102 CARBONPLACE: DEALS
             11.1.10 PLANETLY
                       TABLE 103 PLANETLY: BUSINESS OVERVIEW
                       TABLE 104 PLANETLY: PRODUCTS/SOLUTIONS/SERVICES OFFERED
             11.1.11 LIKVIDI
                       TABLE 105 LIKVIDI: BUSINESS OVERVIEW
                       TABLE 106 LIKVIDI: PRODUCTS/SOLUTIONS/SERVICES OFFERED
                       TABLE 107 LIKVIDI: PRODUCT LAUNCHES
             11.1.12 TOUCAN
                       TABLE 108 TOUCAN: BUSINESS OVERVIEW
                       TABLE 109 TOUCAN: PRODUCTS/SOLUTIONS/SERVICES OFFERED
                       TABLE 110 TOUCAN: OTHERS
             11.1.13 BETACARBON
                       TABLE 111 BETCARBON: BUSINESS OVERVIEW
                       TABLE 112 BETACARBON: PRODUCTS/SOLUTIONS/SERVICES OFFERED
                       TABLE 113 BETCARBON: OTHERS
             11.1.14 CLIMATETRADE
                       TABLE 114 CLIMATETRADE: BUSINESS OVERVIEW
                       TABLE 115 CLIMATETRADE: PRODUCTS/SOLUTIONS/SERVICES OFFERED
                       TABLE 116 CLIMATETRADE: OTHERS
             11.1.15 CARBON CREDIT CAPITAL
                       TABLE 117 CARBON CREDIT CAPITAL: BUSINESS OVERVIEW
                       TABLE 118 CARBON CREDIT CAPITAL: PRODUCTS/SOLUTIONS/SERVICES OFFERED
             11.1.16 FLOWCARBON
             11.1.17 CARBONEX
             11.1.18 PATHZERO
             11.1.19 SOUTH POLE GROUP
             11.1.20 PUBLIC INVESTMENT FUND
     11.2 LIST OF OTHER PLAYERS 
*Details on Business overview, Products offered, Recent Developments, MNM view might not be captured in case of unlisted companies.
 
12 APPENDIX (Page No. - 177)
     12.1 INSIGHTS FROM INDUSTRY EXPERTS 
     12.2 DISCUSSION GUIDE 
     12.3 KNOWLEDGESTORE: MARKETSANDMARKETS’ SUBSCRIPTION PORTAL 
     12.4 CUSTOMIZATION OPTIONS 
     12.5 RELATED REPORTS 
     12.6 AUTHOR DETAILS 

This study involved major activities in estimating the current size of the carbon credit trading platform market. Comprehensive secondary research was done to collect information on the market, peer market, and parent market. The next step involved was the validation of these findings, assumptions, and market sizing with industry experts across the value chain through primary research. The total market size was estimated through country-wise analysis. Then, the market breakdown and data triangulation were performed to estimate the market size of the segments and sub-segments.

Secondary Research

The secondary research involved the use of extensive secondary sources, directories, and databases, such as Hoover’s, Bloomberg BusinessWeek, Factiva, and OneSource, to identify and collect information useful for a technical, market-oriented, and commercial study of the global carbon credit trading platform market. The other secondary sources comprised press releases & investor presentations of companies, white papers, certified publications, articles by recognized authors, manufacturers, associations, trade directories, and databases.

Primary Research

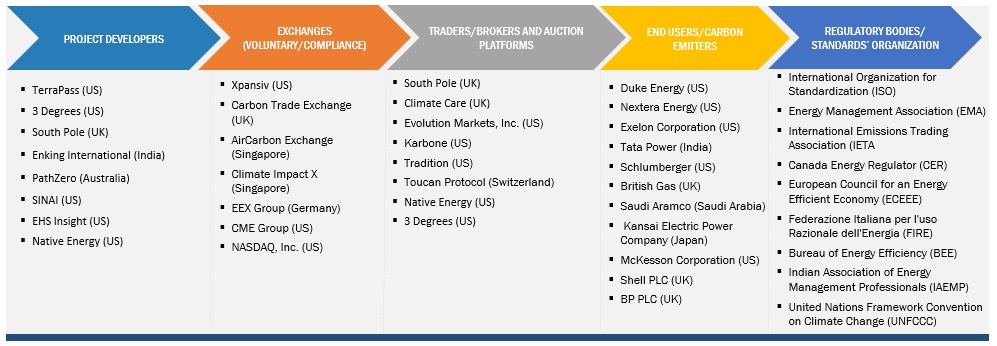
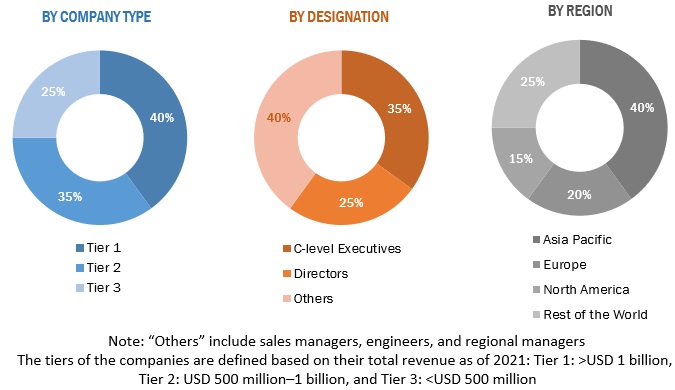
The carbon credit trading platform market comprises several stakeholders, such as project developers, exchanges, traders/brokers and auction platforms, and end users/carbon emitters in the supply chain. The demand-side of this market is characterized by end-users. Moreover, the demand is also fueled by the growing demand of industrial and utilities. The supply side is characterized by rising demand for contracts from the industrial sector and mergers & acquisitions among big players. Various primary sources from both the supply and demand sides of the market were interviewed to obtain qualitative and quantitative information. The breakdown of primary respondents is given below:
Carbon Credit Trading Platform Market Size, and Share

To know about the assumptions considered for the study, download the pdf brochure

Market Size Estimation

The bottom-up approach has been used to estimate and validate the size of the carbon credit trading platform market.

  • In this approach, the carbon credit trading platform transaction fee statistics for each type have been considered at regional level and carbon credit trading platform revenues and statistics at country level
  • Extensive secondary and primary research has been carried out to understand the global market scenario for various types of carbon credit trading platform.
  • Several primary interviews have been conducted with key opinion leaders related to carbon credit trading platform system development, including key OEMs and Tier I suppliers.
  • Qualitative aspects such as market drivers, restraints, opportunities, and challenges have been taken into consideration while calculating and forecasting the market size.

Global Carbon Credit Trading Platform Market Size: Bottom-Up Approach

Carbon Credit Trading Platform Market Size, and Share

To know about the assumptions considered for the study, Request for Free Sample Report

Data Triangulation

The overall market size is estimated using the market size estimation processes as explained above, followed by the splitting of the market into several segments and subsegments. To complete the overall market engineering process and arrive at the exact statistics of each market segment and subsegment, data triangulation, and market breakdown procedures were employed, wherever applicable. The data was triangulated by studying various factors and trends from both the demand and supply sides in the carbon credit trading platform market ecosystem.

Report Objectives

  • To define, describe, segment, and forecast the carbon credit trading platform market by type, system type, and end use, in terms of value
  • To forecast the market size for five key regions: North America, Europe, Asia Pacific, and Rest of the World, along with their key countries, in terms of value
  • To provide comprehensive information about the drivers, restraints, opportunities, and industry-specific challenges that affect the market growth
  • To strategically analyze the subsegments with respect to individual growth trends, prospects, and contributions of each segment to the overall market size
  • To analyze market opportunities for stakeholders and details of the competitive landscape for market leaders
  • To strategically profile the key players and comprehensively analyze their market shares and core competencies
  • To track and analyze competitive developments such as agreements, sales contracts, partnerships, new product launches, acquisitions, joint ventures, contracts, expansions, and investments in the switchgear market
  • This report covers the carbon credit trading platform market size in terms of value.

Available Customization

With the given market data, MarketsandMarkets offers customizations based on the company’s specific needs. The following customization options are available for the report:

Product Analysis

  • Product Matrix, which provides a detailed comparison of the product portfolio of each company

Company Information

  • Detailed analyses and profiling of additional market players (up to 5)
Custom Market Research Services

We will customize the research for you, in case the report listed above does not meet with your exact requirements. Our custom research will comprehensively cover the business information you require to help you arrive at strategic and profitable business decisions.

Request Customization

Instant Answers with GPT - Ask Now!

Ask real questions. Get complete answers !
Report Code
EP 8509
Published ON
Nov, 2022
Choose License Type
BUY NOW
  • SHARE
X
Request Customization
Speak to Analyst
Speak to Analyst
OR FACE-TO-FACE MEETING
PERSONALIZE THIS RESEARCH
  • Triangulate with your Own Data
  • Get Data as per your Format and Definition
  • Gain a Deeper Dive on a Specific Application, Geography, Customer or Competitor
  • Any level of Personalization
REQUEST A FREE CUSTOMIZATION
LET US HELP YOU!
  • What are the Known and Unknown Adjacencies Impacting the Carbon Credit Trading Platform Market
  • What will your New Revenue Sources be?
  • Who will be your Top Customer; what will make them switch?
  • Defend your Market Share or Win Competitors
  • Get a Scorecard for Target Partners
CUSTOMIZED WORKSHOP REQUEST
knowledgestore logo

Want to explore hidden markets that can drive new revenue in Carbon Credit Trading Platform Market?

Find Hidden Markets
  • Call Us
  • +1-888-600-6441 (Corporate office hours)
  • +1-888-600-6441 (US/Can toll free)
  • +44-800-368-9399 (UK office hours)
CONNECT WITH US
ABOUT TRUST ONLINE
©2024 MarketsandMarkets Research Private Ltd. All rights reserved
DMCA.com Protection Status
Website Feedback