Bulletproof Glass Market by End User (Automotive, Military, Banking & Finance, Construction), Application (Defense & VIP Vehicles, Cash-in-Transit Vehicles, Commercial Buildings), Security Levels, and Region - Global Forecast to 2022


The bulletproof glass market is projected to reach USD 7.65 Billion by 2022, at a CAGR of 13.6%. The bulletproof glass markets in the North American and European regions are slated to witness significant growth in the coming years, owing to several factors, such as increasing defense spending of various countries, rising political and civil unrest, and increasing terror strikes, globally.
The Objectives of Bulletproof Glass Market Study are:
- To define, describe, and forecast the bulletproof glass market on the basis of end user, application, and region
- To provide detailed information regarding the key factors, such as drivers, restraints, opportunities, and industry-specific challenges influencing the growth of the bulletproof glass market
- To strategically analyze micromarkets with respect to the growth trends, future prospects, and contribution to the bulletproof glass market
- To analyze the opportunities for the stakeholders in the bulletproof glass market and draw a competitive landscape of the market
- To forecast the market size, in terms of value and volume with respect to five regions, which include Asia-Pacific, North America, Europe, Middle East & Africa, and South & Central America, along with their key countries
- To analyze competitive developments, such as joint ventures, mergers & acquisitions, new product developments, and research & development (R&D) activities in the bulletproof glass market
- To strategically profile the key players in the bulletproof glass market and comprehensively evaluate their shares in the market
The years considered for the study are:
- Base Year – 2016
- Estimated Year – 2017
- Projected Year – 2022
- Forecast Period – 2017 to 2022
For company profiles in the report, 2016 has been considered as the base year. In certain cases, wherein information is unavailable for the base year, the years prior to it have been considered.
Bulletproof Glass Market Research Methodology
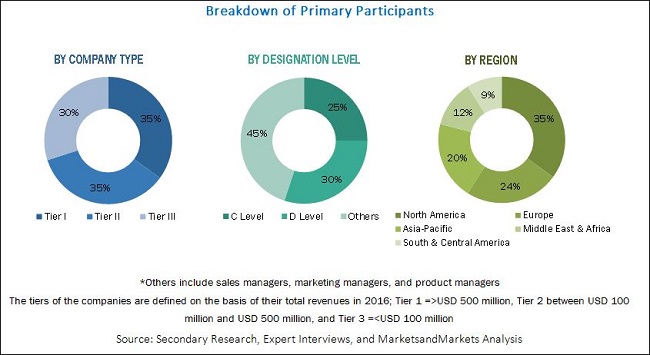
This research study involves the usage of both, secondary as well as primary sources. Secondary sources include directories and databases, such as Hoovers, Bloomberg, Factiva, and other government and private websites to identify and collect information useful for a technical, market-oriented, and commercial study of the bulletproof glass market. The primary sources are mainly the experts from the core and related industries and preferred suppliers, manufacturers, distributors, service providers, technology developers, alliances, and organizations related to all segments of this industry’s value chain. In-depth interviews with various primary respondents that include key industry participants, subject matter experts (SMEs), C-level executives of the key market players, and industry consultants have been conducted to obtain and verify critical qualitative and quantitative information as well as to assess the growth prospects of the bulletproof glass market during the forecast period, 2017 to 2022.
The vendor offerings were also taken into consideration to determine the market segmentation. After arriving at the overall market size, the total market was split into several segments and subsegments, which were later verified through primary research by conducting extensive interviews with key personnel, such as CEOs, VPs, directors, and executives. Data triangulation and market breakdown procedures were employed to complete the overall market engineering process and arrive at the exact statistics for all segments and subsegments of the market. The breakdown of profiles of primaries is depicted in the figure below.
To know about the assumptions considered for the study, download the pdf brochure
The global bulletproof glass market has a diversified ecosystem of upstream players, including bulletproof glass suppliers and fabricators, along with downstream stakeholders, vendors, and government organizations. Companies operating in the global bulletproof glass market include Asahi Glass Co., Ltd. (Japan), China Specialty Glass AG (China), Nippon Sheet Co., Ltd. (Japan), Saint-Gobain S.A. (France), Consolidated Glass Holdings, Inc. (U.S.), Total Security Solutions (U.S.), SCHOTT AG (Germany), D.W. Price Security (U.K.), Smartglass International Ltd. (Ireland), Apogee Enterprises, Inc. (U.S.), and National Glass (South Africa).
Target Audience in Bulletproof Glass Market
- Government Departments and Agencies
- Heads of Strategic Departments
- Manufacturers of Bulletproof Glass
- Asset Managers and Chief Executive Officers of Glass Companies
- Polycarbonate Manufacturing Companies
- Aftermarket/Replacement Glass Companies
- Defense Procurement Departments
- Raw Material Suppliers and Distributors
- Consultants/Glass Associations
- End Users
“This study answers several questions for the stakeholders, primarily which market segments they should focus upon during the next two to five years so that they may prioritize their efforts and investments accordingly”
Bulletproof Glass Market Report Scope
This research report categorizes the global bulletproof glass market based on end-user, application, security levels and region, forecasting revenues and analyzes trends in each of the submarkets.
On the basis of End User:
- Automotive
- Military
- Banking & Finance
- Construction
- Others1
Note: Other1 include presidential gatherings and election departments.
On the basis of Application:
- Defense & VIP Vehicles
- ATM Booths & Teller Stations
- Cash-in-Transit Vehicles
- Commercial Buildings
- Government & Law Enforcement
- Others2
Note: Others2 include museums/art galleries, post offices, jewelry shops, retail stores, gas stations, pharmacies, schools, police stations, government facilities, and businesses with security concerns
On the basis of Security Levels:
- Security Level-1
- Security Level-2
- Security Level-3
- Security Level-4 to 8
On the basis of Region:
- Asia-Pacific
- North America
- Europe
- Middle East & Africa
- South & Central America
The following customization options are available for the report:
Along with the market data, MarketsandMarkets offers customizations as per the company’s specific needs. The following customization options are available for the report:
Bulletproof Glass Market Product Analysis
- Product matrix, which gives a detailed comparison of the product portfolio of each company
Bulletproof Glass Market Geographic Analysis
- Further breakdown of the Rest of Asia-Pacific, Rest of Middle East & Africa, Rest of Europe, and Rest of South & Central America bulletproof glass markets
Bulletproof Glass Market Company Information
- Detailed analysis and profiling of additional market players (up to five companies)
The global bulletproof glass market is projected to reach USD 7.65 Billion by 2022, at a CAGR of 13.6% between 2017 and 2022. The growth of this market can be attributed to the growing demand for bulletproof glass from the automotive and military end users.
The automotive segment led the global bulletproof glass market in 2016. The military segment is projected to witness highest growth from 2017 to 2022, due to the increasing usage of bulletproof glass in military bases, combat operations, and transportation of personnel, mine detection, bomb disposal, and Intelligence, Surveillance, and Reconnaissance (ISR), battle tanks, infantry fighting vehicles, armored personnel carriers, and tactical tanks.
Defense & VIP Vehicles was the largest segment of the bulletproof glass market in 2016. The defense & VIP vehicles segment includes combat vehicles, transportation of personnel, premier vehicles, VVIP vehicles, vehicles used by governments, embassies, and others for protection from ballistic or blast attacks. Some of the common armored vehicle products used in the defense sector include main battle tanks, infantry fighting vehicles, armored personnel carriers, and tactical tanks.
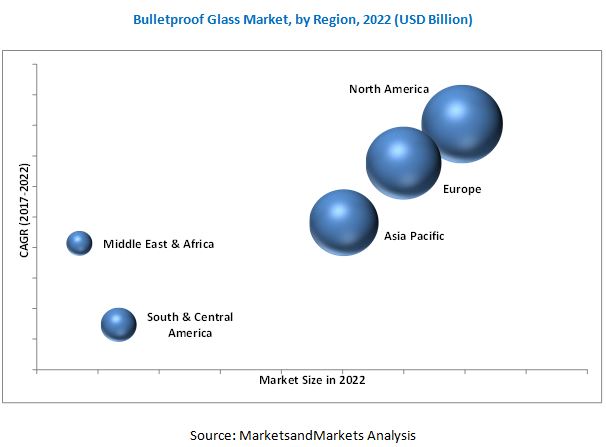
North America is projected to be the fastest-growing market. The U.S. is the largest consumer of bulletproof glass. The high demand for bulletproof glass from automotive, military, and construction segments is driving the market.
The declining or stagnant defense budgets of the major economies of the world, which include the U.S., Canada, the U.K., Germany, France, Italy, and Japan, among others, are expected to act as restraints to the growth of the bulletproof glass market, globally.
Key Players in Bulletproof Glass Market
Key players operational in the bulletproof glass market include Asahi Glass Co., Ltd. (Japan), China Specialty Glass AG (China), Nippon Sheet Co., Ltd. (Japan), Saint-Gobain S.A. (France), Consolidated Glass Holdings, Inc. (U.S.), Total Security Solutions (U.S.), SCHOTT AG (Germany), D.W. Price Security (U.K.), Smartglass International Ltd. (Ireland), Apogee Enterprises, Inc. (U.S.), and National Glass (South Africa). These companies adopted various strategies to increase their shares in the market. Collaborations, agreements, acquisitions, and expansions are some of the key strategies adopted by market players to achieve growth in the bulletproof glass market.
Frequently Asked Questions (FAQ):
What is the Bulletproof Glass Market growth?
Growth of Bulletproof Glass Market - At a CAGR of 13.6% from 2017 to 2022.
Who leading market players in Bulletproof Glass industry?
Key players operational in the bulletproof glass market include Asahi Glass Co., Ltd. (Japan), China Specialty Glass AG (China), Nippon Sheet Co., Ltd. (Japan), Saint-Gobain S.A. (France), Consolidated Glass Holdings, Inc. (U.S.), Total Security Solutions (U.S.), SCHOTT AG (Germany), D.W. Price Security (U.K.), Smartglass International Ltd. (Ireland), Apogee Enterprises, Inc. (U.S.), and National Glass (South Africa).
How big is the Bulletproof Glass Market?
The global bulletproof glass market is projected to reach USD 7.65 Billion by 2022.
Which segments are covered in Bulletproof Glass Market report?
By End User (Automotive, Military, Banking & Finance, Construction), Application (Defense & VIP Vehicles, Cash-in-Transit Vehicles, Commercial Buildings) & Security Levels.
To speak to our analyst for a discussion on the above findings, click Speak to Analyst
 Exclusive indicates content/data unique to MarketsandMarkets and not available with any competitors.
Table of Contents
1 Introduction (Page No. - 16)
1.1 Objectives of the Study
1.2 Market Definition
1.3 Study Scope
1.3.1 Markets Covered
1.3.2 Years Considered for the Study
1.4 Currency
1.5 Units
1.6 Stakeholders
2 Research Methodology (Page No. - 19)
2.1 Research Data
2.1.1 Key Data From Secondary Sources
2.1.2 Key Data From Primary Sources
2.1.2.1 Key Industry Insights
2.1.2.2 Breakdown of Primary Interviews
2.2 Market Size Estimation
2.3 Market Breakdown and Data Triangulation
2.4 Research Assumptions and Limitations
2.4.1 Assumptions
2.4.2 Limitations
3 Executive Summary (Page No. - 28)
4 Premium Insights (Page No. - 33)
4.1 Attractive Growth Opportunities in the Bulletproof Glass Market
4.2 Bulletproof Glass Market, By Region
4.3 North America Bulletproof Glass Market
4.4 Bulletproof Glass Market: Major Countries
5 Market Overview (Page No. - 37)
5.1 Introduction
5.2 Market Dynamics
5.2.1 Drivers
5.2.1.1 Increasing Automotive and Commercial Applications of Bulletproof Glass
5.2.1.2 Militarization of the Law Enforcement Agencies of Different Countries
5.2.2 Restraints
5.2.2.1 Declining Defense Budgets of Developed Economies
5.2.3 Opportunities
5.2.3.1 Increasing Defense Expenditures of Emerging Economies
5.2.3.2 Growing Number of Terrorist Attacks Across the Globe
5.2.3.3 Increasing R&D Activities for the Development of Advanced Bulletproof Glass
5.2.4 Challenges
5.2.4.1 High Investments Required for Manufacturing and R&D of Bulletproof Glass
5.3 Porter’s Five Forces Analysis
5.3.1 Threat of New Entrants
5.3.2 Threat of Substitutes
5.3.3 Bargaining Power of Suppliers
5.3.4 Bargaining Power of Buyers
5.3.5 Intensity of Competitive Rivalry
5.4 Macro Economic Overview and Key Trends
5.4.1 Introduction
5.4.2 Trends and Forecasts of GDP for Various Countries
5.4.3 Trends and Sales of the Automotive Industry
5.5 Bulletproof Glass Market, By Type
5.5.1 Introduction
5.5.2 Acrylic
5.5.3 Polycarbonate
5.5.4 Glass Clad Polycarbonate
6 Bulletproof Glass Market, By End User (Page No. - 49)
6.1 Introduction
6.2 Automotive
6.3 Military
6.4 Construction
6.5 Banking & Finance
6.6 Others
7 Bulletproof Glass Market, By Application (Page No. - 56)
7.1 Introduction
7.2 Defense & VIP Vehicles
7.3 Government & Law Enforcement
7.4 Cash-In-Transit Vehicles
7.5 Commercial Buildings
7.6 ATM Booths & Teller Stations
7.7 Others
8 Bullerproof Glass Market, By Security Levels (Page No. - 62)
8.1 Introduction
8.2 Security Levels
8.2.1 Security Level - 1
8.2.2 Security Level - 2
8.2.3 Security Level - 3
8.2.4 Security Level 4-8
8.3 Standard Protection Levels
9 Regional Analysis (Page No. - 64)
9.1 Introduction
9.2 North America
9.2.1 U.S.
9.2.2 Canada
9.2.3 Mexico
9.3 Europe
9.3.1 Germany
9.3.2 France
9.3.3 U.K.
9.3.4 Italy
9.3.5 Russia
9.3.6 Rest of Europe
9.4 Asia-Pacific
9.4.1 China
9.4.2 Japan
9.4.3 India
9.4.4 South Korea
9.4.5 Rest of Asia-Pacific
9.5 Middle East & Africa
9.5.1 Saudi Arabia
9.5.2 Oman
9.5.3 UAE
9.5.4 South Africa
9.5.5 Rest of Middle East & Africa
9.6 South & Central America
9.6.1 Brazil
9.6.2 Argentina
9.6.3 Chile
9.6.4 Rest of South & Central America
10 Competitive Landscape (Page No. - 110)
10.1 Introduction
10.2 Vendor Dive Analysis
10.2.1 Vanguard
10.2.2 Innovator
10.2.3 Dynamic
10.2.4 Emerging
10.3 Competitive Benchmarking
10.3.1 Product Offerings
10.3.2 Business Strategies
10.4 Market Share Analysis
11 Company Profiles (Page No. - 115)
(Overview, Financial*, Products & Services, Strategy, and Developments)
11.1 Asahi Glass Co., Ltd.
11.2 China Specialty Glass AG
11.3 Saint-Gobain S.A.
11.4 Nippon Sheet Co., Ltd.
11.5 Taiwan Glass Ind. Corp
11.6 Guangdong Golden Glass Technologies Limited
11.7 American Glass Products
11.8 Guardian Glass
11.9 Schott AG
11.10 Total Security Solutions
11.11 Consolidated Glass Holdings, Inc.
11.12 Binswanger Glass
11.13 Smartglass International Limited
11.14 D. W. Price Security
11.15 Armassglass
11.16 ESG Group Limited
11.17 Other Companies
11.17.1 Apogee Enterprises, Inc.
11.17.2 Qufu Shenglu Bulletproof Glass Engineering Co., Ltd.
11.17.3 National Glass
11.17.4 Fuyao North America Incorporated
11.17.5 Laggar Industries Ltd.
11.17.6 Jeet & Jeet Glass and Chemicals Pvt. Ltd.
11.17.7 Brite Glass Works Pvt. Ltd.
11.17.8 Armortex
11.17.9 New Glass Technology
11.17.10 Centigon Security Group
*Details Might Not Be Captured in Case of Unlisted Companies.
12 Appendix (Page No. - 157)
12.1 Discussion Guide
12.2 Knowledge Store: Marketsandmarkets Subscription Portal
12.3 Introducing RT: Real-Time Market Intelligence
12.4 Available Customizations
12.5 Related Reports
12.6 Author Details
List of Tables (119 Tables)
Table 1 Mapping of the Military Expenditures of Various Developed Economies, 2012-2016 (USD Million)
Table 2 Mapping of Military Expenditures of Emerging Economies, 2012-2016 (USD Million)
Table 3 Trends and Forecasts of GDP, By Country, 2015–2021 (USD Billion)
Table 4 Production Statistics, By Country, 2016
Table 5 Bulletproof Glass Market, By End User, 2015-2022 (USD Million)
Table 6 Market, By End User, 2015-2022 (‘000 Sq. Meters)
Table 7 Bulletproof Glass Market for Automotive, By Region, 2015-2022 (USD Million)
Table 8 Market for Automotive, By Region, 2015-2022 (‘000 Sq. Meters)
Table 9 Bulletproof Glass Market for Military, By Region, 2015-2022 (USD Million)
Table 10 Market for Military, By Region, 2015-2022, (‘000 Sq. Meters)
Table 11 Market for Construction, By Region, 2015-2022 (USD Million)
Table 12 Bulletproof Glass Market for Construction, By Region, 2015-2022 (‘000 Sq. Meters)
Table 13 Market for Banking & Finance, By Region, 2015-2022 (USD Million)
Table 14 Market for Banking & Finance, By Region, 2015-2022 (‘000 Sq. Meters)
Table 15 Bulletproof Glass Market for Others, By Region, 2015-2022 (USD Million)
Table 16 Market for Others, By Region, 2015-2022 (‘000 Sq. Meters)
Table 17 Market, By Application, 2015-2022 (‘000 Sq. Meters)
Table 18 Bulletproof Glass Market in Defense & VIP Vehicles, By Region, 2015-2022 (‘000 Sq. Meters)
Table 19 Market in Government & Law Enforcement, By Region, 2015-2022 (‘000 Sq. Meters)
Table 20 Market in Cash-In-Transit Vehicles, By Region, 2015-2022 (‘000 Sq. Meters)
Table 21 Bulletproof Glass Market in Commercial Buildings, By Region, 2015-2022 (‘000 Sq. Meters)
Table 22 Market in ATM Booths & Teller Stations, By Region, 2015-2022 (‘000 Sq. Meters)
Table 23 Market in Others, By Region, 2015-2022 (‘000 Sq. Meters)
Table 24 Bulletproof Glass Market, By Region, 2015-2022 (USD Million)
Table 25 Market, By Region, 2015-2022 (‘000 Sq. Meters)
Table 26 North America: Bulletproof Glass Market Size, By Country, 2015-2022 (‘000 Sq. Meters)
Table 27 North America: Market Size, By Country, 2015-2022 (USD Million)
Table 28 North America: Market Size, By End User, 2015-2022 (‘000 Sq. Meters)
Table 29 North America: Market Size, By End User, 2015-2022 (USD Million)
Table 30 North America: Market Size, By Application, 2015-2022 (‘000 Sq. Meters)
Table 31 U.S.: Bulletproof Glass Market Size, By End User, 2015-2022 (‘000 Sq. Meters)
Table 32 U.S.: Market Size, By End User, 2015-2022 (USD Million)
Table 33 U.S.: Market Size, By Application, 2015-2022 (‘000 Sq. Meters)
Table 34 Canada: Bulletproof Glass Market Size, By End User, 2015-2022 (‘000 Sq. Meters)
Table 35 Canada: Market Size, By End User, 2015-2022 (USD Million)
Table 36 Canada: Market Size, By Application, 2015-2022 (‘000 Sq. Meters)
Table 37 Mexico: Bulletproof Glass Market Size, By End User, 2015-2022 (‘000 Sq. Meters)
Table 38 Mexico: Market Size, By End User, 2015-2022 (USD Million)
Table 39 Mexico: Market Size, By Application, 2015-2022 (‘000 Sq. Meters)
Table 40 Europe: Bulletproof Glass Market Size, By Country, 2015-2022 (‘000 Sq. Meters)
Table 41 Europe: Market Size, By Country, 2015-2022 (USD Million)
Table 42 Europe: Market Size, By End User, 2015-2022 (‘000 Sq. Meters)
Table 43 Europe: Market Size, By End User, 2015-2022 (USD Million)
Table 44 Europe: Market Size, By Application, 2015-2022 (‘000 Sq. Meters)
Table 45 Germany: Bulletproof Glass Market Size, By End User, 2015-2022 (‘000 Sq. Meters)
Table 46 Germany: Market Size, By End User, 2015-2022 (USD Million)
Table 47 Germany: Market Size, By Application, 2015-2022 (‘000 Sq. Meters)
Table 48 France: Bulletproof Glass Market Size, By End User, 2015-2022 (‘000 Sq. Meters)
Table 49 France: Market Size, By End User, 2015-2022 (USD Million)
Table 50 France: Market Size, By Application, 2015-2022 (‘000 Sq. Meters)
Table 51 U.K.: Bulletproof Glass Market Size, By End User, 2015-2022 (‘000 Sq. Meters)
Table 52 U.K.: Market Size, By End User, 2015-2022 (USD Million)
Table 53 U.K.: Market Size, By Application, 2015-2022 (‘000 Sq. Meters)
Table 54 Italy: Bulletproof Glass Market Size, By End User, 2015-2022 (‘000 Sq. Meters)
Table 55 Italy: Market Size, By End User, 2015-2022 (USD Million)
Table 56 Italy: Market Size, By Application, 2015-2022 (‘000 Sq. Meters)
Table 57 Russia: Bulletproof Glass Market Size, By End User, 2015-2022 (‘000 Sq. Meters)
Table 58 Russia: Market Size, By End User, 2015-2022 (USD Million)
Table 59 Russia: Market Size, By Application, 2015-2022 (‘000 Sq. Meters)
Table 60 Rest of Europe: Bulletproof Glass Market Size, By End User, 2015-2022 (‘000 Sq. Meters)
Table 61 Rest of Europe: Market Size, By End User, 2015-2022 (USD Million)
Table 62 Rest of Europe: Market Size, By Application, 2015-2022 (‘000 Sq. Meters)
Table 63 Asia-Pacific: Bulletproof Glass Market Size, By Country, 2015-2022 (‘000 Sq. Meters)
Table 64 Asia-Pacific: Market Size, By Country, 2015-2022 (USD Million)
Table 65 Asia-Pacific: Market Size, By End User, 2015-2022 (‘000 Sq. Meters)
Table 66 Asia-Pacific: Market Size, By End User, 2015-2022 (USD Million)
Table 67 Asia-Pacific: Market Size, By Application, 2015-2022 (‘000 Sq. Meters)
Table 68 China: Bulletproof Glass Market Size, By End User, 2015-2022 (‘000 Sq. Meters)
Table 69 China: Market Size, By End User, 2015-2022 (USD Million)
Table 70 China: Market Size, By Application, 2015-2022 (‘000 Sq. Meters)
Table 71 Japan: Bulletproof Glass Market Size, By End User, 2015-2022 (‘000 Sq. Meters)
Table 72 Japan: Market Size, By End User, 2015-2022 (USD Million)
Table 73 Japan: Market Size, By Application, 2015-2022 (‘000 Sq. Meters)
Table 74 India: Bulletproof Glass Market Size, By End User, 2015-2022 (‘000 Sq. Meters)
Table 75 India: Market Size, By End User, 2015-2022 (USD Million)
Table 76 India: Market Size, By Application, 2015-2022 (‘000 Sq. Meters)
Table 77 South Korea: Bulletproof Glass Market Size, By End User, 2015-2022 (‘000 Sq. Meters)
Table 78 South Korea: Market Size, By End User, 2015-2022 (USD Million)
Table 79 South Korea: Market Size, By Application, 2015-2022 (‘000 Sq. Meters)
Table 80 Rest of APAC: Bulletproof Glass Market Size, By End User, 2015-2022 (‘000 Sq. Meters)
Table 81 Rest of APAC: Market Size, By End-Use, 2015-2022 (USD Million)
Table 82 Rest of APAC: Market Size, By Application, 2015-2022 (‘000 Sq. Meters)
Table 83 Middle East & Africa: Bulletproof Glass Market Size, By Country, 2015-2022 (‘000 Sq. Meters)
Table 84 Middle East & Africa: Market Size, By Country, 2015-2022 (USD Million)
Table 85 Middle East & Africa: Market Size, By End User, 2015-2022 (‘000 Sq. Meters)
Table 86 Middle East & Africa: Market Size, By End User, 2015-2022 (USD Million)
Table 87 Middle East & Africa: Market Size, By Application, 2015-2022 (Thousand Sq. Meters)
Table 88 Saudi Arabia: Bulletproof Glass Market Size, By End User, 2015-2022 (‘000 Sq. Meters)
Table 89 Saudi Arabia: Market Size, By End User, 2015-2022 (USD Million)
Table 90 Saudi Arabia: Market Size, By Application, 2015-2022 (‘000 Sq. Meters)
Table 91 Oman: Bulletproof Glass Market Size, By End User, 2015-2022 (‘000 Sq. Meters)
Table 92 Oman: Market Size, By End User, 2015-2022 (USD Million)
Table 93 Oman: Market Size, By Application, 2015-2022 (‘000 Sq. Meters)
Table 94 UAE: Bulletproof Glass Market Size, By End User, 2015-2022 (‘000 Sq. Meters)
Table 95 UAE: Market Size, By End User, 2015-2022 (USD Million)
Table 96 UAE: Market Size, By Application, 2015-2022 (‘000 Sq. Meters)
Table 97 South Africa: Bulletproof Glass Market Size, By End User, 2015-2022 (Thousand Sq. Meters)
Table 98 South Africa: Market Size, By End User, 2015-2022 (USD Million)
Table 99 South Africa: Market Size, By Application, 2015-2022 (‘000 Sq. Meters)
Table 100 Rest of ME&&A: Bulletproof Glass Market Size, By End User, 2015-2022 (‘000 Sq. Meters)
Table 101 Rest of ME&&A: Market Size, By End User, 2015-2022 (USD Million)
Table 102 Rest of ME&&A: Market Size, By Application, 2015-2022 (‘000 Sq. Meters)
Table 103 South & Central America: Bulletproof Glass Market Size, By Country, 2015-2022 (‘000 Sq. Meters)
Table 104 South & Central America: Market Size, By Country, 2015-2022 (USD Million)
Table 105 South & Central America: Market Size, By End User, 2015-2022 (‘000 Sq. Meters)
Table 106 South & Central America: Market Size, By End User, 2015-2022 (USD Million)
Table 107 South & Central America: Market Size, By Application, 2015-2022 (‘000 Sq. Meters)
Table 108 Brazil: Bulletproof Glass Market Size, By End User, 2015-2022 (‘000 Sq. Meters)
Table 109 Brazil: Market Size, By End User, 2015-2022 (USD Million)
Table 110 Brazil: Market Size, By Application, 2015-2022 (‘000 Sq. Meters)
Table 111 Argentina: Bulletproof Glass Market Size, By End User, 2015-2022 (‘000 Sq. Meters)
Table 112 Argentina: Market Size, By End User, 2015-2022 (USD Million)
Table 113 Argentina: Market Size, By Application, 2015-2022 (‘000 Sq. Meters)
Table 114 Chile: Bulletproof Glass Market Size, By End User, 2015-2022 (‘000 Sq. Meters)
Table 115 Chile: Market Size, By End User, 2015-2022 (USD Million)
Table 116 Chile: Market Size, By Application, 2015-2022 (‘000 Sq. Meters)
Table 117 Rest of S&CA: Bulletproof Glass Market Size, By End User, 2015-2022 (Thousand Sq. Meters)
Table 118 Rest of S&CA: Market Size, By End User, 2015-2022 (USD Million)
Table 119 Rest of S&CA: Market Size, By Application, 2015-2022 (‘000 Sq. Meters)
List of Figures (34 Figures)
Figure 1 Bulletproof Glass Market: Segmentation
Figure 2 Bullet Proof Market: Research Design
Figure 3 Breakdown of Primaries
Figure 4 Bottom-Up Approach
Figure 5 Top-Down Approach
Figure 6 Bulletproof Glass Market: Data Triangulation
Figure 7 The Automotive End User Segment is Projected to Lead the Bulletproof Glass Market From 2017 to 2022
Figure 8 The Defense & VIP Vehicles Application Segment is Projected to Lead the Bulletproof Glass Market Between 2017 and 2022
Figure 9 Bulletproof Glass Market, By Region, 2017 & 2022 (USD Million)
Figure 10 The North American Region is Estimated to Lead the Bulletproof Glass Market in 2017
Figure 11 Increasing Demand for Bulletproof Glass From Various End Users is Expected to Fuel the Growth of the Bulletproof Glass Market From 2017 to 2022
Figure 12 Bulletproof Glass Market, By Region, 2022 (USD Million)
Figure 13 The U.S. is the Largest Market for Bulletproof Glass in the North American Region
Figure 14 The Germany Bulletproof Glass Market is Projected to Grow at the Highest CAGR From 2017 to 2022
Figure 15 Drivers, Restraints, Opportunities, and Challenges for the Bulletproof Glass Market
Figure 16 Porter’s Five Forces Analysis
Figure 17 Trends of GDP, By Country, 2015 (USD Billion)
Figure 18 Bulletproof Glass Market, By End User, 2017 & 2022 (USD Million)
Figure 19 Bulletproof Market, By Application, 2017 & 2022 (‘000 Sq. Meters)
Figure 20 U.S., Germany & China are Emerging as the New Hotspots in Global Bulletproof Glass Market
Figure 21 North America Bulletproof Glass Market Snapshot
Figure 22 Europe Bulletproof Glass Market Snapshot
Figure 23 Asia-Pacific Bulletproof Glass Market Snapshot
Figure 24 Middle East & Africa Bulletproof Glass Market Snapshot
Figure 25 South America Bulletproof Glass Market Snapshot
Figure 26 Dive Chart
Figure 27 Bulletproof Glass Market Share, By Key Companies, 2016
Figure 28 Asahi Glass Co., Ltd.: Company Snapshot
Figure 29 China Specialty Glass AG: Company Snapshot
Figure 30 Saint-Gobain S.A.: Company Snapshot
Figure 31 Nippon Sheet Co., Ltd.: Company Snapshot
Figure 32 Taiwan Glass Ind. Corp.: Company Snapshot
Figure 33 Guangdong Golden Glass Technologies Limited: Company Snapshot
Figure 34 Schott AG: Company Snapshot


Growth opportunities and latent adjacency in Bulletproof Glass Market