Breathable Membranes Market for Construction Industry by Type (Polethylene, Polypropylene), Application (Pitched Roofs, and Walls), and Region - Global Forecasts to 2021


The size of breathable membranes market for construction industry is projected to reach USD 1,617.2 Million by 2021, at a CAGR of 10.3%.
The years considered for the study includes:
Base Year: 2015
Forecast Period: 2016–2021.
Objectives of the study:
- To define, describe, and forecast the breathable membranes market on the basis of type, application, and region
- To provide detailed information about the key factors influencing the growth of the market (drivers, restraints, opportunities, and challenges)
- To strategically analyze micromarkets with respect to individual growth trends, future prospects, and contribution to the overall market
- To analyze the opportunities in the market for stakeholders and provide a competitive landscape for market leaders
- To strategically profile key players and comprehensively analyze their market shares and core competencies
Both top-down and bottom-up approaches have been used to estimate and validate the size of the market, and estimate the size of various other dependent submarkets in the overall breathable membranes market. The research study involved the extensive use of secondary sources, directories, and databases such as Hoovers, Bloomberg, Chemical Weekly, Factiva, ICIS, Securities and Exchange Commission (SEC), among other government and private websites, to identify and collect information useful for the technical, market-oriented, and commercial study of the breathable membranes market.
To know about the assumptions considered for the study, download the pdf brochure
Breathable membranes is manufactured from various raw materials such as ethylene, porpylene, alpha olefin, and catalyst. Chevron Phillips Chemical Company (U.S.), Sinopec Corp. (China), The Dow Chemical Company (U.S.), ExxonMobil Corporation (U.S.), and BASF SE (Germany) are the major raw material providers. These raw materials are supplied to the major manufacturers of Breathable Membranes such as E. I. du Pont de Nemours and Company (U.S.), Cosella-Dorken (Canada), Soprema (France), GAF Material Corporation (U.S.), Saint Gobain SA (France), and Kingspan Group PLC (Ireland), Klober (U.K).
Key Target Audience:
- Manufacturers of Breathable Membranes
- Traders, Distributors, and Suppliers of Breathable Membranes
- Government and Regional Agencies and Research Organizations
- Investment Research Firms
Scope of the Breathable Membranes Market Report:
This research report categorizes the Breathable Membranes market on the basis of type, end-use industry, and region
On the basis of Type:
- Polyethylene (PE)
- Polypropylene (PP)
- Others
On the basis of Application:
- Pitched Roof
- Walls
On the basis of Region:
- North America
- Western Europe
- Asia-Pacific
- Central & Eastern Europe
- RoW
The market is further analyzed on the basis of key countries in each of these regions.
Available Customizations:
Along with the market data, MarketsandMarkets offers customizations according to the specific needs of the company. The following customization options are available for the report:
Regional Analysis:
- Country-level analysis of the breathable membranes market, by type and application.
Company Information:
- Detailed analysis and profiling of additional market players.
The market size of breathable membranes for construction industry is estimated to reach USD 1,617.2 Million by 2021, at a CAGR of 10.3% from 2016 to 2021. The cost effectiveness of the membrane, increasing demand for timber frame construction industry in European countries, and its excellent UV resistant properties with breathable characteristics over its alternatives such as non-breathable membranes and asphaltic papers are driving the market for breathable membranes.
Pitched roof is the largest end-use application of breathable membranes worldwide. Increasing timber frame construction with pitch roof architecture is the major driver for breathable membranes market. Polyethylene (PE) based breathable membrane is expected to show high demand in the pitched roof application. Growing awareness for safeguarding building materials from getting eroded by water vapors is also driving the market. The building & construction industry have wide scope of expansion especially in Scandinavian countries, which in turn is expected to increase the consumption of breathable membranes during the forecast period.
On the basis of type, the breathable membranes market has been segmented into polyethylene, polypropylene, and others. It is projected to be the second-fastest growing segment in the breathable membrane market, between 2016 and 2021, owing to its superior properties and cost advantages over other non-breathable membranes products.
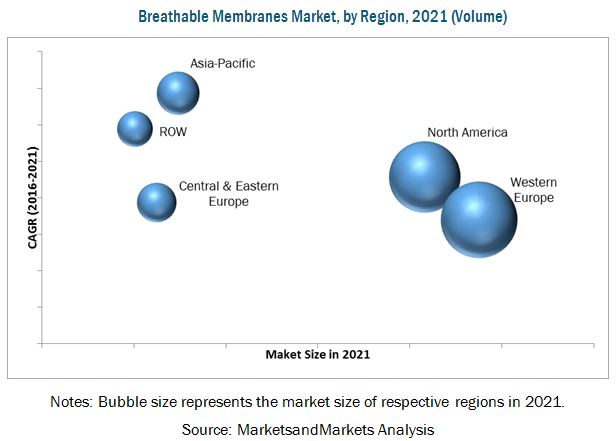
Asia-Pacific, North America, Western Europe, Central & Eastern Europe, and RoW are considered as the main regions of the breathable membranes market. Western Europe dominates the breathable membranes market, in terms of volume, owing to increased population and rising demand for residential building. The rising demand for high-quality breathable membranes products with superior prolonged UV resistance property and airtightness characteristics has significantly triggered the demand for breathable membranes. Pitched roof and walls end-use application is contributing to the growing demand for breathable membranes in Western Europe.
Slow growth rate of construction industry in Western Europe is the major restraint of breathable membranes market. Increasing demand for timber frame construction over concrete or steel in extreme climate geographic areas and need for high performance membranes with excellent air tightness quality are the major opportunity for the market. Educating the architects on breathable membrane installation procedures and fluctuating prices of raw materials (which includes PE, PP, PUR, PET, and PTFE resins) are the major challenge faced by the breathable membrane market players.
The global breathable membranes market is dominated by the leading players such as E. I. du Pont de Nemours and Company (U.S.), Cosella-Dorken (Canada), Soprema (France), GAF Material Corporation (U.S.), Saint Gobain SA (France), Kingspan Group PLC (Ireland), and Klober (U.K.). The diverse product portfolio, strategically positioned R&D centers, continuous adoption of development strategies, and technological advancements strengthen the market position of these companies in the breathable membranes market. They have been adopting various organic and inorganic growth strategies, such as expansions, mergers & acquisitions, and new product launches to enhance their current market shares. This is expected to help the market evolve expand their market shares.
Frequently Asked Questions (FAQ):
How big is the breathable membranes market?
The size of breathable membranes market for construction industry is projected to reach USD 1,617.2 Million by 2021, at a CAGR of 10.3%.
Who leading market players in breathable membranes market?
E. I. du Pont de Nemours and Company (U.S.), Cosella-Dorken (Canada), Soprema (France), GAF Material Corporation (U.S.), Saint Gobain SA (France), Kingspan Group PLC (Ireland), and Klober (U.K.).
To speak to our analyst for a discussion on the above findings, click Speak to Analyst
 Exclusive indicates content/data unique to MarketsandMarkets and not available with any competitors.
Table of Contents
1 Introduction (Page No. - 16)
1.1 Objectives of the Study
1.2 Market Definition
1.3 Scope of the Study
1.3.1 Markets Covered
1.3.2 Years Considered for the Study
1.4 Currency
1.5 Package Size
1.6 Stakeholders
2 Research Methodology (Page No. - 19)
2.1 Research Data
2.1.1 Secondary Data
2.1.1.1 Key Data From Secondary Sources
2.1.2 Primary Data
2.1.2.1 Key Data From Primary Sources
2.1.2.2 Key Industry Insights
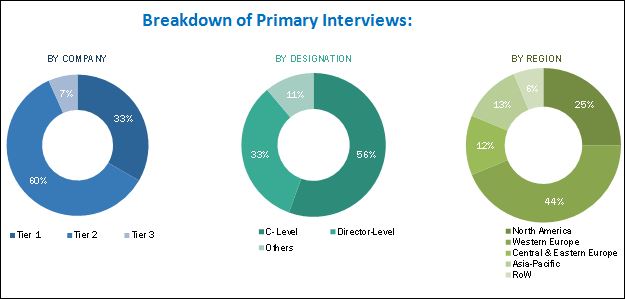
2.1.2.3 Breakdown of Primary Interviews
2.2 Market Size Estimation
2.3 Data Triangulation
2.4 Research Assumptions
3 Executive Summary (Page No. - 28)
4 Premium Insights (Page No. - 33)
4.1 Breathable Membranes Market Overview
4.2 Breathable Membranes Market, By Type
4.3 Breathable Membranes Market in North America
4.4 Breathable Membranes Market Share, By Region 2015
4.5 Breathable Membranes Market, Top Five Countries
4.6 Breathable Membranes Market Attractiveness, By Application (2016–2021)
5 Market Overview (Page No. - 37)
5.1 Introduction
5.2 Market Segmentation
5.2.1 By Type
5.2.2 By Application
5.2.3 By Region
5.3 Market Dynamics
5.3.1 Drivers
5.3.1.1 Increasing Durability and Cost-Effectiveness of Breathable Membranes
5.3.1.2 Stringent Environmental Regulations in European Countries for Energy Optimization
5.3.2 Restraints
5.3.2.1 Slow Growth of Construction Sector in Europe
5.3.2.2 Use of Breathable Membranes Increasing Wall Thickness
5.3.3 Opportunities
5.3.3.1 Increasing Demand for Timber Frame Construction Over Concrete Or Steel in Extreme Climatic Conditions
5.3.3.2 Increasing Demand for High-Performance Airtight Breathable Membranes
5.3.4 Challenges
5.3.4.1 Increasing Technical Knowhow on Installation Procedures
6 Industry Trends (Page No. - 44)
6.1 Introduction
6.2 Value Chain Analysis
6.2.1 Raw Materials
6.2.2 Manufacturing, Compounding & Formulation
6.2.3 Distribution Network
6.2.4 End Users
6.3 Porter’s Five Forces Analysis
6.3.1 Threat of New Entrants
6.3.2 Threat of Substitutes
6.3.3 Bargaining Power of Suppliers
6.3.4 Bargaining Power of Buyers
6.3.5 Intensity of Competitive Rivalry
6.4 Macroeconomic Overview and Key Drivers
6.4.1 Introduction
6.4.2 Construction Industry Trends
6.4.2.1 Overview of North American Construction Industry
6.4.2.2 Overview of Europe an Construction Industry
6.4.2.3 Overview of Asia-Pacific Construction Industry
6.4.2.4 Overview of Middle East & Africa Construction Industry
6.4.2.5 Overview of Latin American Construction Industry
7 Breathable Membranes Market, By Type (Page No. - 54)
7.1 Introduction
7.2 PP
7.3 PE
7.4 Others
8 Breathable Membranes Market, By Application (Page No. - 61)
8.1 Introduction
8.2 Pitched Roof
8.3 Walls
9 Breathable Membranes Market, By Region (Page No. - 66)
9.1 Introduction
9.2 North America
9.2.1 U.S.
9.2.2 Canada
9.2.3 Mexico
9.3 Western Europe
9.3.1 Germany
9.3.2 France
9.3.3 U.K.
9.3.4 Norway
9.3.5 Sweden
9.3.6 Spain
9.3.7 Rest of Western Europe
9.4 Central & Eastern Europe
9.4.1 Russia
9.4.2 Poland
9.4.3 Rest of Central & Eastern Europe
9.5 Asia-Pacific
9.5.1 China
9.5.2 Japan
9.5.3 South Korea
9.5.4 Australia
9.5.5 Rest of Asia-Pacific
9.6 RoW
9.6.1 Turkey
9.6.2 South Africa
9.6.3 Saudi Arabia
9.6.4 Other Countries of RoW
10 Competitive Landscape (Page No. - 115)
10.1 Overview
10.2 Market Share Analysis
10.3 Key Growth Strategies in Breathable Membranes Market, 2012–2016
10.4 Competitive Benchmarking
10.4.1 New Product Launches
10.4.2 Expansions
10.4.3 Mergers & Acquisitions, 2012–2016
11 Company Profiles (Page No. - 120)
(Overview, Financial*, Products & Services, Strategy, and Developments)
11.1 E. I. Dupont De Nemours and Company
11.2 Saint-Gobain SA
11.3 Soprema Group
11.4 GAF Material Corporation
11.5 Kingspan Group PLC
11.6 Low & Bonar PLC
11.7 Knauf Insulation
11.8 Cosella-Dorken
11.9 IKO Industries Ltd
11.10 Riwega
11.11 Other Key Players
*Details Might Not Be Captured in Case of Unlisted Companies.
12 Appendix (Page No. - 139)
12.1 Insights From Industry Experts
12.2 Discussion Guide
12.3 Knowledge Store: Marketsandmarkets Subscription Portal
12.4 Introducing RT: Real-Time Market Intelligence
12.5 Available Customizations
12.6 Related Reports
List of Tables (143 Tables)
Table 1 Breathable Membranes Market to Register High Growth Between 2016 and 2021
Table 2 Contribution of Construction Industry to GDP of North America, 2014–2021 (USD Million)
Table 3 Contribution of Construction Industry to GDP of Europe, 2014–2021 (USD Million)
Table 4 Contribution of Construction Industry to GDP of Asia-Pacific, 2014–2021 (USD Million)
Table 5 Contribution of Construction Industry to GDP of Middle East & Africa, 2014–2021 (USD Million)
Table 6 Contribution of Construction Industry to GDP of Latin America, 2014–2021 (USD Million)
Table 7 Breathable Membranes Market Size, By Type, 2014–2026 (USD Million)
Table 8 Market Size, By Type, 2014–2026 (Million Square Meter)
Table 9 PP Market Size, 2014–2026 (USD Million)
Table 10 PP Market Size, 2014–2026 (Million Square Meter)
Table 11 PE Market Size, 2014–2026 (USD Million)
Table 12 PE Market Size, 2014–2026 (Million Square Meter)
Table 13 Other Breathable Membranes Market Size, 2014–2026 (USD Million)
Table 14 Other Market Size, 2014–2026 (Million Square Meter)
Table 15 Breathable Membranes Market Size, By Application, 2014–2026 (USD Million)
Table 16 Market Size, By Application 2014–2026 (Million Square Meter)
Table 17 Market Size, By Pitched Roof Application, 2014–2026 (USD Million)
Table 18 Market Size, By Pitched Roof Application, 2014–2026 (Million Square Meter)
Table 19 Market Size, By Walls Application, 2014–2026 (USD Million)
Table 20 Market Size, By Walls Application, 2014–2026 (Million Square Meter)
Table 21 Market Size, By Region, 2014–2026 (USD Million)
Table 22 Market Size, By Region, 2014–2026 (Million Square Meter)
Table 23 North America: Breathable Membranes Market Size, By Country, 2014–2026 (USD Million)
Table 24 North America: Market Size, By Country, 2014–2026 (Million Square Meter)
Table 25 North America: Market Size, By Application, 2014–2026 (USD Million)
Table 26 North America: Market Size, By Application, 2014–2026 (Million Square Meter)
Table 27 North America: Market Size, By Type, 2014–2026 (USD Million)
Table 28 North America: Market Size, By Type, 2014–2026 (Million Square Meter)
Table 29 U.S.: Breathable Membranes Market Size, By Application, 2014–2026 (USD Million)
Table 30 U.S.: Market Size, By Application, 2014–2026 (Million Square Meter)
Table 31 U.S.: Market Size, By Type, 2014–2026 (USD Million)
Table 32 U.S.: Market Size, By Type, 2014–2026 (Million Square Meter)
Table 33 Canada: Breathable Membranes Market Size, By Application, 2014–2026 (USD Million)
Table 34 Canada: Market Size, By Application, 2014–2026 (Million Square Meter)
Table 35 Canada: Market Size, By Type, 2014–2026 (USD Million)
Table 36 Canada: Market Size, By Type, 2014–2026 (Million Square Meter)
Table 37 Mexico: Breathable Membranes Market Size, By Application, 2014–2026 (USD Million)
Table 38 Mexico: Market Size, By Application, 2014–2026 (Million Square Meter)
Table 39 Mexico: Market Size, By Type, 2014–2026 (USD Million)
Table 40 Mexico: Market Size, By Type, 2014–2026 (Million Square Meter)
Table 41 Western Europe: Breathable Membranes Market Size, By Country, 2014–2026 (USD Million)
Table 42 Western Europe: Market Size, By Country, 2014–2026 (Million Square Meter)
Table 43 Western Europe: Market Size, By Application, 2014–2026 (USD Million)
Table 44 Western Europe: Market Size, By Application, 2014–2026 (Million Square Meter)
Table 45 Western Europe: Market Size, By Type, 2014–2026 (USD Million)
Table 46 Western Europe: Market Size, By Type, 2014–2026 (Million Square Meter)
Table 47 Germany: Breathable Membranes Market Size, By Application, 2014–2026 (USD Million)
Table 48 Germany: Market Size, By Application, 2014–2026 (Million Square Meter)
Table 49 Germany: Market Size, By Type, 2014–2026 (USD Million)
Table 50 Germany: Market Size, By Type, 2014–2026 (Million Square Meter)
Table 51 France: Breathable Membranes Market Size, By Application, 2014–2026 (USD Million)
Table 52 France: Market Size, By Application, 2014–2026 (Million Square Meter)
Table 53 France: Market Size, By Type, 2014–2026 (USD Million)
Table 54 France: Market Size, By Type, 2014–2026 (Million Square Meter)
Table 55 U.K.: Breathable Membranes Market Size, By Application, 2014–2026 (USD Million)
Table 56 U.K.: Market Size, By Application, 2014–2026 (Million Square Meter)
Table 57 U.K.: Market Size, By Type, 2014–2026 (USD Million)
Table 58 U.K.: Market Size, By Type, 2014–2026 (Million Square Meter)
Table 59 Norway: Breathable Membranes Market Size, By Application, 2014–2026 (USD Million)
Table 60 Norway: Market Size, By Application, 2014–2026 (Million Square Meter)
Table 61 Norway: Market Size, By Type, 2014–2026 (USD Million)
Table 62 Norway: Market Size, By Type, 2014–2026 (Million Square Meter)
Table 63 Sweden: Breathable Membranes Market Size, By Application, 2014–2026 (USD Million)
Table 64 Sweden: Market Size, By Application, 2014–2026 (Million Square Meter)
Table 65 Sweden: Market Size, By Type, 2014–2026 (USD Million)
Table 66 Sweden: Market Size, By Type, 2014–2026 (Million Square Meter)
Table 67 Spain: Breathable Membranes Market Size, By Application, 2014–2026 (USD Million)
Table 68 Spain: Market Size, By Application, 2014–2026 (Million Square Meter)
Table 69 Spain: Market Size, By Type, 2014–2026 (USD Million)
Table 70 Spain: Market Size, By Type, 2014–2026 (Million Square Meter)
Table 71 Rest of Western Europe: Breathable Membranes Market Size, By Application, 2014–2026 (USD Million)
Table 72 Rest of Western Europe: Market Size, By Application, 2014–2026 (Million Square Meter)
Table 73 Rest of Western Europe: Market Size, By Type, 2014–2026 (USD Million)
Table 74 Rest of Western Europe: Market Size, By Type, 2014–2026 (Million Square Meter)
Table 75 Central & Eastern Europe: Breathable Membranes Market Size, By Country, 2014–2026 (USD Million)
Table 76 Central & Eastern Europe: Market Size, By Country, 2014–2026 (Million Square Meter )
Table 77 Central & Eastern Europe: Market Size, By Application, 2014–2026 (USD Million)
Table 78 Central & Eastern Europe: Market Size, By Application, 2014–2026 (Million Square Meter)
Table 79 Central & Eastern Europe: Market Size, By Type, 2014–2026 (USD Million)
Table 80 Central & Eastern Europe: Market Size, By Type, 2014–2026 (Million Square Meter)
Table 81 Russia: Breathable Membranes Market Size, By Application, 2014–2026 (USD Million)
Table 82 Russia: Market Size, By End Use-Industry, 2014–2026 (Million Square Meter)
Table 83 Russia: Market Size, By Type, 2014–2026 (USD Million)
Table 84 Russia: Market Size, By Type, 2014–2026 (Million Square Meter )
Table 85 Poland: Market Size, By Application, 2014–2026 (USD Million)
Table 86 Poland: Market Size, By Application, 2014–2026 (Million Square Meter )
Table 87 Poland: Market Size, By Type, 2014–2026 (USD Million)
Table 88 Poland: Market Size, By Type, 2014–2026 (Million Square Meter )
Table 89 Rest of Central & Eastern Europe: Breathable Membranes Market Size, By Application, 2014–2026 (USD Million)
Table 90 Rest of Central & Eastern Europe: Market Size, By Application, 2014–2026 (Million Square Meter )
Table 91 Rest of Central & Eastern Europe: Market Size, By Type, 2014–2026 (USD Million)
Table 92 Rest of Central & Eastern Europe: Market Size, By Type, 2014–2026 (Million Square Meter )
Table 93 Asia-Pacific: Breathable Membranes Market Size, By Country, 2014–2021 (USD Million)
Table 94 Asia-Pacific: Market Size, By Country, 2014–2021 (Million Square Meter )
Table 95 Asia-Pacific: Market Size, By Application, 2014–2026 (USD Million)
Table 96 Asia-Pacific: Market Size, By Application, 2014–2026 (Million Square Meter )
Table 97 Asia-Pacific: Market Size, By Type, 2014–2026 (USD Million)
Table 98 Asia-Pacific: Market Size, By Type, 2014–2026 (Million Square Meter )
Table 99 China: Breathable Membranes Market Size, By Application, 2014–2026 (USD Million)
Table 100 China: Market Size, By Application, 2014–2026 (Million Square Meter )
Table 101 China: Market Size, By Type, 2014–2026 (USD Million)
Table 102 China: \Market Size, By Type, 2014–2026 (Million Square Meter )
Table 103 Japan: Breathable Membranes Market Size, By Application, 2014–2026 (USD Million)
Table 104 Japan: Market Size, By Application, 2014–2026 (Million Square Meter )
Table 105 Japan: Market Size, By Type, 2014–2026 (USD Million)
Table 106 Japan: Market Size, By Type, 2014–2026 (Million Square Meter )
Table 107 South Korea: Breathable Membranes Market Size, By Application, 2014–2026 (USD Million)
Table 108 South Korea: Market Size, By Application, 2014–2026 (Million Square Meter )
Table 109 South Korea: Market Size, By Type, 2014–2026 (USD Million)
Table 110 South Korea: Market Size, By Type, 2014–2026 (Million Square Meter )
Table 111 Australia: Breathable Membranes Market Size, By Application, 2014–2026 (USD Million)
Table 112 Australia: Market Size, By Application, 2014–2026 (Million Square Meter )
Table 113 Australia: Market Size, By Type, 2014–2026 (USD Million)
Table 114 Australia: Market Size, By Type, 2014–2026 (Million Square Meter )
Table 115 Rest of Asia-Pacific: Breathable Membranes Market Size, By Application, 2014–2026 (USD Million)
Table 116 Rest of Asia-Pacific: Market Size, By Application, 2014–2026 (Million Square Meter )
Table 117 Rest of Asia-Pacific: Market Size, By Type, 2014–2026 (USD Million)
Table 118 Rest of Asia-Pacific: Market Size, By Type, 2014–2026 (Million Square Meter )
Table 119 RoW: Breathable Membranes Market Size, By Country, 2014–2026 (USD Million)
Table 120 RoW: Market Size, By Country, 2014–2026 (Million Square Meter )
Table 121 RoW: Market Size, By Application, 2014–2026 (USD Million)
Table 122 RoW: Market Size, By Application, 2014–2026 (Million Square Meter )
Table 123 RoW: Market Size, By Type, 2014–2026 (USD Million)
Table 124 RoW: Market Size, By Type, 2014–2026 (Million Square Meter )
Table 125 Turkey: Breathable Membranes Market Size, By Application, 2014–2026 (USD Million)
Table 126 Turkey: Market Size, By Application, 2014–2026 (Million Square Meter )
Table 127 Turkey: Market Size, By Type, 2014–2026 (USD Million)
Table 128 Turkey: Market Size, By Type, 2014–2026 (Million Square Meter )
Table 129 South Africa: Breathable Membranes Market Size, By Application, 2014–2026 (USD Million)
Table 130 South Africa: Market Size, By Application, 2014–2026 (Million Square Meter )
Table 131 South Africa: Market Size, By Type, 2014–2026 (USD Million)
Table 132 South Africa: Market Size, By Type, 2014–2026 (Million Square Meter )
Table 133 Saudi Arabia: Breathable Membranes Market Size, By Application, 2014–2026 (USD Million)
Table 134 Saudi Arabia: Market Size, By Application, 2014–2026 (Million Square Meter )
Table 135 Saudi Arabia: Market Size, By Type, 2014–2026 (USD Million)
Table 136 Saudi Arabia: Market Size, By Type, 2014–2026 (Million Square Meter )
Table 137 Other Countries of RoW: Breathable Membranes Market Size, By Application, 2014–2026 (USD Million)
Table 138 Other Countries of RoW: Market Size, By Application, 2014–2026 (Million Square Meter )
Table 139 Other Countries of RoW: Market Size, By Type, 2014–2026 (USD Million)
Table 140 Other Countries of RoW: Market Size, By Type, 2014–2026 (Million Square Meter )
Table 141 New Product Launches, 2012–2016
Table 142 Expansions, 2012–2016
Table 143 Mergers & Acquisitions, 2012–2016
List of Figures (48 Figures)
Figure 1 Breathable Membranes Market: Research Design
Figure 2 Bottom-Up Approach
Figure 3 Top-Down Approach
Figure 4 Research Methodology: Data Triangulation
Figure 5 PE Breathable Membranes to Register the Highest CAGR During Forecast Period
Figure 6 Pitched Roof Application to Dominate Breathable Membranes Market Between 2016 and 2021
Figure 7 Norway to Register the Fastest Growth in Western European Breathable Membranes Market
Figure 8 Breathable Membrane Size, By Country, 2015 (USD Million)
Figure 9 North America Dominated Breathable Membranes Market in 2015
Figure 10 Attractive Market Opportunities in Breathable Membranes Market
Figure 11 PE to Be the Fastest-Growing Type of Breathable Membranes Between 2016 and 2021
Figure 12 U.S. Accounted for the Largest Share of Breathable Membranes Market in North America, in 2015
Figure 13 China Projected to Witness Fastest Growth Rate for Breathable Membranes Market, During Forecast Period
Figure 14 U.S. to Dominate Breathable Membranes Market During the Forecast Period
Figure 15 Pitched Roof to Be the Most Lucrative Market for Breathable Membranes
Figure 16 Breathable Membranes Market, By Region
Figure 17 Drivers, Restraints, Opportunities, and Challenges in Breathable Membranes Market
Figure 18 European Construction Industry Overview (2005–2015)
Figure 19 Maximum Value is Added During Manufacturing Stage
Figure 20 Porter’s Five Forces Analysis
Figure 21 U.S. to Dominate Construction Industry in North America Between 2016 and 2021
Figure 22 U.K. to Dominate European Construction Industry Between 2016 and 2021
Figure 23 China to Dominate Asia-Pacific Construction Industry Between 2016 and 2021
Figure 24 Saudi Arabia to Dominate Construction Industry in Middle East & Africa Between 2016 and 2021
Figure 25 Brazil to Dominate Construction Industry in Latin America Between 2016 and 2021
Figure 26 PP to Dominate Breathable Membranes Market During the Forecast Period
Figure 27 North America to Dominate PP Breathable Membranes Market
Figure 28 Asia-Pacific to Be the Fastest-Growing PE Breathable Membranes Market
Figure 29 Pitched Roof Application to Dominate Breathable Membranes Market
Figure 30 Western Europe to Dominate Pitched Roof Application During the Forecast Period
Figure 31 Asia-Pacific to be the Fastest-Growing Market By Application
Figure 32 Asia-Pacific is Emerging as Strategic Destination
Figure 33 Mexico to Be the Fastest-Growing Market in North America, Between 2016 and 2021
Figure 34 Germany Dominated Breathable Membranes Market in Western Europe, 2015
Figure 35 Asia-Pacific Breathable Membranes Market Snapshot: China, Japan, and South Korea are the Most Lucrative Markets
Figure 36 New Product Launches and Expansions Were the Key Growth Strategies During Forecast Period
Figure 37 GAF Material Corporation Dominates North American Breathable Membranes Market
Figure 38 Expansions and New Product Launches to be the Key Development Strategies, 2012–2016
Figure 39 E. I. Dupont De Nemours and Company: Company Snapshot
Figure 40 E. I. Dupont De Nemours and Company: SWOT Analysis
Figure 41 Saint-Gobain SA: Company Snapshot
Figure 42 Saint-Gobain SA: SWOT Analysis
Figure 43 Soprema Group: Company Snapshot
Figure 44 Soprema Group: SWOT Analysis
Figure 45 GAF Material Corporation: SWOT Analysis
Figure 46 Kingspan Group PLC: Company Snapshot
Figure 47 Kingspan Group PLC: SWOT Analysis
Figure 48 Low & Bonar PLC: Company Snapshot


Growth opportunities and latent adjacency in Breathable Membranes Market