Bioliquid Heat and Power Generation Market by Application (Heat Production and Electricity Generation), Type (Bioethanol and Biodiesel), and Region (North America, Europe, Asia Pacific, Row) - Global Forecast to 2022


[106 Pages Report] The global bioliquid heat and power generation market was valued at USD 1.57 Billion in 2016 and is projected to grow at a CAGR of 6.54%, during the forecast period, to reach USD 2.29 Billion by 2022. The increased recycling of waste products, reduction in carbon emissions, and availability of technology to convert feedstocks to liquid biofuels are the major factors driving the bioliquid heat and power generation market. Improving energy security is one of the major opportunities for this market.
The years considered for the study are as follows:
- Base Year: 2016
- Estimated Year: 2017
- Projected Year: 2022
- Forecast Period: 2017�2022
The base year for company profiles is 2016. Whenever information was unavailable for the base year, the prior year has been considered.
Objectives of the Study
- To define, describe, segment, and forecast the global bioliquid heat and power generation market based on application, type, and region
- To provide detailed information regarding the major factors influencing the growth of the bioliquid heat and power generation market (drivers, restraints, opportunities, and industry-specific challenges)
- To strategically analyze the bioliquid heat and power generation market with respect to individual growth trends and contributions of each segment to the market
- To analyze market opportunities for stakeholders and provide details of the competitive landscape for companies in this industry
- To strategically profile key players and comprehensively analyze their market shares.
- To track and analyze competitive developments such as contracts & agreements, investments and expansions, new product developments, and mergers & acquisitions in the bioliquid heat and power generation market
Research Methodology
This research study involved the use of extensive secondary sources, directories, and databases such as Hoover�s, Bloomberg Businessweek, Factiva, and OneSource to identify and collect information useful for a technical, market-oriented, and commercial study of the global bioliquid heat and power generation market. The primary sources include industry experts from core and related industries such as biomass and biofuels and chemicals, preferred suppliers, manufacturers, distributors, technology developers, standards and certification organizations of companies, and organizations related to all the segments of this industry�s value chain. The points below explain the research methodology.
- Study of annual revenues and market developments of major players that provide bioliquids
- Analyses of major end-users and applications of bioliquid heat and power generation
- Assessment of future trends and growth of the bioliquid heat and power generation market
- Assessment of the bioliquid heat and power generation market with respect to type of application
- Study of the contracts and developments related to the bioliquid heat and power generation market by key players across different regions
- Finalization of overall market sizes by triangulating the supply-side data, which includes product developments, supply chains, and annual revenues of companies providing bioliquid heat and power generation across the globe
After arriving at the overall market size, the total market has been split into several segments and sub-segments. The figure below illustrates the breakdown of primaries conducted during the research study on the basis of company type, designation, and region.
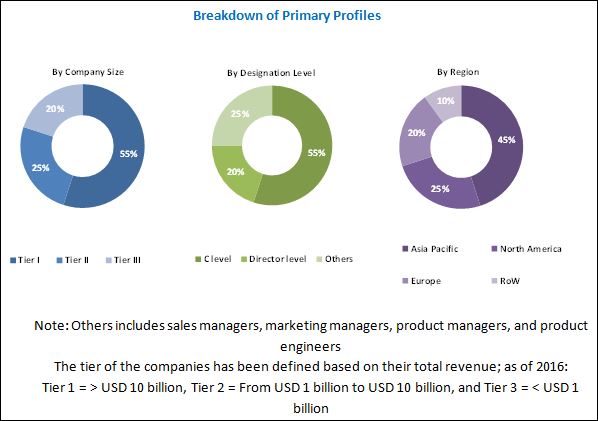
To know about the assumptions considered for the study, download the pdf brochure
Market Ecosystem:
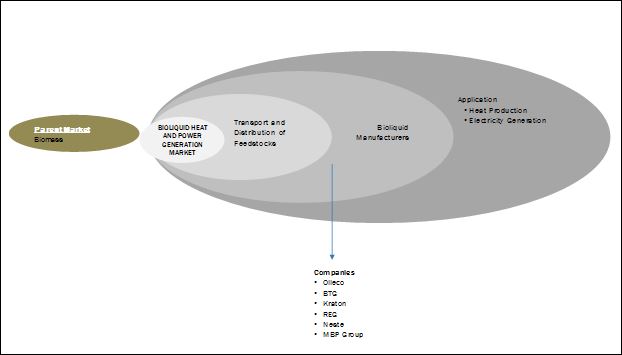
The ecosystem of the global bioliquids heat and power generation market starts with the transportation and distribution of raw material/feedstocks. The various feedstocks of bioliquids include used cooking oil, sugar, starch, and agricultural waste. The next stage is the manufacturing of bioliquids where all the feedstocks are assembled to extract bioliquids. These bioliquids are then distributed for applications such heat production and electricity generation.
Target Audience:
The report�s target audience includes:
- Mineral oil companies
- Cogeneration companies
- Government organizations
- Renewable energy associations
- Biomass power associations
- Combined heat and power generation companies
- Government and power research organizations
Scope of the Report:
- By Application
- Heat Production
- Electricity Generation
- By Type
- Bioethanol
- Biodiesel
- By Region
- Asia Pacific
- North America
- Europe
- Rest of the World
Available Customizations:
With the given market data, MarketsandMarkets offers customizations as per the client�s specific needs. The following customization options are available for this report:
Regional Analysis
Further breakdown of region or country-specific analyses
Company Information
Detailed analyses and profiling of additional market players (up to 5)
The global bioliquid heat and power generation market is estimated to be USD 1.67 Billion in 2017 and is projected to grow at a CAGR of 6.54%, from 2017 to 2022, to reach a market size of USD 2.29 Billion by 2022. The bioliquid heat and generation market is driven by factors such as the easy availability of feedstocks and reduction in carbon emissions. The availability of technology to convert feedstocks to liquid biofuels is expected to boost the demand for bioliquid heat and power generation. The emerging markets in Asia Pacific present a great opportunity for the bioliquid heat and power generation market due to significant government initiatives to promote renewable energy generation through biofuels.
The report segments the bioliquid heat and power generation market, by application, into heat production and electricity generation. The heat production segment is estimated to lead the bioliquid heat and power generation market in 2017. The heat production segment is also projected to grow at the fastest rate during the forecast period due to the easy availability of feedstocks for heat production. In Europe, the major demand for heat production is from the residential sector. This will boost the overall heat production market.
Based on type, bioethanol segment accounted for the largest market size in 2016. Bioethanol is a type of bioliquid generated from feedstocks such as sugar, wheat, and maize. The bioethanol market accounted for more than half of the bioliquid heat and power generation market in 2016. These factors are expected to drive the bioethanol segment of the bioliquid heat and power generation market, by type.
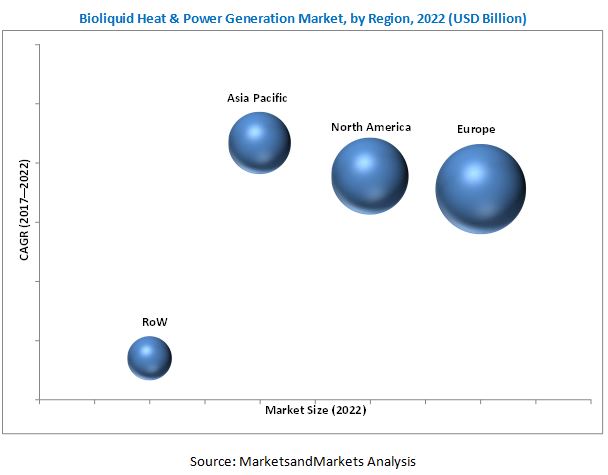
The bioliquid heat and power generation market has been analyzed with respect to 4 regions, namely, Europe, North America, Asia Pacific, and the rest of the world. The market in Europe is expected to lead the global bioliquid heat and power generation market by 2022. The market size in this region can be attributed to the increasing focus on the renewable energy sector, of which bioliquid is a part. Countries such as Germany, the UK, and France are the key markets for bioliquid heat and power generation in Europe. The stringent regulatory framework regarding bioliquids in the region is expected to drive the market in Europe.
A uniform regulatory framework related to bioliquids is required to address the economic and environmental impact of the production of bioliquids. Apart from a few countries such as Germany and the US, there is a lack of appropriate administrative procedures and framework to manage projects related to bioliquid. This lack of a regulatory framework is expected to act as a restraint for the bioliquid heat and power generation market.
The key players in the bioliquid heat and power generation market include REG (US), Neste (Finland), Kraton (US), BTG (Netherlands), and Olleco (UK). Mergers & acquisitions was the most commonly adopted strategy by the top players in the market from 2014 to 2017. It was followed by new product developments, contracts & agreements, and investments and expansions.
To speak to our analyst for a discussion on the above findings, click Speak to Analyst
 Exclusive indicates content/data unique to MarketsandMarkets and not available with any competitors.
Table of Contents
1 Introduction (Page No. - 11)
1.1 Objectives of the Study
1.2 Market Definition
1.3 Market Scope
1.3.1 Markets Covered
1.3.2 Regional Scope
1.3.3 Years Considered for the Study
1.4 Currency
1.5 Stakeholders
2 Research Methodology (Page No. - 14)
2.1 Research Data
2.1.1 Secondary Data
2.1.1.1 Key Data From Secondary Sources
2.1.2 Primary Data
2.1.2.1 Key Data From Primary Sources
2.1.2.2 Key Industry Insights
2.1.2.3 Breakdown of Primaries
2.2 Market Size Estimation
2.2.1 Bottom-Up Approach
2.2.2 Top-Down Approach
2.3 Market Breakdown & Data Triangulation
3 Executive Summary (Page No. - 21)
4 Premium Insights (Page No. - 24)
4.1 Bioliquid Heat & Power Generation Market, By Country
4.2 European Bioliquid Heat & Power Generation Market, By Country & Type
4.3 Bioliquid Heat & Power Generation, By Technology
4.4 Bioliquid Heat & Power Generation Market, By Type
5 Market Overview (Page No. - 28)
5.1 Introduction
5.2 Market Dynamics
5.2.1 Drivers
5.2.1.1 Need to Reduce Carbon Emissions
5.2.1.2 Easy Feedstock Availability
5.2.1.3 Availability of Advanced Technology to Convert Feedstock to Liquid Biofuels
5.2.1.4 High Recycling Rate of Waste Products
5.2.2 Restraints
5.2.2.1 Stringent Restrictions on Vegetable Oils for Bioliquid Conversion
5.2.2.2 Lack of Uniform Regulatory Framework
5.2.3 Opportunities
5.2.3.1 Emerging Markets Such as Asia Pacific
5.2.3.2 Improving Energy Security
5.2.4 Challenges
5.2.4.1 Off-Grid Solar
5.2.4.2 Bulk Capacity Generation
5.3 Supply Chain Analysis
6 Bioliquid Heat & Power Generation Market, By Application (Page No. - 34)
6.1 Introduction
6.2 Heat Production
6.2.1 By Region
6.2.1.1 Europe
6.2.1.2 North America
6.2.1.3 Asia Pacific
6.2.1.4 Rest of the World
6.3 Electricity Generation
6.3.1 By Region
6.3.1.1 Europe
6.3.1.2 North America
6.3.1.3 Asia Pacific
6.3.1.4 Rest of the World
7 Bioliquid Heat & Power Generation Market, By Type (Page No. - 42)
7.1 Introduction
7.2 Bioethanol
7.3 Biodiesel
8 Bioliquid Heat and Power Generation Market, By Region (Page No. - 46)
8.1 Introduction
8.2 North America
8.2.1 By Application
8.2.2 By Type
8.2.3 By Country
8.2.3.1 US
8.2.3.2 Canada
8.2.3.3 Mexico
8.3 Europe
8.3.1 By Application
8.3.2 By Type
8.3.3 By Country
8.3.3.1 Germany
8.3.3.2 UK
8.3.3.3 Italy
8.3.3.4 France
8.3.3.5 Rest of Europe
8.4 Asia Pacific
8.4.1 By Application
8.4.2 By Type
8.4.3 By Country
8.4.3.1 China
8.4.3.2 Japan
8.4.3.3 India
8.4.3.4 South Korea
8.4.3.5 Rest of Asia Pacific
8.5 Rest of the World
8.5.1 By Application
8.5.2 By Type
8.5.3 By Country
8.5.3.1 Mauritius
8.5.3.2 Nigeria
8.5.3.3 Brazil
8.5.3.4 South Africa
8.5.3.5 Others
9 Competitive Landscape (Page No. - 65)
9.1 Introduction
9.2 Market Ranking Analysis
9.3 Competitive Situations & Trends
9.3.1 New Product Launches
9.3.2 Investments & Expansions
9.3.3 Mergers & Acquisitions
9.3.4 Contracts & Agreements
9.3.5 Others (Partnerships/Collaborations/Joint Ventures/Awards & Recognitions)
10 Company Profiles (Page No. - 70)
(Overview, Products Offered, Recent Developments, SWOT Analysis, MnM View)*
10.1 Olleco
10.2 BTG
10.3 Kraton
10.4 REG
10.5 Neste
10.6 REG Power Management
10.7 MBP Group
10.8 Biox
10.9 Bunge
10.10 Ensyn Fuels
10.11 Betarenewables
10.12 Munzer Bioindustrie
10.13 Argent Energy
10.14 Encontech
*Details on Overview, Products Offered, Recent Developments, SWOT Analysis, MnM View Might Not Be Captured in Case of Unlisted Companies.
11 Appendix (Page No. - 98)
11.1 Industry Insights
11.2 Discussion Guide
11.3 Knowledge Store: Marketsandmarkets� Subscription Portal
11.4 Introducing RT: Real-Time Market Intelligence
11.5 Available Customizations
11.6 Related Reports
11.7 Author Details
List of Tables (54 Tables)
Table 1 Bioliquid Heat & Power Generation
Table 2 Waste-To-Energy Statistics, 2014
Table 3 Electrification Rate, By Country, 2010�2014
Table 4 Bioliquid Heat & Power Generation Market Size, By Application, 2015�2022 (USD Million)
Table 5 Heat Production Market Size, By Region, 2015�2022 (USD Million)
Table 6 Europe: Heat Production Market Size, By Country, 2015�2022 (USD Million)
Table 7 North America: Heat Production Market Size, By Country, 2015�2022 (USD Million)
Table 8 Asia Pacific: Heat Production Market Size, By Country, 2015�2022 (USD Million)
Table 9 Rest of the World: Heat Production Market Size, By Country, 2015�2022 (USD Million)
Table 10 Electricity Generation Market Size, By Region, 2015�2022 (USD Million)
Table 11 Europe: Electricity Generation Market Size, By Country, 2015�2022 (USD Million)
Table 12 North America: Electricity Generation Market Size, By Country, 2015�2022 (USD Million)
Table 13 Asia Pacific: Electricity Generation Market Size, By Country, 2015�2022 (USD Million)
Table 14 Rest of the World: Electricity Generation Market Size, By Country, 2015�2022 (USD Million)
Table 15 Bioliquid Heat & Power Generation Market Size, By Type, 2015�2022 (USD Million)
Table 16 Bioethanol: Bioliquid Heat & Power Generation Market Size, By Region, 2015�2022 (USD Million)
Table 17 Biodiesel: Bioliquid Heat & Power Generation, By Region, 2015�2022 (USD Million)
Table 18 Bioliquid Heat & Power Generation Market, By Region, 2015�2022 (USD Million)
Table 19 North America: Bioliquid Heat & Power Generation Market Size, By Application, 2015�2022 (USD Million)
Table 20 North America: Bioliquid Heat & Power Generation Market Size, By Type, 2015�2022 (USD Million)
Table 21 North America: Bioliquid Heat & Power Generation Market Size, By Country, 2015�2022 (USD Million)
Table 22 US: Bioliquid Heat & Power Generation Market Size, By Application, 2015�2022 (USD Million)
Table 23 Canada: Bioliquid Heat & Power Generation Market Size, By Application, 2015�2022 (USD Million)
Table 24 Mexico: Bioliquid Heat & Power Generation Market Size, By Application, 2015�2022 (USD Million)
Table 25 Europe: Bioliquid Heat & Power Generation Market Size, By Application, 2015�2022 (USD Million)
Table 26 Europe: Bioliquid Heat & Power Generation Market Size, By Type, 2015�2022 (USD Million)
Table 27 Europe: Bioliquid Heat & Power Generation Market Size, By Country, 2015�2022 (USD Million)
Table 28 Germany: Bioliquid Heat & Power Generation Market Size, By Application, 2015�2022 (USD Million)
Table 29 UK: Bioliquid Heat & Power Generation Market Size, By Application, 2015�2022 (USD Million)
Table 30 Italy: Bioliquid Heat & Power Generation Market, By Application, 2015�2022 (USD Million)
Table 31 France: Bioliquid Heat & Power Generation Market Size, By Application, 2015�2022 (USD Million)
Table 32 Rest of Europe: Bioliquid Heat & Power Generation Market Size, By Application, 2015�2022 (USD Million)
Table 33 Asia Pacific: Bioliquid Heat & Power Generation Market Size, By Application, 2015�2022 (USD Million)
Table 34 Asia Pacific: Bioliquid Heat & Power Generation Market Size, By Type, 2015�2022 (USD Million)
Table 35 Asia Pacific: Bioliquid Heat & Power Generation Market Size, By Country, 2015�2022 (USD Million)
Table 36 China: Bioliquid Heat & Power Generation Market Size, By Application, 2015�2022 (USD Million)
Table 37 Japan: Bioliquid Heat & Power Generation Market, By Application, 2015�2022 (USD Million)
Table 38 India: Bioliquid Heat & Power Generation Market Size, By Application, 2015�2022 (USD Million)
Table 39 South Korea: Bioliquid Heat & Power Generation Market Size, By Application, 2015�2022 (USD Million)
Table 40 Rest of Asia Pacific: Bioliquid Heat & Power Generation Market, By Application, 2015�2022 (USD Million)
Table 41 Rest of the World: Bioliquid Heat & Power Generation Market Size, By Application, 2015�2022 (USD Million)
Table 42 Rest of the World: Bioliquid Heat and Power Generation Market Size, By Type, 2015�2022 (USD Million)
Table 43 Rest of the World: Bioliquid Heat & Power Generation Market Size, By Country, 2015�2022 (USD Million)
Table 44 MauritiUS: Bioliquid Heat & Power Generation Market Size, By Application, 2015�2022 (USD Million)
Table 45 Nigeria: Bioliquid Heat & Power Generation Market, By Application, 2015�2022 (USD Million)
Table 46 Brazil: Bioliquid Heat & Power Generation Market, By Application, 2015�2022 (USD Million)
Table 47 South Africa: Bioliquid Heat & Power Generation Market, By Application, 2015�2022 (USD Million)
Table 48 Others: Bioliquid Heat & Power Generation Market Size, By Application, 2015�2022 (USD Million)
Table 49 Market Developments From 2014�2017
Table 50 New Product Launches, 2016�2017
Table 51 Investments & Expansions, 2015�2017
Table 52 Mergers & Acquisitions, 2016�2017
Table 53 Contracts & Agreements, 2014�2016
Table 54 Others (Partnerships/Collaborations/Joint Ventures/Awards & Recognitions), 2014�2017
List of Figures (27 Figures)
Figure 1 Bioliquid Heat & Power Generation Market Segmentation
Figure 2 Research Design
Figure 3 Bottom-Up Approach
Figure 4 Top-Down Approach
Figure 5 Data Triangulation Methodology
Figure 6 Europe Held the Largest Share of the Bioliquid Heat & Power Generation Market in 2016
Figure 7 The Heat Production Market is Expected to Grow at the Highest CAGR During the Forecast Period
Figure 8 The Bioethanol Segment Dominated the Bioliquid Heat & Power Generation Market in 2016
Figure 9 Attractive Opportunities in the Bioliquid Heat & Power Generation Market During the Forecast Period
Figure 10 The Indian Market is Expected to Grow at the Highest CAGR During the Forecast Period
Figure 11 Germany Accounted for the Largest Share of the European Bioliquid Heat & Power Generation Market in 2016
Figure 12 The Heat Production Market is Expected to Grow at the Highest CAGR During the Forecast Period
Figure 13 The Bioethanol Segment is Expected to Dominate the Bioliquid Heat & Power Generation Market During the Forecast Period
Figure 14 Market Dynamics: Overview
Figure 15 Biomass Use in Industry, By Country, 2016
Figure 16 Bioliquid Heat & Power Generation Market: Supply Chain Analysis
Figure 17 The Heat Production Segment is Expected to Dominate the Bioliquid Heat & Power Generation Market
Figure 18 The Bioethanol Segment is Expected to Hold the Larger Market Share During the Forecast Period
Figure 19 North America: Market Snapshot
Figure 20 Europe: Market Snapshot
Figure 21 Key Developments in the Bioliquid Heat & Power Generation Market, 2014�2017
Figure 22 Market Ranking Based on Revenue, 2016
Figure 23 Kraton: Company Snapshot
Figure 24 REG: Company Snapshot
Figure 25 Neste: Company Snapshot
Figure 26 Biox: Company Snapshot
Figure 27 Bunge: Company Snapshot


Growth opportunities and latent adjacency in Bioliquid Heat and Power Generation Market