Bearing Isolators Market by Material Type (Metallic and Non-Metallic), End-use Industry (Oil & Gas, Chemical Processing, Mining, Paper & Pulp, Metal Processing, and Manufacturing & Processing), and Region - Global Forecast to 2022


[131 Pages Report] Bearing Isolators Market size was valued at USD 1.19 Billion in 2016 and is expected to reach USD 1.67 Billion by 2022, at a CAGR of 5.7% from 2017 to 2022.
The objectives of this study are:
- To define, describe, and forecast the bearing isolators market based on material type, end-use industry, and region, in terms of both volume and value
- To strategically analyze micromarkets with respect to individual growth trends, prospects, and contribution to the total market
- To analyze the opportunities in the market for stakeholders and provide a competitive landscape of the market
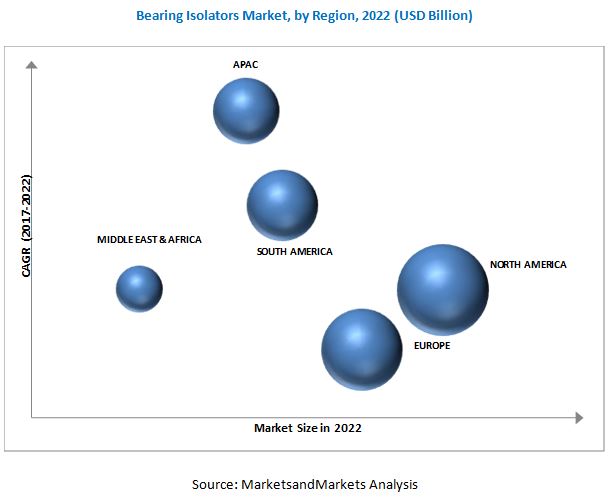
- To forecast the market size, in terms of value, with respect to key regions, namely, Asia Pacific, North America, Europe, Middle East & Africa, and South America (along with their countries)
- To strategically profile key players and comprehensively analyze their core competencies
- To analyze competitive developments such, new product launches in the bearing isolators market
The years considered for the study are:
- Base Year � 2016
- Estimated Year � 2017
- Projected Year � 2022
- Forecast Period � 2017 to 2022
- For company profiles in the report, 2016 has been considered as the base year. In cases, wherein information was unavailable for the base year, the years prior to it have been considered.
Research Methodology
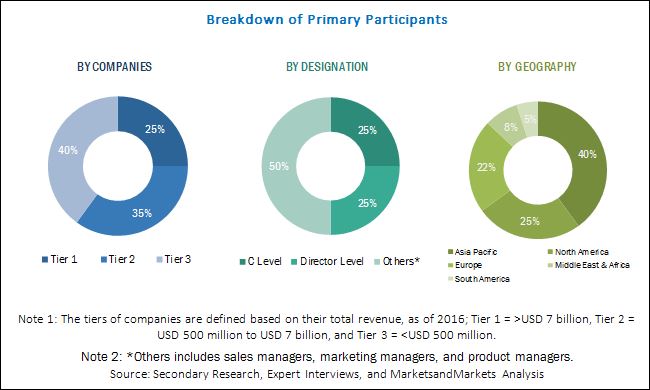
The research methodology used to estimate and forecast the bearing isolators market began with capturing data of key vendor revenues through secondary sources such as Hoovers, Bloomberg, Chemical Weekly, Factiva, and various other government and private websites. Vendor offerings were taken into consideration to determine the market segmentation. After arriving at the overall market size, the total market was split into several segments and subsegments, which were later verified through primary research by conducting extensive interviews with key personnel such as CEOs, VPs, directors, and executives. Data triangulation and market breakdown procedures were employed to complete the overall market engineering process and arrive at the exact statistics for all the segments and subsegments of the market. The breakdown of the profiles of primaries is depicted in the figure below.
To know about the assumptions considered for the study, download the pdf brochure
The bearing isolators market has a diversified ecosystem of upstream players, including raw material suppliers, along with downstream stakeholders, vendors, end users, and government organizations. Companies operating in the bearing isolators market include Inpro/Seal (US), The Timken Company (US), Aesseal (UK), Parker Hannifin (US), Flowserve Corporation (US), Garlock Sealing Technologies (US), John Crane (US), Baldor Electric Company, Inc., (US), Elliott Group (US), Advance Sealing International (US), Beacon Gasket & Seals Co. (US), IsoMag Corporation (US), etc.
Target Audience
- Bearing Isolator Manufacturers, Dealers, and Suppliers
- Government Bodies
- End-use Industries
- Feedstock Suppliers
- Industry Associations
- Investment Banks
- Consulting Companies/Consultants in Chemical and Material Sectors
The bearing isolators market is estimated to be USD 1.26 Billion in 2017 and is expected to reach USD 1.67 Billion by 2022, at a CAGR of 5.7% from 2017 to 2022. Rising awareness about the advantages offered by bearing isolators and their growing demand from end-use industries such as oil & gas, chemical processing, mining, paper & pulp, manufacturing & processing, etc., are leading the bearing isolators market.
Based on material type, metallic is expected to be the fastest-growing segment of the bearing isolators market during the forecast period. The growing demand for metallic bearing isolators from the oil & gas and chemical industries is one of the key factor fueling the growth of the bearing isolators market globally.
Oil & gas, chemical processing, mining, paper & pulp, metal processing, and manufacturing & processing are some of the key end-use industries of bearing isolators. Oil & gas is expected to be the fastest-growing end-use industry segment of the bearing isolators market. The chemical processing segment is expected to be the second-largest end-use industry segment.
The North America region is expected to lead the bearing isolators market in 2017. The US and Canada are the major markets for bearing isolators in the region. The growth of the North America bearing isolators market can be attributed to the rising demand for bearing isolators from various end-use industries such as oil & gas, chemical processing, mining, manufacturing & processing, etc. Leading players in this region have been adopting organic strategies, such as new product launches to meet the growing demand from these industries.
�This study answers several questions for the stakeholders, primarily the market segments on which they need to focus on during the next two to five years, so that they may prioritize their efforts and investments accordingly.�
Scope of the Report: This research report categorizes the bearing isolators market based on material type, end-use industry, and region, forecasting revenues as well as analyzing trends in each of the submarkets.
Based on Material Type:
- Metallic
- Non-metallic
Based on End-use Industry:
- Oil & Gas
- Chemical Processing
- Mining
- Paper & Pulp
- Metal Processing
- Manufacturing & Processing
Based on Region:
- Asia Pacific
- North America
- Europe
- Middle East & Africa
- South America
The following customization options are available for the report:
With the given market data, MarketsandMarkets offers customizations as per the company�s specific needs. The following customization options are available for the report:
- Further breakdown of the Rest of Asia Pacific, Rest of Europe, and Rest of Middle East & Africa bearing isolators market
- Detailed analysis and profiling of additional market players (up to five)
- Further breakdown of material type, by country
- Breakdown of end-use industry, in terms of value
The bearing isolators market is estimated to be USD 1.26 Billion in 2017 and is expected to reach USD 1.67 Billion by 2022, at a CAGR of 5.7% from 2017 to 2022. Rising awareness about the advantages offered by bearing isolators and their growing demand from end-use industries such as oil & gas, chemical processing, mining, paper & pulp, manufacturing & processing, etc., are leading the bearing isolators market.
Based on material type, metallic is expected to be the fastest-growing segment of the bearing isolators market during the forecast period. The growing demand for metallic bearing isolators from the oil & gas and chemical industries is one of the key factor fueling the growth of the bearing isolators market globally.
Oil & gas, chemical processing, mining, paper & pulp, metal processing, and manufacturing & processing are some of the key end-use industries of bearing isolators. Oil & gas is expected to be the fastest-growing end-use industry segment of the bearing isolators market. The chemical processing segment is expected to be the second-largest end-use industry segment.
The North America region is expected to lead the bearing isolators market in 2017. The US and Canada are the major markets for bearing isolators in the region. The growth of the North America bearing isolators market can be attributed to the rising demand for bearing isolators from various end-use industries such as oil & gas, chemical processing, mining, manufacturing & processing, etc. Leading players in this region have been adopting organic strategies, such as new product launches to meet the growing demand from these industries.
Factors inhibiting the growth of the bearing isolators market include volatile raw material prices and the high price of bearing isolators as compared to other sealing products. Companies such as Inpro/Seal (US), The Timken Company (US), Aesseal (UK), Parker Hannifin (US), Flowserve Corporation (US), Garlock Sealing Technologies (US), John Crane (US), Baldor Electric Company, Inc., (US), Elliott Group (US), Advance Sealing International (US), Beacon Gasket & Seals Co. (US), and IsoMag Corporation (US), etc., are the leading players in the bearing isolators market. Companies have adopted strategies such as new product launches to meet the growing demand for bearing isolators and increase their market shares.
To speak to our analyst for a discussion on the above findings, click Speak to Analyst
 Exclusive indicates content/data unique to MarketsandMarkets and not available with any competitors.
Table of Contents
1 Introduction (Page No. - 15)
1.1 Objectives of the Study
1.2 Market Definition
1.3 Market Scope
1.3.1 Years Considered for the Study
1.4 Currency
1.5 Stakeholders
1.6 Limitations
2 Research Methodology (Page No. - 18)
2.1 Research Data
2.1.1 Secondary Data
2.1.1.1 Key Data From Secondary Sources
2.1.2 Primary Data
2.1.2.1 Key Data From Primary Sources
2.1.2.2 Key Industry Insights
2.1.2.3 Breakdown of Primary Interviews
2.2 Market Size Estimation
2.2.1 Bottom-Up Approach
2.2.2 Top-Down Approach
2.3 Data Triangulation
2.4 Assumptions
3 Executive Summary (Page No. - 26)
4 Premium Insights (Page No. - 31)
4.1 Attractive Market Opportunities in the Bearing Isolators Market
4.2 Bearing Isolators Market, By Material Type
4.3 Bearing Isolators Market, By End-Use Industry and Material Type
4.4 Bearing Isolators Market, By End-Use Industry
4.5 Bearing Isolators Market: Developing vs Developed Nations
4.6 Bearing Isolators Market Growth
5 Market Overview (Page No. - 36)
5.1 Introduction
5.2 Market Dynamics
5.2.1 Drivers
5.2.1.1 Growing Demand for Bearing Isolators From Emerging Countries
5.2.1.2 Rising Awareness About the Benefits of Bearing Isolators
5.2.2 Restraints
5.2.2.1 High Price of Bearing Isolators as Compared to Contact Type Sealing Products
5.2.3 Opportunities
5.2.3.1 Increasing Use of Bearing Isolators in Rotating Equipment
5.2.3.2 Minimum Failure Rate of Bearing Isolators
5.2.4 Challenges
5.2.4.1 Volatility of Raw Material Prices
5.3 Porter�s Five Forces Analysis
5.3.1 Threat of New Entrants
5.3.2 Threat of Substitutes
5.3.3 Bargaining Power of Suppliers
5.3.4 Bargaining Power of Buyers
5.3.5 Intensity of Competitive Rivalry
5.4 Economic Indicators
5.4.1 Oil & Gas
5.4.2 Manufacturing
6 Bearing Isolators Market, By Material Type (Page No. - 46)
6.1 Introduction
6.2 Metallic Bearing Isolator
6.3 Non-Metallic Bearing Isolator
7 Bearing Isolators Market, By End-Use Industry (Page No. - 50)
7.1 Introduction
7.2 Oil & Gas
7.3 Chemical Processing
7.4 Mining
7.5 Paper & Pulp
7.6 Metal Processing
7.7 Manufacturing & Processing
7.8 Others
8 Bearing Isolators Market, By Region (Page No. - 58)
8.1 Introduction
8.2 Asia Pacific
8.2.1 China
8.2.2 Japan
8.2.3 India
8.2.4 South Korea
8.2.5 Indonesia
8.2.6 Australia
8.2.7 Malaysia
8.2.8 Rest of Asia Pacific
8.3 Europe
8.3.1 Germany
8.3.2 France
8.3.3 UK
8.3.4 Netherlands
8.3.5 Russia
8.3.6 Spain
8.3.7 Rest of Europe
8.4 North America
8.4.1 US
8.4.2 Canada
8.4.3 Mexico
8.5 Middle East & Africa
8.5.1 Saudi Arabia
8.5.2 Qatar
8.5.3 Kuwait
8.5.4 Rest of Middle East & Africa
8.6 South America
8.6.1 Brazil
8.6.2 Argentina
8.6.3 Chile
8.6.4 Rest of South America
9 Competitive Landscape (Page No. - 105)
9.1 Overview
9.2 Market Ranking Analysis
9.3 Competitive Secnario
9.3.1 New Product Launches
10 Company Profiles (Page No. - 108)
(Overview, Financial*, Products & Services, Strategy, and Developments)
10.1 Inpro/Seal
10.2 The Timken Company
10.3 Aesseal
10.4 Parker Hannifin
10.5 Flowserve Corporation
10.6 Garlock Sealing Technologies
10.7 John Crane
10.8 Baldor Electric Company
10.9 Elliott Group
10.10 Advanced Sealing International
10.11 Beacon Gasket & Seals Co.
10.12 Isomag Corporation
*Details Might Not Be Captured in Case of Unlisted Companies
11 Appendix (Page No. - 125)
11.1 Discussion Guide
11.2 Knowledge Store: Marketsandmarkets Subscription Portal
11.3 Available Customizations
11.4 Related Reports
11.5 Author Details
List of Tables (121 Tables)
Table 1 Global Bearing Isolators Market Snapshot, 2017 vs 2022
Table 2 Bearing Isolators Market, By Material Type, 2015-2022 (Units)
Table 3 Bearing Isolators Market, By Material Type, 2015-2022 (USD Million)
Table 4 Metallic Bearing Isolators Market, By Region, 2015-2022 (Units)
Table 5 Metallic Bearing Isolators Market, By Region, 2015-2022 (USD Million)
Table 6 Non-Metallic Bearing Isolators Market, By Region, 2015-2022 (Units)
Table 7 Non-Metallic Bearing Isolators Market, By Region, 2015-2022 (USD Million)
Table 8 Bearing Isolators Market, By End-Use Industry, 2015-2022 (Units)
Table 9 Oil & Gas: Bearing Isolators Market, By Region, 2015-2022 (Units)
Table 10 Chemical Processing: Bearing Isolators Market, By Region, 2015-2022 (Units)
Table 11 Mining: Bearing Isolators Market, By Region, 2015-2022 (Units)
Table 12 Paper & Pulp: Bearing Isolators Market, By Region, 2015-2022 (Units)
Table 13 Metal Processing: Bearing Isolators Market, By Region, 2015-2022 (Units)
Table 14 Manufacturing & Processing: Bearing Isolators Market, By Region, 2015-2022 (Units)
Table 15 Others: Bearing Isolators Market , By Region, 2015-2022 (Units)
Table 16 Bearing Isolators Market, By Region, 2015�2022 (Units)
Table 17 By Market, By Region, 2015�2022 (USD Million)
Table 18 Asia Pacific By Market, By Country, 2015�2022 (Units)
Table 19 Asia Pacific By Market, By Country, 2015�2022 (USD Million)
Table 20 Asia Pacific By Market, By End-Use Industry, 2015�2022 (Units)
Table 21 Asia Pacific By Market, By Material Type, 2015�2022 (Units)
Table 22 Asia Pacific By Market, By Material Type, 2015�2022 (USD Million)
Table 23 China By Market, By End-Use Industry, 2015�2022 (Units)
Table 24 China By Market, By Material Type, 2015�2022 (Units)
Table 25 China By Market, By Material Type, 2015�2022 (USD Million)
Table 26 Japan By Market, By End-Use Industry, 2015�2022 (Units)
Table 27 Japan By Market, By Material Type, 2015�2022 (Units)
Table 28 Japan By Market, By Material Type, 2015�2022 (USD Million)
Table 29 India By Market, By End-Use Industry, 2015�2022 (Units)
Table 30 India By Market, By Material Type, 2015�2022 (Units)
Table 31 India By Market, By Material Type, 2015�2022 (USD Million)
Table 32 South Korea By Market, By End-Use Industry, 2015�2022 (Units)
Table 33 South Korea By Market, By Material Type, 2015�2022 (Units)
Table 34 South Korea By Market, By Material Type, 2015�2022 (USD Million)
Table 35 Indonesia By Market, By End-Use Industry, 2015�2022 (Units)
Table 36 Indonesia By Market, By Material Type, 2015�2022 (Units)
Table 37 Indonesia By Market, By Material Type, 2015�2022 (USD Million)
Table 38 Australia By Market, By End-Use Industry, 2015�2022 (Units)
Table 39 Australia By Market, By Material Type, 2015�2022 (Units)
Table 40 Australia By Market, By Material Type, 2015�2022 (USD Million)
Table 41 Malaysia By Market, By End-Use Industry, 2015�2022 (Units)
Table 42 Malaysia By Market, By Material Type, 2015�2022 (Units)
Table 43 Malaysia By Market, By Material Type, 2015�2022 (USD Million)
Table 44 Rest of Asia Pacific By Market, By End-Use Industry, 2015�2022 (Units)
Table 45 Rest of Asia Pacific By Market, By Material Type, 2015�2022 (Units)
Table 46 Rest of Asia Pacific By Market, By Material Type, 2015�2022 (USD Million)
Table 47 Europe By Market, By Country, 2015�2022 (Units)
Table 48 Europe By Market, By Country, 2015�2022 (USD Million)
Table 49 Europe By Market, By End-Use Industry, 2015�2022 (Units)
Table 50 Europe By Market, By Material Type, 2015�2022 (Units)
Table 51 Europe By Market, By Material Type, 2015�2022 (USD Million)
Table 52 Germany By Market, By End-Use Industry, 2015�2022 (Units)
Table 53 Germany By Market, By Material Type, 2015�2022 (Units)
Table 54 Germany By Market, By Material Type, 2015�2022 (USD Million)
Table 55 France By Market, By End-Use Industry, 2015�2022 (Units)
Table 56 France By Market, By Material Type, 2015�2022 (Units)
Table 57 France By Market, By Material Type, 2015�2022 (USD Million)
Table 58 UK By Market, By End-Use Industry, 2015�2022 (Units)
Table 59 UK By Market, By Material Type, 2015�2022 (Units)
Table 60 UK By Market, By Material Type, 2015�2022 (USD Million)
Table 61 Netherlands By Market, By End-Use Industry, 2015�2022 (Units)
Table 62 Netherlands By Market, By Material Type, 2015�2022 (Units)
Table 63 Netherlands By Market, By Material Type, 2015�2022 (USD Million)
Table 64 Russia By Market, By End-Use Industry, 2015�2022 (Units)
Table 65 Russia By Market, By Material Type, 2015�2022 (Units)
Table 66 Russia By Market, By Material Type, 2015�2022 (USD Million)
Table 67 Spain By Market, By End-Use Industry, 2015�2022 (Units)
Table 68 Spain By Market, By Material Type, 2015�2022 (Units)
Table 69 Spain By Market, By Material Type, 2015�2022 (USD Million)
Table 70 Rest of Europe By Market, By End-Use Industry, 2015�2022 (Units)
Table 71 Rest of Europe By Market, By Material Type, 2015�2022 (Units)
Table 72 Rest of Europe By Market, By Material Type, 2015�2022 (USD Million)
Table 73 North America By Market, By Country, 2015�2022 (Units)
Table 74 North America By Market, By Country, 2015�2022 (USD Million)
Table 75 North America By Market, By End-Use Industry, 2015�2022 (Units)
Table 76 North America By Market, By Material Type, 2015�2022 (Units)
Table 77 North America By Market, By Material Type, 2015�2022 (USD Million)
Table 78 US By Market, By End-Use Industry, 2015�2022 (Units)
Table 79 US By Market, By Material Type, 2015�2022 (Units)
Table 80 US By Market, By Material Type, 2015�2022 (USD Million)
Table 81 Canada By Market, By End-Use Industry, 2015�2022 (Units)
Table 82 Canada By Market, By Material Type, 2015�2022 (Units)
Table 83 Canada By Market, By Material Type, 2015�2022 (USD Million)
Table 84 Mexico By Market, By End-Use Industry, 2015�2022 (Units)
Table 85 Mexico By Market, By Material Type, 2015�2022 (Units)
Table 86 Mexico By Market, By Material Type, 2015�2022 (USD Million)
Table 87 Middle East & Africa By Market, By Country, 2015�2022 (Units)
Table 88 Middle East & Africa By Market, By Country, 2015�2022 (USD Million)
Table 89 Middle East & Africa By Market, By End-Use Industry, 2015�2022 (Units)
Table 90 Middle East & Africa By Market, By Material Type, 2015�2022 (Units)
Table 91 Middle East & Africa By Market, By Material Type, 2015�2022 (USD Million)
Table 92 Saudi Arabia By Market, By End-Use Industry, 2015�2022 (Units)
Table 93 Saudi Arabia By Market, By Material Type, 2015�2022 (Units)
Table 94 Saudi Arabia By Market, By Material Type, 2015�2022 (USD Million)
Table 95 Qatar By Market, By End-Use Industry, 2015�2022 (Units)
Table 96 Qatar By Market, By Material Type, 2015�2022 (Units)
Table 97 Qatar By Market, By Material Type, 2015�2022 (USD Million)
Table 98 Kuwait By Market, By End-Use Industry, 2015�2022 (Units)
Table 99 Kuwait By Market, By Material Type, 2015�2022 (Units)
Table 100 Kuwait By Market, By Material Type, 2015�2022 (USD Million)
Table 101 Rest of Middle East & Africa By Market, By End-Use Industry, 2015�2022 (Units)
Table 102 Rest of Middle East & Africa By Market, By Material Type, 2015�2022 (Units)
Table 103 Rest of Middle East & Africa By Market, By Material Type, 2015�2022 (USD Million)
Table 104 South America By Market, By Country, 2015�2022 (Units)
Table 105 South America By Market, By Country, 2015�2022 (USD Million)
Table 106 South America By Market, By End-Use Industry, 2015�2022 (Units)
Table 107 South America By Market, By Material Type, 2015�2022 (Units)
Table 108 South America By Market, By Material Type, 2015�2022 (USD Million)
Table 109 Brazil By Market, By End-Use Industry, 2015�2022 (Units)
Table 110 Brazil By Market, By Material Type, 2015�2022 (Units)
Table 111 Brazil By Market, By Material Type, 2015�2022 (USD Million)
Table 112 Argentina By Market, By End-Use Industry, 2015�2022 (Units)
Table 113 Argentina By Market, By Material Type, 2015�2022 (Units)
Table 114 Argentina By Market, By Material Type, 2015�2022 (USD Million)
Table 115 Chile By Market, By End-Use Industry, 2015�2022 (Units)
Table 116 Chile By Market, By Material Type, 2015�2022 (Units)
Table 117 Chile By Market, By Material Type, 2015�2022 (USD Million)
Table 118 Rest of South America By Market, By End-Use Industry, 2015�2022 (Units)
Table 119 Rest of South America By Market, By Material Type, 2015�2022 (Units)
Table 120 Rest of South America By Market, By Material Type, 2015�2022 (USD Million)
Table 121 New Product Launches, 2012-2017
List of Figures (30 Figures)
Figure 1 Bearing Isolators Market: Research Design
Figure 2 Bearing Isolators Market: Data Triangulation
Figure 3 Oil & Gas End-Use Industry Segment Projected to Lead the Global Bearing Isolators Market Between 2017 and 2022
Figure 4 Metallic Segment Anticipated to Lead the Bearing Isolators Market By 2022
Figure 5 Asia Pacific Projected to Grow at the Higest CAGR in the Bearing Isolators Market
Figure 6 Asia Pacific Projected to Grow at the Highest CAGR Between 2017 and 2022
Figure 7 Bearing Isolators Market Projected to Witness Significant Growth Between 2017 and 2022
Figure 8 Metallic Material Segment Anticipated to Grow at A Higher CAGR Between 2017 and 2022
Figure 9 Oil & Gas End-Use Industry Accounted for the Largest Share of the Bearing Isolators Market in 2016
Figure 10 Oil & Gas End-Use Industry Segment Estimated to Account for the Largest Market Share in 2017
Figure 11 Developing Nations to Register Higher CAGR Than Developed Nations Between 2017 and 2022
Figure 12 China to Grow at the Highest CAGR Between 2017 and 2022
Figure 13 Drivers, Restraints, Opportunities, and Challenges for the Bearing Isolators Market
Figure 14 Increased Production of Palm Oil in Indonesia in the Past Decade has Led to the Rise in Sales of Bearing Isolators
Figure 15 Average Crude Oil Prices, (USD Per Barrel), 2005-2016
Figure 16 Porter�s Five Forces Analysis
Figure 17 Number of Refineries Worldwide, 2010 & 2015
Figure 18 Manufacturing Industry Growth Rate, 2016
Figure 19 Metallic Material Type to Lead the Bearing Isolators Market, 2017-2022
Figure 20 Oil & Gas End-Use Industry Segment to Lead the Global Bearing Isolators Market During the Forecast Period
Figure 21 Bearing Isolators Market: Regional Snapshot, 2017-2022
Figure 22 Asia Pacific Bearing Isolators Market Snapshot
Figure 23 Europe Bearing Isolators Market Snapshot
Figure 24 North America Bearing Isolators Market Snapshot
Figure 25 Middle East & Africa Bearing Isolators Market Snapshot
Figure 26 South America Bearing Isolators Market Snapshot
Figure 27 Market Ranking of Key Players, 2016
Figure 28 The Timken Company: Company Snapshot
Figure 29 Parker Hannifin: Company Snapshot
Figure 30 Flowserve Corporation: Company Snapshot


Growth opportunities and latent adjacency in Bearing Isolators Market