Augmented Reality Software Market by Software Function (Remote Collaboration, Workflow Optimization), Vertical (Consumer, Commercial, Enterprise, Medical, Aerospace & Defense, Mining, Telecom & IT/Data Centers), and Geography - Global Forecast to 2022


The augmented reality software market was valued at USD 2.13 billion in 2016 and is expected to reach USD 35.22 billion by 2022, growing at a CAGR of 57.36% during the forecast period. The base year considered for this study is 2016, and the forecast period considered is between 2017 and 2022. The use of AR software market in applications such as consumer, commercial, medical, and enterprise is driving the market. The increased interest of large tech companies in augmented reality technology is one of the major factors driving this market. Smartphones have been recognized as the most promising device for the market in the future. Currently, with the growing usage of smartphones and AR browsers, consumers have started accepting this human–computer interaction (HCI) and augmented reality has gained more research interest and attention recently.
Market Dynamics
Drivers
- Increasing demand for AR-based software applications for 3D visualization in the medical sector
- Growing interest of the large tech companies in AR
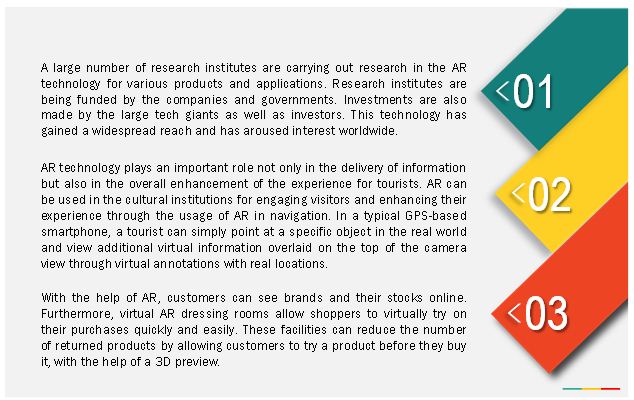
- Increase in the demand for AR in the e-commerce and retail sectors
Restraints
- Limited user interface (UI) affecting the navigation performance of AR applications
- Limited processing power and in adequate storage capacity
- Dependence of the technological developments on the advancements in computers and digital network
Opportunities
- Growing investments in the AR technology
- Increased use of AR in the tourism sector
- Opportunities in the automotive and industrial sectors
Challenges
- Low adoption rate due to privacy issues and complexities in the design
- Reconfiguration of applications for different platforms
Increasing demand for AR-based software applications for 3D visualization in the medical sector
The medical sector has witnessed a great deal of technological advancement in surgeries, diagnostics, equipment, remote consulting, and so on, with the help of AR. The use of AR in medical technology offers several advantages in surgeries, training of medical students, and so on. While performing the surgery with 3D visualization and modelling, AR technology provides a superimposed 3D model of the patient’s magnetic resonance imaging (MRI) or computed tomography (CT) scan, through which a doctor can see and analyze the patient’s body parts. This enables minimally invasive surgeries, which is beneficial for patients.
The objectives of the study are as follows:
- To define, describe, and forecast the AR software market
- To analyze the global market for the augmented reality software on the basis of software function, vertical, and geography
- To forecast the market size, in terms of value, for various verticals with regard to four main regions—North America, Europe, Asia Pacific (APAC), and Rest of the World (RoW)
- To strategically analyze the micromarkets with respect to the individual growth trends, future prospects, and contribution to the total market
- To evaluate the key strategies adopted by competitors in the market
- To determine the impact analysis of the market dynamics with factors that currently drive and restrain the growth of the market, along with the market trends
- To analyze the opportunities in the AR software market for various stakeholders by identifying high-growth segments of the market and through the use case analysis
- To strategically profile key players and comprehensively analyze their core competencies along with detailing the competitive landscape for market leaders
- To analyze various strategic developments such as mergers and acquisitions, new product developments, and R&D in the market
The augmented reality software market was valued at USD 2.13 billion in 2016 and is expected to reach USD 35.22 billion by 2022, growing at a CAGR of 57.36% during the forecast period. The increasing demand for AR-based software applications for 3D visualization in the medical sector, growing interest of large tech companies in AR, and increase in demand for AR in the e-commerce and retail sectors are the major drivers for the market.
This report covers the market on the basis of software function, vertical, and geography. The consumer, commercial, and enterprise verticals are expected to witness high growth in the overall market during the forecast period. The rising adoption of augmented reality technology is driving the growth of this market. The market for the consumer vertical is expected to grow at the highest rate between 2016 and 2022.
Smartphones have been recognized as the most promising device for the market in the future. Currently, with the growing usage of smartphones and AR browsers, consumers have started accepting this human–computer interaction (HCI) and augmented reality has gained more research interest and attention recently.
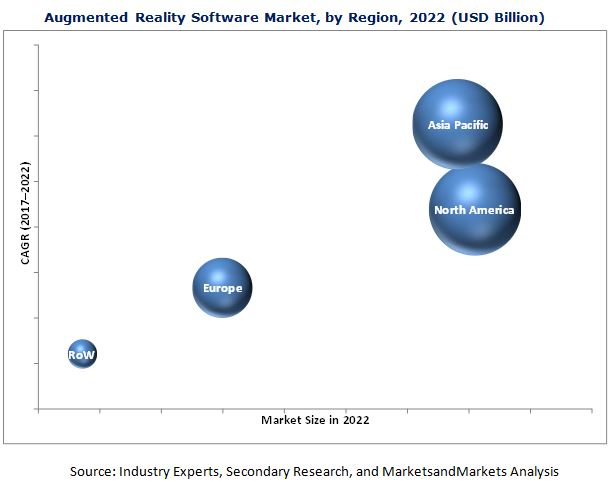
North America is expected to lead the market in terms of market size, and APAC is likely to witness the highest growth rate in the market. The augmented reality software market in APAC is expected to grow at a high rate between 2017 and 2022. The increasing number of players, increased adoption of AR technology, and the high growth in consumer and enterprise verticals are the major factors driving the growth of this market in APAC.
Augmented reality software applications in consumer, commercial, and enterprise drive the growth of AR software market
Consumer
The augmented reality technology offers remarkable results in terms of visual effects when used in gaming and sport broadcasts. Gaming and entertainment applications are the early adopters of new technologies; the recent addition to the list is 3D technology and augmented reality. AR can be used to enhance the gaming experience. There are some AR gaming applications in which players can create virtual objects and characters and then link those digital creatures to defined locations in the real world. Players can then easily interact with those digital objects in the real world. The entertainment industry is one of the major markets for 3D display technology. 3D cinema is one of the key applications of 3D technology, followed by 3D animation. Currently, an increasing number of movies are being made in 3D to cater to the growing demand for augmented reality experience in movies and music.
Commercial
The demand for AR applications in the education and e-retailing sectors is very high owing to the benefits of easy learning and attractive promotions. The technological advancements have completely changed the traditional approach to marketing and promotion. The use of the Internet and smartphones combined with digital content, such as augmented reality, has helped boost the marketing activity. These augmented reality applications are expected to revolutionize the world of online marketing and e-commerce.
Enterprise
Augmented reality is used in the enterprise vertical mainly for the training of personnel, providing information about industrial facility, remodeling and redesigning, and industrial simulations. Traditionally, training was conducted using classroom methods; however, the introduction of augmented reality has helped enhance the training methodology. It has given better visibility to the users.
Critical questions the report answers:
- What would be the role of gaming and entertainment sector to boost the growth of AR software market?
- Which would be the major countries adopting the AR software market technology in the manufacturing sector?
The limited user interface (UI) is affecting the navigation performance of AR applications, while the limited processing power and inadequate storage capacity are the major restraints for the market. This report discusses the drivers, restraints, opportunities, and challenges pertaining to the AR software market. In addition, it analyzes the current market scenario and forecasts the market size till 2022.
Some of the major companies operating in the augmented reality software market are PTC Inc. (U.S.), Wikitude GmbH (Austria), DAQRI LLC (U.S.), Zugara, Inc. (U.S.), Blippar (U.K.), Upskill (U.S.), Aurasma (U.K.), Augmate (U.S.), Catchoom Technologies S.L. (Spain), and Ubimax GmbH (Germany).
To speak to our analyst for a discussion on the above findings, click Speak to Analyst
 Exclusive indicates content/data unique to MarketsandMarkets and not available with any competitors.
Table of Contents
1 Introduction
1.1 Objectives
1.2 Market Definition
1.3 Study Scope
1.3.1 Markets Covered
1.3.2 Years Considered for the Study
1.4 Currency
1.5 Limitation
1.6 Stakeholders
2 Research Methodology
2.1 Research Data
2.1.1 Secondary Data
2.1.2 Primary Data
2.1.2.1 Key Data From Primary Sources
2.1.2.2 Breakdown of Primaries
2.2 Market Size Estimation
2.2.1 Bottom-Up Approach
2.2.2 Top-Down Approach
2.3 Market Breakdown and Data Triangulation
2.4 Research Assumptions
3 Executive Summary
4 Premium Insights
4.1 Attractive Market Opportunities in the AR Software Market
4.2 Consumer Vertical to Lead the Market
4.3 AR Software Market
4.4 APAC Expected to Be the Fastest Growing Region Between 2017 and 2022
5 Market Overview
5.1 Market Evolution
5.2 Market Dynamics
5.2.1 Drivers
5.2.2 Restraints
5.2.3 Opportunities
5.2.4 Challenges
5.2.5 Winning Imperative
5.3 Value Chain Analysis
6 Market By Software Function
6.1 Remote Collaboration
6.2 Workflow Optimization
6.3 Documentation
6.4 Visualization
6.5 3D Modelling
6.6 Navigation
7 Market By Vertical
7.1 Introduction
7.2 Consumer
7.2.1 Gaming
7.2.2 Sports and Entertainment
7.2.3 Use Case Analysis
7.2.4 Key Developments in Consumer Vertical
7.2.5 Case Study: Bang & Olufsen, Denmark
7.3 Commercial
7.3.1 Tourism and Sightseeing
7.3.2 E-Learning
7.3.3 E-Commerce and Marketing
7.3.4 Use Case Analysis
7.3.5 Key Developments in Commercial Vertical
7.3.6 Case Study: Lacoste S.A., France
7.3.7 Case Study: Inter Ikea Systems B.V., Netherlands
7.4 Enterprise
7.4.1 Use Case Analysis
7.4.2 Key Developments in Enterprise Vertical
7.4.3 Case Study: Energy Recovery Inc., Us
7.4.4 Case Study: Agco Corporation, Us
7.5 Medical
7.5.1 Use Case Analysis
7.5.2 Key Developments in Medical Vertical
7.5.3 Case Study: Almirall S.A., Spain
7.6 Aerospace & Defense
7.6.1 Use Case Analysis
7.6.2 Key Developments in Aerospace & Defense Vertical
7.6.3 Case Study: Airbus S.A.S., France
7.7 Oil & Gas
7.7.1 Use Case Analysis
7.7.2 Key Developments in Oil & Gas Vertical
7.7.3 Case Study: Oil and Natural Gas Corporation Limited, India
7.8 Mining
7.8.1 Use Case Analysis
7.8.2 Key Developments in Mining Vertical
7.8.3 Case Study: Landor Associates, Us
7.9 Telecom and It/Data Centers
7.9.1 Use Case Analysis
7.9.2 Use Case Analysis for It/Data Centers
7.9.3 Key Developments in It/Data Centers
7.10 Other Verticals
7.10.1 Automotive
7.10.2 Construction
7.10.3 Use Case Analysis for Transportation & Logistics
7.10.4 Use Case Analysis for Other Verticals
7.10.5 Key Developments in Other Verticals
7.10.6 Case Study: Toyota Motor Corporation, Japan
8 Geography
8.1 Introduction
8.2 North America
8.2.1 US
8.2.2 Canada
8.2.3 Mexico
8.3 Europe
8.3.1 UK
8.3.2 Germany
8.3.3 France
8.3.4 Rest of Europe
8.4 Asia Pacific
8.4.1 China
8.4.2 Japan
8.4.3 South Korea
8.4.4 India
8.4.5 Rest of APAC
8.5 Rest of the World
8.5.1 Middle East and Africa
8.5.2 South America
9 Competitive Landscape
9.1 Introduction
9.2 Market Ranking Analysis, AR Software Market
9.3 Competitive Scenario
9.4 Vendor Dive Overview
9.4.1 Vanguards (Leaders)
9.4.2 Dynamic Players
9.4.3 Innovators
9.4.4 Emerging Players
9.5 Business Strategies Adopted By Major Players in the Market (25 Companies)
9.6 Analysis of the Product Portfolio of Major Players in the Market (25 Companies)
PTC, Inc. (US); Wikitude GmbH (Austria); Daqri LLC (US); Zugara, Inc. (US); Blippar (UK); Upskill (UK); Magic Leap (US); Atheer, Inc. (US); Marxent Labs LLC (US); Eon Reality (US); Infinity Augmented Reality (Israel); Inglobe Technologies (Italy); Scope AR (Canada); Immerseport (Australia); Jbknowledge, Inc. (US); Re’flekt GmbH (Germany); Viewar GmbH (Austria); Mortar Studios (Australia); Wear S.R.L. (Italy); Kudan (U.K.); Aurasma (UK); Augmate (US); Pristine, Inc. (US); Catchoom Technologies S.L (Spain); Ubimax GmbH (Germany)
10 Company Profile
(Business Overview, Products Offered & Services Strategies, Key Insights, Recent Developments, MnM View)*
10.1 Introduction
10.2 PTC, Inc.
10.3 Wikitude GmbH
10.4 Daqri LLC
10.5 Zugara, Inc.
10.6 Blippar
10.7 Aurasma
10.8 Upskill
10.9 Augmate
10.10 Catchoom Technologies S.L.
10.11 Ubimax GmbH
10.12 Key Innovators
10.12.1 Magic Leap, Inc.
10.12.2 Atheer, Inc.
10.12.3 Marxent Labs LLC
10.12.4 Pristine Inc.
10.12.5 Inglobe Technologies
*Details on Business Overview, Products Offered & Services Strategies, Key Insights, Recent Developments, MnM View Might Not Be Captured in Case of Unlisted Companies.
11 Appendix
11.1 Insights of Industry Experts
11.2 Discussion Guide
11.3 Knowledge Store: Marketsandmarkets’ Subscription Portal
11.4 Introducing RT: Real Time Market Intelligence
11.5 Available Customizations
11.6 Related Reports
11.7 Authors Details
List of Tables (55 Tables)
Table 1 AR Software Market Size, By Region, 2014–2022 (USD Million)
Table 2 Reality Software Market: Consumer Vertical, By Region, 2014–2022 (USD Million)
Table 3 Market in North America for Consumer Vertical, By Country, 2014–2022 (USD Million)
Table 4 Market in Europe for Consumer Vertical, By Country, 2014–2022 (USD Million)
Table 5 Market in APAC for Consumer Vertical, By Country, 2014–2022 (USD Million)
Table 6 Market in RoW for Consumer Vertical, By Country, 2014–2022 (USD Million)
Table 7 Market: Commercial Vertical, By Region, 2014–2022 (USD Million)
Table 8 AR Software Market in North America for Commercial Vertical, By Country, 2014–2022 (USD Million)
Table 9 Market in Europe for Commercial Vertical, By Country, 2014–2022 (USD Million)
Table 10 Market in APAC for Commercial Vertical, By Country, 2014–2022 (USD Million)
Table 11 Market in RoW for Commercial Vertical, By Country, 2014–2022 (USD Million)
Table 12 Market: Enterprise Vertical, By Region, 2014–2022 (USD Million)
Table 13 Market in North America for Enterprise Vertical, By Country, 2014–2022 (USD Million)
Table 14 Market in Europe for Enterprise Vertical, By Country, 2014–2022 (USD Million)
Table 15 Market in APAC for Enterprise Vertical, By Country, 2014–2022 (USD Million)
Table 16 Market in RoW for Enterprise Vertical, By Country, 2014–2022 (USD Million)
Table 17 AR Software Market : Medical Vertical, By Region, 2014–2022 (USD Million)
Table 18 Market in North America for Medical Vertical, By Country, 2014–2022 (USD Million)
Table 19 Market in Europe for Medical Vertical, By Country, 2014–2022 (USD Million)
Table 20 Market in APAC for Medical Vertical, By Country, 2014–2022 (USD Million)
Table 21 Market in RoW for Medical Vertical, By Country, 2014–2022 (USD Million)
Table 22 Augmented Reality Software Market : Aerospace & Defense Vertical, By Region, 2014–2022 (USD Million)
Table 23 Market in North America for Aerospace & Defense Vertical, By Country, 2014–2022 (USD Million)
Table 24 Market in Europe for Aerospace & Defense Vertical, By Country, 2014–2022 (USD Million)
Table 25 Market in APAC for Aerospace & Defense Vertical, By Country, 2014–2022 (USD Million)
Table 26 Market in RoW for Aerospace & Defense Vertical, By Country, 2014–2022 (USD Million)
Table 27 AR Software Market : Oil & Gas Vertical, By Region, 2014–2022 (USD Million)
Table 28 Market in North America for Oil & Gas Vertical, By Country, 2014–2022 (USD Million)
Table 29 Market in Europe for Oil & Gas Vertical, By Country, 2014–2022 (USD Million)
Table 30 Market in APAC for Oil & Gas Vertical, By Country, 2014–2022 (USD Million)
Table 31 Market in RoW for Oil & Gas Vertical, By Country, 2014–2022 (USD Million)
Table 32 AR Software Market : Mining Vertical, By Region, 2014–2022 (USD Million)
Table 33 Market in North America for Mining Vertical, By Country, 2014–2022 (USD Million)
Table 34 Market in Europe for Mining Vertical, By Country, 2014–2022 (USD Million)
Table 35 Market in APAC for Mining Vertical, By Country, 2014–2022 (USD Million)
Table 36 Market in RoW for Mining Vertical, By Country, 2014–2022 (USD Million)
Table 37 AR Software Market : Telecom and It/Data Centers Vertical, By Region, 2014–2022 (USD Million)
Table 38 Market in North America for Telecom and It/Data Centers Vertical, By Country, 2014–2022 (USD Million)
Table 39 Market in Europe for Telecom and It/Data Centers Vertical, By Country, 2014–2022 (USD Million)
Table 40 AR Software Market in APAC for Telecom and It/Data Centers Vertical, By Country, 2014–2022 (USD Million)
Table 41 Market in RoW for Telecom and It/Data Centers Vertical, By Country, 2014–2022 (USD Million)
Table 42 Market: Other Verticals, By Region, 2014–2022 (USD Million)
Table 43 AR Software Market in North America for Other Verticals, By Country, 2014–2022 (USD Million)
Table 44 Market in Europe for Other Verticals, By Country, 2014–2022 (USD Million)
Table 45 Market in APAC for Other Verticals, By Country, 2014–2022 (USD Million)
Table 46 Market in RoW for Other Verticals, By Country, 2014–2022 (USD Million)
Table 47 Market Size, By Region, 2014–2022 (USD Million)
Table 48 Market in North America, By Country, 2014–2022 (USD Million)
Table 49 Market in North America, By Vertical, 2014–2022 (USD Million)
Table 50 Market in Europe, By Country, 2014–2022 (USD Million)
Table 51 Market in Europe, By Vertical, 2014–2022 (USD Million)
Table 52 Market in APAC, By Country, 2014–2022 (USD Million)
Table 53 Market in APAC, By Vertical, 2014–2022 (USD Million)
Table 54 Market in RoW, By Region, 2014–2022 (USD Million)
Table 55 Market in RoW, By Vertical, 2014–2022 (USD Million)
List of Figures (59 Figures)
Figure 1 Overview of the Micromarkets Covered
Figure 2 AR Software Market: Research Design
Figure 3 Market: Research Design
Figure 4 Key Data From Secondary Sources
Figure 5 Key Data From Primary Sources
Figure 6 AR Software Market Size Estimation Methodology: Bottom-Up Approach
Figure 7 AR Software Market Size Estimation Methodology: Top-Down Approach
Figure 8 Data Traingulation
Figure 9 Market, 2015–2022 (USD Billion)
Figure 10 Market, By Vertical, 2016 vs 2022 (USD Billion)
Figure 11 Consumer Vertical Expected to Witness the Highest Growth in the Market Between 2017 and 2022
Figure 12 North America Holds the Largest Market Share for Market in 2016
Figure 13 Region-Wise Market Size of Top 2 AR Software Market Verticals in 2016
Figure 14 Augmented Reality Software Market, 2017–2022 (USD Billion)
Figure 15 Market, By Vertical, 2017–2022 (USD Billion)
Figure 16 Commercial and Consumer Verticals Expected to Hold the Largest Market Share in 2017
Figure 17 US and China Would Be the Leading Countries in the AR Software Market
Figure 18 History and Evolution of Augmented Reality
Figure 19 Increased Demand for AR-Based Software in Medical, E-Commerce, and Retail Sectors Drives the AR Software Market
Figure 20 Value Chain Analysis of the AR Software Market (2016): Major Value Added During Research and Development Stage
Figure 21 Market for Consumer Vertical Expected to Grow at the Highest Rate During the Forecast Period
Figure 22 Geographic Snapshot: APAC Market to Grow at the Highest Rate Between 2017 and 2022
Figure 23 US to Lead the AR Software Market Between 2017 and 2022
Figure 24 Overview of AR Software Market in North America, 2016
Figure 25 Overview of AR Software Market in Europe, 2016
Figure 26 Overview of AR Software Market in Asia Pacific, 2016
Figure 27 Market Players Adopted New Product Lacunhes as Their Key Strategy
Figure 28 Battle for Market Share: New Product Laucnhes & Developments Were the Key Strategies Between 2013 and 2017
Figure 29 Dive Chart
Figure 30 Company Snapshot: PTC, Inc.
Figure 31 PTC, Inc.: Product Offerings
Figure 32 PTC, Inc.: Parameters for Business Strategies
Figure 33 Company Snapshot: Wikitude GmbH
Figure 34 Wikitude GmbH: Product Offerings
Figure 35 Wikitude GmbH: Parameters for Business Strategies
Figure 36 Company Snapshot: Daqri LLC
Figure 37 Daqri LLC: Product Offerings
Figure 38 Daqri LLC: Parameters for Business Strategies
Figure 39 Company Snapshot: Zugara, Inc.
Figure 40 Zugara, Inc.: Product Offerings
Figure 41 Zugara, Inc.: Parameters for Business Strategies
Figure 42 Company Snapshot: Blippar
Figure 43 Blippar : Product Offerings
Figure 44 Blippar : Parameters for Business Strategies
Figure 45 Company Snapshot: Aurasma
Figure 46 Aurasma : Product Offerings
Figure 47 Aurasma : Parameters for Business Strategies
Figure 48 Company Snapshot: Upskill
Figure 49 Upskill : Product Offerings
Figure 50 Upskill : Parameters for Business Strategies
Figure 51 Company Snapshot: Augmate
Figure 52 Augmate : Product Offerings
Figure 53 Augmate : Parameters for Business Strategies
Figure 54 Company Snapshot: Catchoom Technologies
Figure 55 Catchoom Technologies S.L.: Product Offerings
Figure 56 Catchoom Technologies S.L.: Parameters for Business Strategies
Figure 57 Company Snapshot: Ubimax GmbH
Figure 58 Ubimax GmbH: Product Offerings
Figure 59 Ubimax GmbH: Parameters for Business Strategies
The research methodology includes the use of primary and secondary data. Both top-down and bottom-up approaches have been used to estimate and validate the size of the market as well as that of the other dependent submarkets in the overall augmented reality software market. The key players in the market have been identified through secondary research. The secondary sources include annual reports, press releases, and investor presentations of companies; white papers, certified publications, and articles from recognized authors; directories; and databases. The secondary sources namely include VR/AR Association, AugmentedReality.Org, and Augmented Reality for Enterprise Alliance.
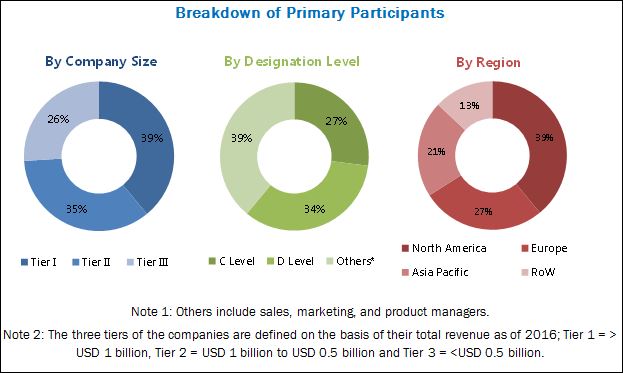
The research methodology includes the study of the annual and financial reports of the top market players and extensive interviews for key insights with industry leaders such as CEOs, VPs, directors, and marketing executives. All the percentage shares and breakdowns have been determined using secondary sources and verified through primary sources. All the possible parameters that affect the markets covered in this research study have been accounted for, viewed in extensive detail, verified through primary research, and analyzed to obtain the final quantitative and qualitative data. The breakdown of the profiles of primaries has been depicted in the figure below:
The value chain of the augmented reality software market includes developers of platforms, applications, and software for augmented reality. The major companies that are part of the value chain include PTC Inc. (U.S.), Wikitude GmbH (Austria), DAQRI LLC (U.S.), Zugara, Inc. (U.S.), Blippar (U.K.), Upskill (U.S.), Aurasma (U.K.), Augmate (U.S.), Catchoom Technologies S.L. (Spain), and Ubimax GmbH (Germany).
Major Market Developments
- In June 2016, PTC launched Vuforia Studio Enterprise, a new tool for publishing and authoring AR experiences for enterprises.
- In May 2015, DAQRI acquired ARToolworks (U.S.), one of the major players in the AR market and the creators of ARToolKit, a known library for AR application development.
- In May 2015, Wikitude entered into an investment partnership with Konica Minolta, an IT service provider, with the aim to innovate new products with the help of Konica Minolta’s technology.
Target Audience
- Electronic design automation (EDA) and design tool vendors
- AR technology platform developers
- AR technology solutions and service providers
- Research organizations
- Governments, financial institutions, and investment communities
- Technology standards organizations, forums, alliances, and associations
- End users
“The study answers several questions for the target audiences, primarily which market segments to focus on in the next two to five years for prioritizing efforts and investments.”
Report Scope
In this report, the AR software market has been segmented as follows:
Augmented Reality Software Market, by Software Function
- Remote Collaboration
- Workflow Optimization
- Visualization
- Documentation
- 3D Modelling
- Navigation
- Others
Augmented Reality Software Market, by Vertical
- Aerospace & Defense
- Medical
- Commercial
- Oil & Gas
- Mining
- Telecom
- IT/Data Centers
- Enterprise
- Consumer
- Others
AR Software Market, by Geography
- North America
- Europe
- Asia Pacific (APAC)
- Rest of the World (RoW)
Company Profiles
Detailed analysis of the major companies present in the market.
Critical questions which the report answers
- Which are the major applications in the augmented reality software market?
- What are the top use-cases for AR software market functions and applications?
Available Customizations
With the given market data, MarketsandMarkets offers customizations according to the company’s specific needs. The following customization options are available for the report:
Company Information
- Detailed analysis and profiling of additional market players (up to five)
- Quantitative data for the software functions


Growth opportunities and latent adjacency in Augmented Reality Software Market