Antifouling Paints and Coatings Market by Type (Copper-Based, Self-Polishing, Hybrid, Others), Application (Shipping Vessels, Drilling Rigs & Production Platforms, Others), Region (APAC, Europe, North America, MEA, Latin America) - Global Forecast to 2021


[185 Pages] Antifouling Paints and Coatings Market is projected to grow from USD 5.61 Billion in 2015 to USD 9.22 Billion by 2021, at a CAGR of 8.6% between 2016 and 2021.
The objectives of this study are:
- To define, describe, and forecast the antifouling paints & coatings market based on type, application, and region
- To analyze and forecast the volume (million liters) and value (USD million) of the global antifouling paints and coatings market
- To provide detailed information regarding key factors influencing the growth of the market, such as drivers, restraints, opportunities, and industry-specific challenges
- To strategically analyze micromarkets with respect to individual growth trends, future prospects, and contribution made to the overall market
- To analyze the opportunities in the market for stakeholders and draw a competitive landscape for market leaders
- To forecast the market size in terms of value with respect to five main regions (along with countries), namely, Asia-Pacific, Europe, North America, Middle East & Africa, and Latin America
- To strategically profile key players and comprehensively analyze their core competencies
- To analyze competitive developments, such as joint ventures, mergers & acquisitions, new product developments, and research & development activities (R&D) in the global antifouling paints & coatings market
The years considered for the study are:
- Historical Year – 2014
- Base Year – 2015
- Estimated Year – 2016
- Projected Year – 2021
- Forecast Period – 2016 to 2021
- For company profiles in the report, 2015 has been considered as the base year. In certain cases, wherein information is unavailable for the base year, the years prior to it have been considered.
Research Methodology
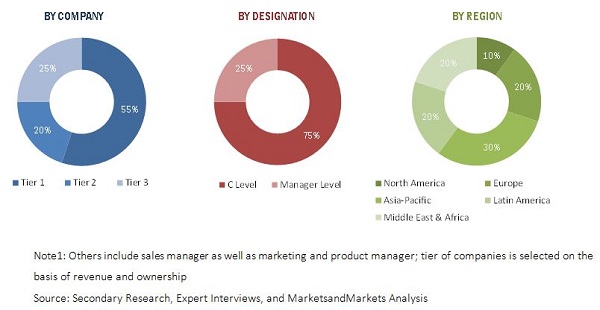
The research methodology used to estimate and forecast the global antifouling paints & coatings market begins with capturing data on key vendor revenues through secondary research. The vendor offerings are also taken into consideration to determine the market segmentation. After arriving at the overall market size, the total market was split into several segments and subsegments, which were later verified through primary research by conducting extensive interviews with key personnel, such as CEOs, VPs, directors, and executives. Data triangulation and market breakdown procedures were employed to complete the overall market engineering process and arrive at the exact statistics for all segments and subsegments of the market. The breakdown of profiles of primaries is depicted in the figure below.
To know about the assumptions considered for the study, download the pdf brochure
The global antifouling paints & coatings market has a diversified ecosystem of upstream players, including raw material suppliers, along with downstream stakeholders, vendors, end users, and government organizations. Companies operating in the global antifouling paints and coatings market include AkzoNobel N.V. (Netherlands), The Sherwin-Williams Company (U.S.), Nippon Paint Marine Coatings Co., Ltd. (Japan), Jotun (Norway), Hempel A/S (Denmark), and Chugoku Marine Paints, Ltd. (Japan), among others.
The report provides detailed qualitative and quantitative analysis of the global antifouling paints & coatings market, along with market drivers, restraints, opportunities, and challenges. The top players of this market are profiled in detail, along with recent developments and other strategic industry-related activities.
Target Audience
- Antifouling Paints & Coatings Producers
- Antifouling Paints & Coatings Traders, Suppliers, and Distributors
- Government and Research Organizations
- Association and Industrial Bodies
- Raw Material Suppliers and Distributors
- Shipping Companies
- Industry Associations
“This study answers several questions for the stakeholders, primarily which market segments to focus in the next two to five years for prioritizing the efforts and investments”.
Scope of the Report: This research report categorizes the global antifouling paints & coatings market on the basis of type, application, and region, forecasting revenues as well as analyzing trends in each of the submarkets.
On the basis of Type:
- Copper-based
- Self-Polishing Copolymer
- Hybrid
- Others
On the basis of Application:
- Shipping Vessels
- Drilling Rigs & Production Platforms
- Fishing Boats
- Yachts & Other Boats
- Inland Waterways Transport
- Mooring Lines
On the basis of Region:
- Asia-Pacific
- Europe
- North America
- Middle East & Africa
- Latin America
The following customization options are available for the report:
With the given market data, MarketsandMarkets offers customizations as per the company’s specific needs. The following customization options are available for the report:
Product Analysis
- Product Matrix, which gives a detailed comparison of product portfolio of each company
Geographic Analysis
- Further breakdown of rest of APAC and rest of Europe antifouling paints & coatings market
Company Information
- Detailed analysis and profiling of additional market players (Upto 5 companies).
The global antifouling paints & coatings market is projected to reach USD 9.22 Billion by 2021, at a CAGR of 8.6% between 2016 and 2021. This growth is mainly attributed to the increasing demand of antifouling paints and coatings from the shipping industry and rising concerns toward reduction in fuel consumption. These coatings play a key role to reduce fouling & corrosion, extend the vessel's life & efficiency, reduce operational costs, and avoid marine accidents & expensive repairs.
Among all types, the copper-based antifouling paints & coatings segment is the fastest-growing type segment in the market, as these coatings are environment-friendly and as such, are increasingly used in hulls and underwater surfaces of shipping vessels. Moreover, copper-based antifouling paints and coatings ensure fouling-free surfaces of ships or boats, which result in substantial fuel savings and consequently reduce emission of greenhouse gases.
The shipping vessels segment accounted for the largest share of the global antifouling paints & coatings market in 2015. Increasing usage of antifouling paints & coatings for protecting vessels from growth of fouling organisms, along with the extension of dry dock intervals is propelling the growth of the global antifouling paints and coatings market.
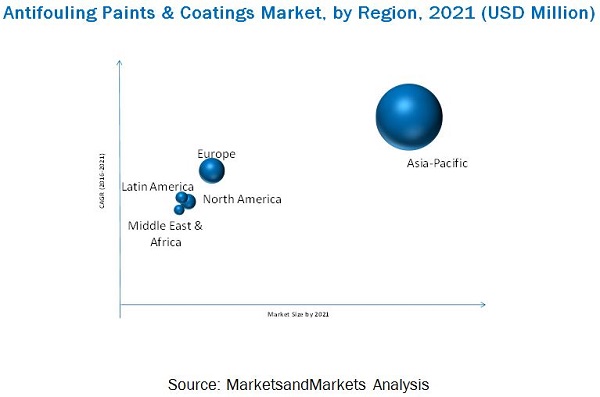
Asia-Pacific accounted for the largest share of the global antifouling paints and coatings market in 2015, and is expected to continue its dominance till 2021. China, South Korea, and Japan led the Asia-Pacific antifouling paints & coatings market in 2015. Among all countries in the Asia-Pacific, this market in China is projected to grow at the highest CAGR between 2016 and 2021.
The factors inhibiting the growth of the global antifouling paints & coatings market are volatile raw material prices and government regulations in the paints & coatings industry. Key market players operating in the global antifouling paints and coatings market, such as AkzoNobel N.V. (Netherlands), The Sherwin-Williams Company (U.S.), Nippon Paint Marine Coatings Co., Ltd. (Japan), Jotun (Norway), Hempel A/S (Denmark), and Chugoku Marine Paints, Ltd. (Japan), among others, have adopted various strategies to increase their market shares. Agreements/contracts/partnerships, new product/technology launches, expansions, acquisitions, and research & development are some of the key strategies adopted by market players to achieve growth in the global antifouling paints and coatings market.
Please visit 360Quadrants to see the vendor listing of Top paint and coating companies
To speak to our analyst for a discussion on the above findings, click Speak to Analyst
 Exclusive indicates content/data unique to MarketsandMarkets and not available with any competitors.
Table of Contents
1 Introduction (Page No. - 18)
1.1 Objectives of the Study
1.2 Market Definition
1.3 Market Scope
1.3.1 Years Considered for the Study
1.3.2 Markets Covered
1.4 Currency
1.5 Package Size
1.6 Limitations
1.7 Stakeholders
2 Research Methodology (Page No. - 21)
2.1 Research Data
2.1.1 Secondary Data
2.1.1.1 Key Data From Secondary Sources
2.1.2 Primary Data
2.1.2.1 Key Data From Primary Sources
2.1.2.2 Key Industry Insights
2.1.2.3 Breakdown of Primary Interviews: By Company, Designation, and Region
2.2 Market Size Estimation
2.2.1 Bottom-Up Approach
2.2.2 Top-Down Approach
2.3 Market Breakdown & Data Triangulation
2.4 Research Assumptions
2.4.1 Assumptions
3 Executive Summary (Page No. - 30)
4 Premium Insights (Page No. - 35)
4.1 Significant Opportunities in the Antifouling Paints & Coatings Market
4.2 Antifouling Paints & Coatings Market Growth, By Region
4.3 Antifouling Paints & Coatings Market Share in Asia-Pacific
4.4 Antifouling Paints & Coatings Market, By Type
4.5 Antifouling Paints & Coatings Market Size, By Application
4.6 Antifouling Paints & Coatings Market: Emerging Nations
5 Market Overview (Page No. - 39)
5.1 Introduction
5.2 Market Dynamics
5.2.1 Drivers
5.2.1.1 Increasing Demand of Antifouling Paints & Coatings From the Shipping Industry
5.2.1.2 Reduction in Fuel Consumption
5.2.2 Restraints
5.2.2.1 Volatile Raw Material Prices
5.2.2.2 Government Regulations
5.2.3 Opportunities
5.2.3.1 Upcoming Technologies in the Antifouling Paints & Coatings Industry
5.2.3.2 Increase in Demand of Antifouling Paints & Coatings From the Oil & Gas Industry
5.2.3.3 Increasing Demand From Asia-Pacific Region
5.2.4 Challenges
5.2.4.1 Cost of Dry Docking
5.3 Revenue Pocket Matrix
5.3.1 Revenue Pocket Matrix for Antifouling Paints & Coatings Type, 2015
5.3.2 Revenue Pocket Matrix for End-Use Industries, 2015
6 Industry Trends (Page No. - 47)
6.1 Value Chain Analysis
6.2 Economic Indicators
6.2.1 Industry Outlook
6.2.1.1 Marine Coatings Industry
6.2.2 Country Outlook
6.2.2.1 Brazil
6.2.2.2 Canada
6.2.2.3 China
6.2.2.4 France
6.2.2.5 Germany
6.2.2.6 India
6.2.2.7 Italy
6.2.2.8 Japan
6.2.2.9 Mexico
6.2.2.10 Saudi Arabia
6.2.2.11 South Korea
6.2.2.12 U.K.
6.2.2.13 U.S.
7 Environmental Regulations (Page No. - 56)
7.1 Introduction
7.1.1 Reach
7.1.2 MEPC Resolution
7.1.3 IMO-AFS Convention
7.1.4 EC AFS Regulation (No 782/2003)
7.1.5 New Zealand Craft Risk Management Standard
7.1.6 U.S. Federal and State Regulatory Context
7.2 Regulations Related to the Usage of Copper in Antifouling Paints & Coatings
7.2.1 Canada
7.2.2 U.S.
7.2.3 South Africa
7.2.4 Europe
7.3 Country-Specific Regulations
7.3.1 Sweden
7.3.2 U.K.
7.3.3 The Netherlands
7.3.4 Denmark
7.3.5 Switzerland
7.3.6 Asia
7.3.6.1 Japan
7.3.6.2 Korea
7.3.6.3 Hong Kong
7.3.6.4 Singapore/Malaysia/Taiwan/Thailand
7.3.6.5 Australia
7.3.6.6 New Zealand
8 Antifouling Paints & Coatings Market, By Type (Page No. - 60)
8.1 Introduction
8.2 Market Size and Projection
8.2.1 Copper-Based Antifouling Paints & Coatings
8.2.2 Self-Polishing Copolymer
8.2.3 Hybrid Antifouling Paints & Coatings
8.2.4 Others Antifouling Paints & Coatings
9 Antifouling Paints & Coatings Market, By Application (Page No. - 68)
9.1 Introduction
9.1.1 Shipping Vessels
9.1.2 Drilling Rigs & Production Platforms
9.1.3 Fishing Boats
9.1.4 Yachts & Other Boats
9.1.5 Mooring Lines
9.1.6 Inland Waterways Transport
10 Antifouling Paints & Coatings Market, By Region (Page No. - 78)
10.1 Introduction
10.2 Asia-Pacific
10.2.1 China
10.2.2 Japan
10.2.3 South Korea
10.2.4 India
10.2.5 Rest of Asia-Pacific
10.3 Europe
10.3.1 Germany
10.3.2 U.K.
10.3.3 Italy
10.3.4 France
10.3.5 Rest of Europe
10.4 North America
10.4.1 U.S.
10.4.2 Canada
10.4.3 Mexico
10.5 Middle East & Africa
10.5.1 Saudi Arabia
10.5.2 UAE
10.5.3 Rest of Middle East & Africa (MEA)
10.6 Latin America
10.6.1 Brazil
10.6.2 Argentina
10.6.3 Rest of Latin America
11 Competitive Landscape (Page No. - 138)
11.1 Overview
11.2 New Product Launch and Agreements: the Most Popular Growth Strategies
11.3 Maximum Developments in 2013
11.3.1 New Product Launch
11.3.2 Agreements
11.3.3 Expansion
11.3.4 Joint Venture/New Contract/Mergers & Accquisition
12 Company Profiles (Page No. - 145)
(Overview, Financial*, Products & Services, Strategy, and Developments)
12.1 Introduction
12.2 Akzo Nobel N.V.
12.3 BASF S.E.
12.4 Nippon Paint Marine Coatings Co. Ltd.
12.5 PPG Industries Inc.
12.6 The Sherwin-Williams Company
12.7 Jotun
12.8 Hempel A/S
12.9 Chugoku Marine Paints Ltd.
12.10 Boero Yachtcoatings
12.11 Kop-Coat Marine Group (Pettit Marine Paint)
12.12 Other Key Players
*Details Might Not Be Captured in Case of Unlisted Companies.
13 Appendix (Page No. - 177)
13.1 Discussion Guide
13.2 Knowledge Store: Marketsandmarkets’ Subscription Portal
13.3 Introducing RT: Real-Time Market Intelligence
13.4 Available Customizations
13.5 Related Reports
List of Tables (154 Tables)
Table 1 The Copper-Based Antifouling Paints and Coatings Market is Projected to Grow at the Highest CAGR During the Forecast Period
Table 2 Drivers: Impact of Antifouling Paints & Coatings Market(2016–2021)
Table 3 Restraints: Impact of Market (2016-2021)
Table 4 Opportunities: Impact of Market (2016-2021)
Table 5 Challenges: Impact of Market (2016-2021)
Table 6 Brazil: Economic Outlook
Table 7 Canada: Economic Outlook
Table 8 China: Economic Outlook
Table 9 France: Economic Outlook
Table 10 Germany: Economic Outlook
Table 11 India: Economic Outlook
Table 12 Italy: Economic Outlook
Table 13 Japan: Economic Outlook
Table 14 Mexico: Economic Outlook
Table 15 Saudi Arabia: Economic Outlook
Table 16 South Korea: Economic Outlook
Table 17 U.K.: Economic Outlook
Table 18 U.S.: Economic Outlook
Table 19 Market, By Type, 2014–2021 (Million Liters)
Table 20 Market, By Type, 2014–2021 (USD Million)
Table 21 Copper-Based Antifouling Paints and Coatings Market, By Region, 2014–2021 (Million Liters)
Table 22 Copper-Based Antifouling Paints & Coatings Market, By Region, 2014–2021 (USD Million)
Table 23 Self-Polishing Copolymer Antifouling Paints and Coatings Market, By Region, 2014–2021 (Million Liters)
Table 24 Self-Polishing Antifouling Paints & Coatings Market, By Region, 2014–2021 (USD Million)
Table 25 Hybrid Antifouling Paints and Coatings Market, By Region, 2014–2021 (Million Liters)
Table 26 Hybrid Antifouling Paints & Coatings Market, By Region, 2014–2021 (USD Million)
Table 27 Others Antifouling Paints and Coatings Market, By Region, 2014–2021 (Million Liters)
Table 28 Others Antifouling Paints & Coatings Market, By Region, 2014–2021 (USD Million)
Table 29 Market, By Application, 2014–2021 (Million Liters)
Table 30 Market, By Application, 2014–2021 (USD Million)
Table 31 Market in Shipping Vessels, By Region, 2014–2021 (Million Liters)
Table 32 Market in Shipping Vessels, By Region, 2014–2021 (USD Million)
Table 33 Market in Drilling Rigs & Production Platforms, By Region, 2014–2021 (Million Liters)
Table 34 Market in Drilling Rigs & Production Platforms, By Region, 2014–2021 (USD Million)
Table 35 Market in Fishing Boats, By Region, 2014–2021 (Million Liters)
Table 36 Market in Fishing Boats, By Region, 2014–2021 (USD Million)
Table 37 Market in Yachts & Other Boats, By Region, 2014–2021 (Million Liters)
Table 38 Market in Yachts & Other Boats, By Region, 2014–2021 (USD Million)
Table 39 Market in Mooring Lines, By Region, 2014–2021 (Million Liters)
Table 40 Market in Mooring Lines, By Region, 2014–2021 (USD Million)
Table 41 Market in Inland Waterways Transport, By Region, 2014–2021 (Million Liters)
Table 42 Market in Inland Waterways Transport, By Region, 2014–2021 (USD Million)
Table 43 Market, By Region, 2014–2021 (Million Liters)
Table 44 Market, By Region, 2014–2021 (USD Million)
Table 45 Asia-Pacific Antifouling Paints & Coatings Market, By Type, 2014–2021 (Million Liters)
Table 46 Asia-Pacific Antifouling Paints and Coatings Market, By Type, 2014–2021 (USD Million)
Table 47 Asia-Pacific Market, By Country, 2014–2021 (Million Liters)
Table 48 Asia-Pacific Market, By Country, 2014–2021 (USD Million)
Table 49 Asia-Pacific Market, By Application, 2014–2021 (Million Liters)
Table 50 Asia-Pacific Market, By Application, 2014–2021 (USD Million)
Table 51 China Antifouling Paints & Coatings Market, By Type, 2014–2021 (Million Liters)
Table 52 China Antifouling Paints and Coatings Market, By Type, 2014–2021 (USD Million)
Table 53 China Market, By Application, 2014–2021 (Million Liters)
Table 54 China Market, By Application, 2014–2021 (USD Million)
Table 55 Japan Antifouling Paints & Coatings Market, By Type, 2014–2021 (Million Liters)
Table 56 Japan Antifouling Paints and Coatings Market, By Type, 2014–2021 (USD Million)
Table 57 Japan Market, By Application, 2014–2021 (Million Liters)
Table 58 Japan Market, By Application, 2014–2021 (USD Million)
Table 59 South Korea Antifouling Paints & Coatings Market, By Type, 2014–2021 (Million Liters)
Table 60 South Korea Antifouling Paints and Coatings Market, By Type, 2014–2021 (USD Million)
Table 61 South Korea Market, By Application, 2014–2021 (Million Liters)
Table 62 South Korea Market, By Application, 2014–2021 (USD Million)
Table 63 India Antifouling Paints & Coatings Market, By Type, 2014–2021 (Million Liters)
Table 64 India Antifouling Paints and Coatings Market, By Type, 2014–2021 (USD Million)
Table 65 India Market, By Application, 2014–2021 (Million Liters)
Table 66 India Market, By Application, 2014–2021 (USD Million)
Table 67 Rest of Asia-Pacific Antifouling Paints & Coatings Market, By Type, 2014–2021 (Million Liters)
Table 68 Rest of Asia-Pacific Antifouling Paints and Coatings Market, By Type, 2014–2021 (USD Million)
Table 69 Rest of Asia-Pacific Market, By Application, 2014–2021 (Million Liters)
Table 70 Rest of Asia-Pacific Market, By Application, 2014–2021 (USD Million)
Table 71 Europe Antifouling Paints & Coatings Market, By Type, 2014–2021 (Million Liters)
Table 72 Europe Antifouling Paints and Coatings Market, By Type, 2014–2021 (USD Million)
Table 73 Europe Market, By Country, 2014–2021 (Million Liters)
Table 74 Europe Market, By Country, 2014–2021 (USD Million)
Table 75 Europe Market, By Application, 2014–2021 (Million Liters)
Table 76 Europe Market, By Application, 2014–2021 (USD Million)
Table 77 Germany Antifouling Paints & Coatings Market, By Type, 2014–2021 (Million Liters)
Table 78 Germany Antifouling Paints and Coatings Market, By Type, 2014–2021 (USD Million)
Table 79 Germany Market, By Application, 2014–2021 (Million Liters)
Table 80 Germany Market, By Application, 2014–2021 (USD Million)
Table 81 U.K. Antifouling Paints & Coatings Market, By Type, 2014–2021 (Million Liters)
Table 82 U.K. Antifouling Paints and Coatings Market, By Type, 2014–2021 (USD Million)
Table 83 U.K. Market, By Application, 2014–2021 (Million Liters)
Table 84 U.K. Market, By Application, 2014–2021 (USD Million)
Table 85 Italy Antifouling Paints & Coatings Market, By Type, 2014–2021 (Million Liters)
Table 86 Italy Antifouling Paints and Coatings Market, By Type, 2014–2021 (USD Million)
Table 87 Italy Market, By Application, 2014–2021 (Million Liters)
Table 88 Italy Market, By Application, 2014–2021 (USD Million)
Table 89 France Antifouling Paints & Coatings Market, By Type, 2014–2021 (Million Liters)
Table 90 France Antifouling Paints and Coatings Market, By Type, 2014–2021 (USD Million)
Table 91 France Market, By Application, 2014–2021 (Million Liters)
Table 92 France Market, By Application, 2014–2021 (USD Million)
Table 93 Rest of Europe Antifouling Paints & Coatings Market, By Type, 2014–2021 (Million Liters)
Table 94 Rest of Europe Antifouling Paints and Coatings Market, By Type, 2014–2021 (USD Million)
Table 95 Rest of Europe Market, By Application, 2014–2021 (Million Liters)
Table 96 Rest of Europe Market, By Application, 2014–2021 (USD Million)
Table 97 North America Antifouling Paints & Coatings Market, By Type, 2014–2021 (Million Liters)
Table 98 North America Antifouling Paints and Coatings Market, By Type, 2014–2021 (USD Million)
Table 99 North America Market, By Country, 2014–2021 (Million Liters)
Table 100 North America Market, By Country, 2014–2021 (USD Million)
Table 101 North America Market, By Application, 2014–2021 (Million Liters)
Table 102 North America Market, By Application, 2014–2021 (USD Million)
Table 103 U.S. Antifouling Paints & Coatings Market, By Type, 2014–2021 (Million Liters)
Table 104 U.S. Antifouling Paints and Coatings Market, By Type, 2014–2021 (USD Million)
Table 105 U.S. Market, By Application, 2014–2021 (Million Liters)
Table 106 U.S. Market, By Application, 2014–2021 (USD Million)
Table 107 Canada Antifouling Paints & Coatings Market, By Type, 2014–2021 (Million Liters)
Table 108 Canada Antifouling Paints and Coatings Market, By Type, 2014–2021 (USD Million)
Table 109 Canada Market, By Application, 2014–2021 (Million Liters)
Table 110 Canada Market, By Application, 2014–2021 (USD Million)
Table 111 Mexico Antifouling Paints & Coatings Market, By Type, 2014–2021 (Million Liters)
Table 112 Mexico Antifouling Paints and Coatings Market, By Type, 2014–2021 (USD Million)
Table 113 Mexico Market, By Application, 2014–2021 (Million Liters)
Table 114 Mexico Market, By Application, 2014–2021 (USD Million)
Table 115 Middle East & Africa Antifouling Paints & Coatings Market, By Type, 2014–2021 (Million Liters)
Table 116 Middle East & Africa Antifouling Paints and Coatings Market, By Type, 2014–2021 (USD Million)
Table 117 Middle East & Africa Market, By Country, 2014–2021 (Million Liters)
Table 118 Middle East & Africa Market, By Country, 2014–2021 (USD Million)
Table 119 Middle East & Africa Market, By Application, 2014–2021 (Million Liters)
Table 120 Middle East & Africa Market, By Application, 2014–2021 (USD Million)
Table 121 Saudi Arabia Antifouling Paints & Coatings Market, By Type, 2014–2021 (Million Liters)
Table 122 Saudi Arabia Antifouling Paints and Coatings Market, By Type, 2014–2021 (USD Million)
Table 123 Saudi Arabia Market, By Application, 2014–2021 (Million Liters)
Table 124 Saudi Arabia Market, By Application, 2014–2021 (USD Million)
Table 125 UAE Antifouling Paints & Coatings Market, By Type, 2014–2021 (Million Liters)
Table 126 UAE Antifouling Paints and Coatings Market, By Type, 2014–2021 (USD Million)
Table 127 UAE Market, By Application, 2014–2021 (Million Liters)
Table 128 UAE Market, By Application, 2014–2021 (USD Million)
Table 129 Rest of MEA Antifouling Paints & Coatings Market, By Type, 2014–2021 (Million Liters)
Table 130 Rest of MEA Antifouling Paints and Coatings Market, By Type, 2014–2021 (USD Million)
Table 131 Rest of MEA Market, By Application, 2014–2021 (Million Liters)
Table 132 Rest of MEA Market, By Application, 2014–2021 (USD Million)
Table 133 Latin America Antifouling Paints & Coatings Market, By Type, 2014–2021 (Million Liters)
Table 134 Latin America Antifouling Paints and Coatings Market, By Type, 2014–2021 (USD Million)
Table 135 Latin America Market, By Country, 2014–2021 (Million Liters)
Table 136 Latin America Market, By Country, 2014–2021 (USD Million)
Table 137 Latin America Market, By Application, 2014–2021 (Million Liters)
Table 138 Latin America Market, By Application, 2013–2021 (USD Million)
Table 139 Brazil Antifouling Paints & Coatings Market, By Type, 2014–2021 (Million Liters)
Table 140 Brazil Antifouling Paints and Coatings Market, By Type, 2014–2021 (USD Million)
Table 141 Brazil Market, By Application, 2014–2021 (Million Liters)
Table 142 Brazil Market, By Application, 2014–2021 (USD Million)
Table 143 Argentina Antifouling Paints & Coatings Market, By Type, 2014–2021 (Million Liters)
Table 144 Argentina Antifouling Paints and Coatings Market, By Type, 2014–2021 (USD Million)
Table 145 Argentina Market, By Application, 2014–2021 (Million Liters)
Table 146 Argentina Market, By Application, 2014–2021 (USD Million)
Table 147 Rest of Latin America Antifouling Paints & Coatings Market, By Type, 2014–2021 (Million Liters)
Table 148 Rest of Latin America Antifouling Paints and Coatings Market, By Type, 2014–2021 (USD Million)
Table 149 Rest of Latin America Market, By Application, 2014–2021 (Million Liters)
Table 150 Rest of Latin America Market, By Application, 2014–2021 (USD Million)
Table 151 New Product Launch, 2010–2016
Table 152 Agreements, 2010—2015
Table 153 Expansion, 2013-2014
Table 154 Joint Venture/New Contract/Mergers & Accquisition, 2012—2014
List of Figures (48 Figures)
Figure 1 Antifouling Paints & Coatings: Market Segmentation
Figure 2 Antifouling Paints and Coatings Market: Research Design
Figure 3 Bottom-Up Approach
Figure 4 Top-Down Approach
Figure 5 Research Methodology: Data Triangulation
Figure 6 The Shipping Vessels Application Segment of the Global Antifouling Paints & Coatings Market is Expected to Grow at the Highest CAGR During the Forecast Period (Million Liters)
Figure 7 The Copper-Based Segment of the Global Antifouling Paints and Coatings Market is Expected to Grow at the Highest CAGR During the Forecast Period(Million Liters)
Figure 8 The Asia-Pacific Region Accounted for the Largest Share in the Global Antifouling Paints & Coatings Market in Terms of Volume
Figure 9 The Antifouling Paints and Coatings Market is Projected to Grow at A Significant Pace During the Forecast Period
Figure 10 The Antifouling Paints & Coatings Market in Asia-Pacific Projected to Register the Highest Growth Between 2016 and 2021
Figure 11 China Dominates the Antifouling Paints and Coatings Market in the APAC Region
Figure 12 The Copper-Based Segment Expected to Witness High Growth Between 2016 & 2021
Figure 13 Shipping Vessels Expected to Witness High Growth Between 2016 & 2021
Figure 14 Antifouling Paints & Coatings Market in China Anticipated to Grow at A Significant Pace During the Forecast Period
Figure 15 Drivers, Restraints, Opportunities & Challenges in the Antifouling Paints and Coatings Market
Figure 16 Crude Oil Prices, 2010-2015
Figure 17 Revenue Pocket Matrix: Antifouling Paints & Coatings Type, 2015
Figure 18 Revenue Pocket Matrix: End-Use Industry, 2015
Figure 19 Antifouling Paints & Coatings Market: Value Chain Analysis
Figure 20 Marine Industry Outlook: By Region, 2014
Figure 21 Antifouling Paints and Coatings Market, By Type, 2016& 2021 (USD Million)
Figure 22 The Shipping Vessels Segment of the Global Antifouling Paints & Coatings Market is Projected to Grow at the Highest CAGR
Figure 23 China Antifouling Paints and Coatings Market to Emerge as A New Hotspot During the Forecast Period
Figure 24 Antifouling Paints & Coatings Market in Asia-Pacific is Expected to Witness the Highest Growth During the Forecast Period
Figure 25 Asia-Pacific Antifouling Paints and Coatings Market Snapshot
Figure 26 Europe Antifouling Paints & Coatings Market Snapshot
Figure 27 North America Antifouling Paints and Coatings Market Snapshot
Figure 28 Middle East & Africa Antifouling Paints & Coatings Market Snapshot
Figure 29 Latin America Antifouling Paints and Coatings Market Snapshot
Figure 30 Companies Adopted New Product Launch as the Key Growth Strategy, 2011–2015
Figure 31 Major Growth Strategies in the Antifouling Paints & Coatings Market, 2011–2015
Figure 32 Developments in the Global Antifouling Paints and Coatings Market, 2012–2015
Figure 33 Regional Revenue Mix of Market Players
Figure 34 Akzo Nobel N.V.: Company Snapshot
Figure 35 Akzo Nobel N.V.: SWOT Analysis
Figure 36 BASF S.E.: Company Snapshot
Figure 37 BASF: SWOT Analysis
Figure 38 Nippon Paint Holdings Co. Ltd.: Company Snapshot
Figure 39 Nippon Paint Marine Coatings Co. Ltd.: SWOT Analysis
Figure 40 PPG Industries Inc.: Company Snapshot
Figure 41 PPG Industries Inc.: SWOT Analysis
Figure 42 The Sherwin-Williams Company : Company Snapshot
Figure 43 The Sherwin-Williams Company: SWOT Analysis
Figure 44 Jotun.: Company Snapshot
Figure 45 Jotun: SWOT Analysis
Figure 46 Hempel A/S: Company Snapshot
Figure 47 Hempel A/S: SWOT Analysis
Figure 48 Chugoku Marine Paints Ltd.: Company Snapshot


Growth opportunities and latent adjacency in Antifouling Paints and Coatings Market