Oilfield Services Market by Application (Onshore and Offshore), Service (Well Completion Equipment & Services, Well Intervention Services, Coiled Tubing Services, Pressure Pumping Services, OCTG, and Wireline Services), and Region - Global Forecast to 2022


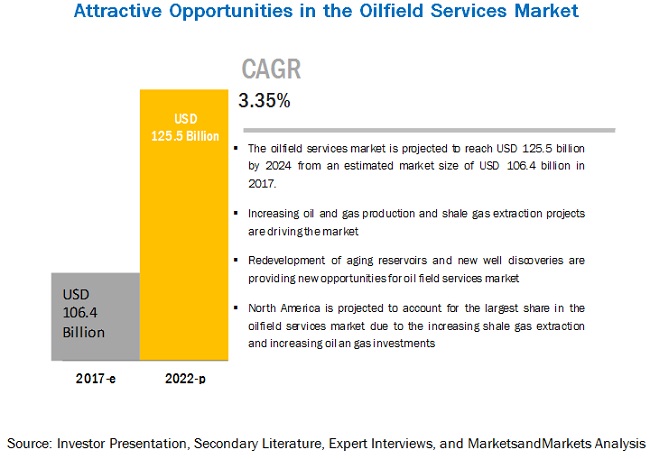
[270 Pages Report] MarketsandMarkets forecasts the global oilfield services market to grow from USD 106.4 billion in 2017 to USD 125.5 billion by 2023, at a Compound Annual Growth Rate (CAGR) of 3.35% during the forecast period. The major factors driving the oilfield services market include the global increase in oil and gas production and growing shale gas extraction. The objective of the report is to define, describe, and forecast the global oilfield services market by application, service, type and region
By application, Onshore segment is expected to dominate the Oilfield Services market during the forecast period
The report segments the Oilfield Services market, by application, into onshore and offshore applications. The onshore application is expected to hold the largest market share by 2022. Onshore application is highly implemented in regions such as North America and Middle East & Africa where maximum number of onshore wells are located for oilfield services. Factors such as improved investment in oil and gas and new well discoveries are expected to drive the market.
By service type, the well completion equipment and services segment is expected to grow at the highest CAGR during the forecast period
The well completion equipment and services segment is expected to grow at the highest rate during the forecast period. The market growth in this segment can be attributed to the need for preparation of well for petroleum production. North America region is the major contributor to the growth of the segment with the presence of natural resources and the availability of technology for production of unconventional hydrocarbons in the region. In addition, presence of major players in the region makes the implementation of technology at production site economical.
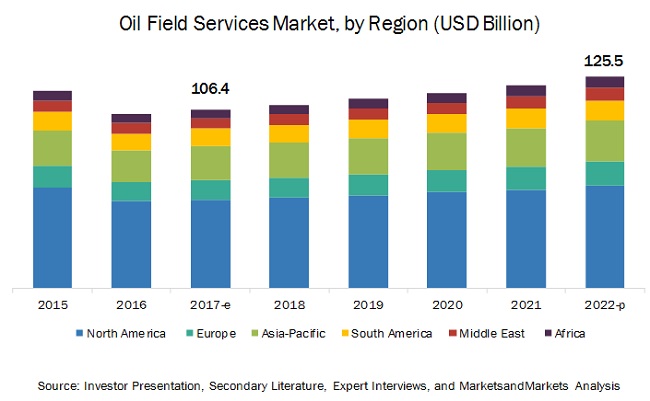
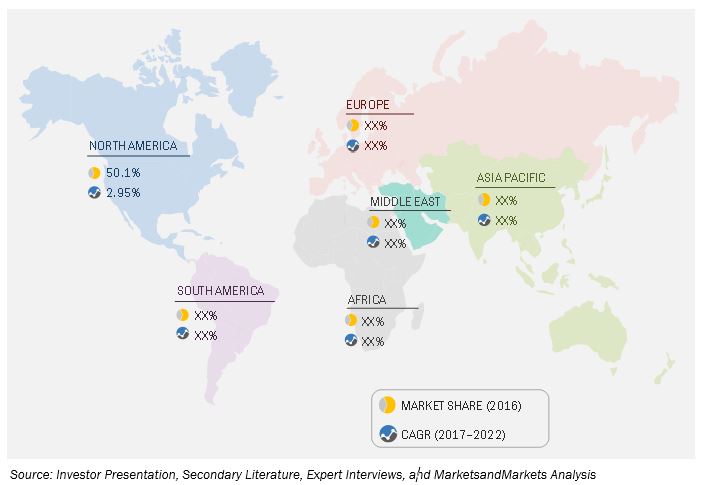
North America to account for the largest market size during the forecast period.
The market in North America is estimated to be the largest for Oilfield Services market from 2017 to 2022. Increasing production levels of oil and gas in the region is expected to drive the growth of the oilfield services market. Moreover, US is one of the largest producer and consumer of oil and gas in the global market. In addition, -reach horizontal well bores and completion techniques such as multi-stage hydraulic fracturing technologies would drive the oilfield services market in the region.
Market Dynamics
Driver: Shale Gas Extraction
Shale gases are natural gases which are trapped in shale formations. These gases which are trapped in shale formation cannot readily flow into the well, owing to the low permeability of these shale formations. Hydraulic fracturing and other stimulation procedures are adopted by oil & gas companies to increase the permeability of these shale formations, to produce these trapped shale gases.
Shale gas has been known to exist in large quantities throughout the world, shale gas was first produced in 1981, but it was only in 1998 that shale gas was produced through hydraulic fracturing and horizontal/ directional drilling. In the U.S., shale gas production accounted for only 1.6% of the overall natural gas production in 2000, which increased to 37.2% in 2013, and further increased to 54% in 2015.
China began its shale gas venture in 1996 when it completed its exploratory well, Wei 5, which produced 24,000 m3/day. However, lack of technological advancement such as directional drilling and hydraulic fracturing technology had hampered shale development in the country. Hence, many Chinese oil & gas companies such as CNOOC Ltd. (China) ventured into Canada to gain experience in production from unconventional oil & gas formations. China is one of the major holders of shale reserves, and most of its shale gas production comes from the Sichuan Basin located in the Chongqing area, the country has planned to increase production up to 30 bcm/per year by 2020, and 80-100 bcm/per year by 2030, owing to new technological developments in drilling and shale gas exploration techniques. Thus the continued development of shale basins in North America and in other major countries such as China, Argentina, and Canada offers opportunities for oilfield service providers, and drives the oilfield services market.
Restraint: Fluctuating crude oil process
The oil & gas industry is continuously witnessing fluctuation in crude oil prices, and this is attributed to the changes in demand for crude, as well as OPEC and non-OPEC supply, competition between the U.S. and the OPEC countries, and because of shale gas revolution. The pullout comes as crude oil prices have plummeted to less than half when compared with their June 2014 levels, and forcing oil companies to cut down on spending. Low crude prices are axiomatic and will continue at least for next one year, which will affect the demand of the various services in the oilfield services market.
Opportunity: New oilfield discoveries
New oilfields and reserves were discovered across the globe in almost every region in 2016. Few of the major discoveries included deepwater offshore field discovery in Senegal, Alpine high in West Texas, U.S., Shetland Islands, at north coast of Scotland at the U.K. continental shelf, northern Kerio Valley in Kenya, Alaska in U.S., and Golan Heights in Israel, among others. In November 2016, U.S. Geological Survey (USGS) estimated that 1.6 billion barrels of natural gas, and 20 billion barrels of oil was contained within layers of shale in the Permian Basin which lies underneath West Texas and Southeastern New Mexico. The discovery is three times larger than the Bakken oilfields of North Dakota.
Due to low oil prices, oil field operators have cut back on exploration cost which has led to lower number of new oil reserves and field discoveries in 2016 since 1947. However, According to World Bank’s April Commodity Markets Outlook, by 2018, it is expected that oil prices will bounce back to USD 60 per barrel. This will encourage oil field operators and independent exploration companies to start investing in exploration activities to improve their reserve replacement ratio.
Challenge: Strict government regulations on E&P activities
Countries have adopted new regulations which have increased the regulatory burden on the oil & gas industry. Few of these areas include reporting for greenhouse gas emissions, oil & gas operations performance standards, and guidelines for maintenance of certain stationary gas and diesel engines. The Macondo oil spill in 2010, in the Gulf of Mexico, 11 workers were killed and an oil leakage was 4.9 million barrels was estimated. It is estimated that 25,000 maritime mammals life was affected, and it would take approximately 10 years for the recovery of oil form this region. After this disaster the U.S. government has re-evaluated its drilling procedures with a view of preventing future oil spill incidents.
European Union have also revised their offshore regulatory regime. For instance, on May 2013, the European Union (EU) Parliament approved a new law on the safety of oil & gas operations. According to the law, before commencing any drilling operations in EU waters, oil & gas companies have to submit a special report on major possible hazards that operations can have on the environment. In addition, they need to provide internal emergency response plans with full details of equipment and resources available, along with the actions it would take in the consequence of an accident. The new directive also recommends all EU member states to prepare external emergency response plans that cover all offshore drilling installations within their territory. Regulations related to the protection of surface water and ground water during seismic testing, and hydraulic fracturing is hindering the growth of the oilfield services market.
The state of New York, U.S. has banned hydraulic fracturing due to health issues and concerns for air and water contamination. Maryland, another state in the U.S., has also banned hydraulic fracturing. In Ohio, 77 minor earthquakes were reported in 1 month, which were caused mainly due to hydraulic fracturing activities. Apart from the U.S., France, Bulgaria, Romania, Ireland, Czech Republic, Germany, and Scotland among others have also banned hydraulic fracturing. The Netherlands has also banned fracking till 2022. These regulatory issues would affect the oil & gas service industry in the long term. Such regulatory policies have made it difficult for the intervention activities for existing wells, and thus have set back oilfield services market.
The research report categorizes the Oilfield Services market to forecast the revenues and analyze the trends in each of the following sub-segments:
Oilfield Services Market, By Application
-
Onshore
- Well Intervention Services
- Well Completion Services
-
Offshore
- Well Intervention Services
- Well Completion Services
Oilfield Services Market, By Service
- Pressure Pumping Services
- Oil Country Tubular Goods
- Wireline Services
- Well Completion Equipment & Services
- Well Intervention Services
- Drilling & Completion Fluid Services
- Drilling Waste Management Services
- Coiled Tubing Services
Oilfield Services Market, By Type
- Equipment rental
- Field operation
- Analytical services
Oilfield Services Market, By Region
- Asia Pacific
- North America
- Europe
- Middle East
- Africa
- South America
Key Market Players
Baker Hughes Incorporated (US), Halliburton Company (US), Schlumberger Limited (US), Weatherford International, PLC (Switzerland), National Oilwell Varco, Inc. (US), China Oilfield Services Limited (COSL)(China), Superior Energy Services, Inc. (US), Technipfmc.PLC (U.K), Trican Well Service, Ltd. (US), Welltec International APS (Denmark), Nabors Industries, Ltd. (Bermuda), Nordic Well Services, LLC (UAE).
Baker Hughes is a leading global supplier of systems, products, technology, and oilfield services for the oil and natural gas industry. The company also provides industrial products and services for the process and pipeline service and downstream chemical industries. The company operates through three segments, namely, completion and production, drilling and evaluation, and industrial services. The company provides its wireline services, drilling services, drilling and completion fluids, and drill bits through its drilling and evaluation business segment and caters to both open-hole and cased-hole applications. The products offered by the company’s completion and production segment include intelligent production systems, upstream chemicals, wellbore intervention, artificial lift, pressure pumping, and completion systems. In March 2017, the company launched a new adaptive drill bit called the TerrAdapt. This drill bit uses automation to reduce down-hole dysfunctions and improve drilling operations. The bit consists of a self-adjusting depth-of-cut control element and, thus, automatically changes combativeness based on the formation being drilled.
Critical questions the report answers:
- Where will all these developments take the industry in the long term?
- What are the upcoming trends for the Oilfield Services market?
- Which segment provides the most opportunity for growth?
- Who are the leading manufacturers operating in this market?
- What are the opportunities for new market entrants?
To speak to our analyst for a discussion on the above findings, click Speak to Analyst
 Exclusive indicates content/data unique to MarketsandMarkets and not available with any competitors.
Table of Contents
1 Introduction (Page No. - 21)
1.1 Objectives of the Study
1.2 Market Definition
1.3 Market Scope
1.3.1 Markets Covered
1.3.2 Countries Covered
1.3.3 Years Considered for the Study
1.4 Currency
1.5 Limitations
1.6 Stakeholders
2 Research Methodology (Page No. - 25)
2.1 Research Data
2.1.1 Secondary Data
2.1.1.1 Key Data From Secondary Sources
2.1.1.1 Key Data From Primary Sources
2.1.1.2 Key Industry Insights
2.1.1.3 Breakdown of Primaries
2.2 Market Size Estimation
2.2.1 Bottom-Up Approach
2.2.2 Top-Down Approach
2.3 Market Breakdown & Data Triangulation
2.4 Research Assumptions
3 Executive Summary (Page No. - 33)
4 Premium Insights (Page No. - 37)
4.1 Oilfield Services Market Overview
4.2 Oilfield Services Market, By Application
4.3 Oilfield Services Market, By Service Type & Region
4.4 Oilfield Services Market, By Service Type (2017)
5 Market Overview (Page No. - 39)
5.1 Introduction
5.2 Market Dynamics
5.2.1 Drivers
5.2.1.1 Shale Gas Extraction
5.2.1.2 Lifting of Iranian Oil Export Sanctions
5.2.1.3 Increase in Oil & Gas Production
5.2.2 Restraints
5.2.2.1 Decline in Drilling Activities and Rig Count
5.2.2.2 Fluctuating Crude Oil Prices
5.2.2.3 Increasing Focus on Renewable Energy
5.2.3 Opportunities
5.2.3.1 New Oilfield Discoveries
5.2.3.2 Redevelopment of Aging Reservoirs
5.2.4 Challenges
5.2.4.1 Strict Government Regulations on E&P Activities
5.3 Supply Chain Overview
5.3.1 Key Influencers
6 Oilfield Services Market, By Application (Page No. - 50)
6.1 Introduction
6.2 Market Analysis
6.2.1 The Offshore Application Segment is Expected to Grow at the Highest Rate During the Forecast Period
6.2.2 Onshore
6.2.2.1 Onshore Oilfield Services Market Size, By Region, 2015–2022 (USD Million)
6.2.2.2 Introduction
6.2.2.3 Well Intervention Services
6.2.2.3.1 Well Intervention Services Market Size, By Application, 2015–2022 (USD Million)
6.2.2.4 Well Completion Services
6.2.2.4.1 Well Completion Services Market Size, By Application, 2015–2022 (USD Million)
6.2.3 Offshore
6.2.3.1 The Offshore Well Intervention Segment is Expected to Grow at the Highest Rate During the Forecast Period
6.2.3.2 Introduction
6.2.3.3 Well Intervention Services
6.2.3.3.1 Offshore Well Intervention Market Size, By Region, 2015–2022 (USD Million)
6.2.3.4 Well Completion Services
6.2.3.4.1 Offshore Well Completion Market Size, By Region, 2015–2022 (USD Million)
7 Oilfield Services Market, By Type (Page No. - 59)
7.1 Introduction
7.2 Market Analysis
7.2.1 The Equipment Rental Segment is Expected to Grow at the Highest Rate During the Forecast Period
7.2.2 Equipment Rental
7.2.2.1 Equipment Rental Market Size, By Region, 2015–2022 (USD Million)
7.2.2.2 Introduction
7.2.3 Field Operation
7.2.3.1 Field Operation Market Size, By Application, 2015–2022 (USD Million)
7.2.4 Analytical Services
7.2.4.1 Analytical Services Market Size, By Application, 2015–2022 (USD Million)
8 Oilfield Services Market, By Service (Page No. - 65)
8.1 Introduction
8.2 Pressure Pumping Services
8.2.1 Pressure Pumping Services Market Share (Value), By Region (2017–2022)
8.2.2 North America
8.2.2.1 North America: Pressure Pumping Services Market Size, By Country, 2015–2022 (USD Million)
8.2.3 Asia-Pacific
8.2.3.1 Asia-Pacific: Pressure Pumping Services Market Size, By Country, 2015–2022 (USD Million)
8.2.4 Europe
8.2.4.1 Europe: Pressure Pumping Services Market Size, By Country, 2015–2022 (USD Million)
8.2.5 South America
8.2.5.1 South America: Pressure Pumping Services Market Size, By Country, 2015–2022 (USD Million)
8.2.6 The Middle East
8.2.6.1 The Middle East: Pressure Pumping Services Market Size, By Country, 2015–2022 (USD Million)
8.2.7 Africa
8.2.7.1 Africa: Pressure Pumping Services Market Size, By Country, 2015–2022 (USD Million)
8.3 Oil Country Tubular Goods
8.3.1 Oil Country Tubular Goods Market Share (Value), By Region (2017–2022)
8.3.2 North America
8.3.2.1 North America: Oil Country Tubular Goods Market Size, By Country, 2015–2022 (USD Million)
8.3.3 Asia-Pacific
8.3.3.1 Asia-Pacific: Oil Country Tubular Goods Market Size, By Country, 2015–2022 (USD Million)
8.3.4 Europe
8.3.4.1 Europe: Oil Country Tubular Goods Market Size, By Country, 2015–2022 (USD Million)
8.3.5 South America
8.3.5.1 South America: Oil Country Tubular Goods Market Size, By Country, 2015–2022 (USD Million)
8.3.6 The Middle East
8.3.6.1 The Middle East: Oil Country Tubular Goods Market Size, By Country, 2015–2022 (USD Million)
8.3.7 Africa
8.3.7.1 Africa: Oil Country Tubular Goods Market Size, By Country, 2015–2022 (USD Million)
8.4 Wireline Services
8.4.1 Wireline Services Market Share (Value), By Region (2017–2022)
8.4.2 North America
8.4.2.1 North America: Wireline Services Market Size, By Country, 2015–2022 (USD Million)
8.4.3 Asia-Pacific
8.4.3.1 Asia-Pacific: Wireline Services Market Size, By Country, 2015–2022 (USD Million)
8.4.4 Europe
8.4.4.1 Europe: Wireline Services Market Size, By Country, 2015–2022 (USD Million)
8.4.5 South America
8.4.5.1 South America: Wireline Services Market Size, By Country, 2015–2022 (USD Million)
8.4.6 The Middle East
8.4.6.1 The Middle East: Wireline Services Market Size, By Country, 2015–2022 (USD Million)
8.4.7 Africa
8.4.7.1 Africa: Wireline Services Market Size, By Country, 2015–2022 (USD Million)
8.5 Well Completion Equipment & Services
8.5.1 Well Completion Equipment & Services Market Share (Value), By Region (2017–2022)
8.5.2 North America
8.5.2.1 North America: Well Completion Equipment & Services Market Size, By Country, 2015–2022 (USD Million)
8.5.3 Asia-Pacific
8.5.3.1 Asia-Pacific: Well Completion Equipment & Services Market Size, By Country, 2015–2022 (USD Million)
8.5.4 Europe
8.5.4.1 Europe: Well Completion Equipment & Services Market Size, By Country, 2015–2022 (USD Million)
8.5.5 South America
8.5.5.1 South America: Well Completion Equipment & Services Market Size, By Country, 2015–2022 (USD Million)
8.5.6 The Middle East
8.5.6.1 The Middle East: Well Completion Equipment & Services Market Size, By Country, 2015–2022 (USD Million)
8.5.7 Africa
8.5.7.1 Africa: Well Completion Equipment & Services Market Size, By Country, 2015–2022 (USD Million)
8.6 Well Intervention Services
8.6.1 Well Intervention Services Market Share (Value), By Region (2017–2022)
8.6.2 North America
8.6.2.1 North America: Onshore Well Intervention Services Market Size, By Country, 2015–2022 (USD Million)
8.6.2.2 North America: Offshore Well Intervention Services Market Size, By Country, 2015–2022 (USD Million)
8.6.3 Asia-Pacific
8.6.3.1 Asia-Pacific: Onshore Well Intervention Services Market Size, By Country, 2015–2022 (USD Million)
8.6.3.2 Asia-Pacific: Offshore Well Intervention Services Market Size, By Country, 2015–2022 (USD Million)
8.6.4 Europe
8.6.4.1 Europe: Onshore Well Intervention Services Market Size, By Country, 2015–2022 (USD Million)
8.6.4.2 Europe: Offshore Well Intervention Services Market Size, By Country, 2015–2022 (USD Million)
8.6.5 South America
8.6.5.1 South America: Onshore Well Intervention Services Market Size, By Country, 2015–2022 (USD Million)
8.6.5.2 South America: Offshore Well Intervention Services Market Size, By Country, 2015–2022 (USD Million)
8.6.6 The Middle East
8.6.6.1 The Middle East: Onshore Well Intervention Services Market Size, By Country, 2015–2022 (USD Million)
8.6.6.2 The Middle East: Offshore Well Intervention Services Market Size, By Country, 2015–2022 (USD Million)
8.6.7 Africa
8.6.7.1 Africa: Onshore Well Intervention Services Market Size, By Country, 2015–2022 (USD Million)
8.6.7.2 Africa: Offshore Well Intervention Services Market Size, By Country, 2015–2022 (USD Million)
8.7 Drilling & Completion Fluid Services
8.7.1 Drilling & Completion Fluid Services Market Size, By Region, 2015–2022 (USD Million)
8.7.2 North America
8.7.2.1 North America: Drilling & Completion Fluid Services Market Size, By Country, 2015–2022 (USD Million)
8.7.3 Asia-Pacific
8.7.3.1 Asia-Pacific: Drilling & Completion Fluid Services Market Size, By Country, 2015–2022 (USD Million)
8.7.4 Europe
8.7.4.1 Europe: Drilling & Completion Fluid Services Market Size, By Country, 2015–2022 (USD Million)
8.7.5 South America
8.7.5.1 South America: Drilling & Completion Fluid Services Market Size, By Country, 2015–2022 (USD Million)
8.7.6 The Middle East
8.7.6.1 The Middle East: Drilling & Completion Fluid Services Market Size, By Country, 2015–2022 (USD Million)
8.7.7 Africa
8.7.7.1 Africa: Drilling & Completion Fluid Services Market Size, By Country, 2015–2022 (USD Million)
8.8 Drilling Waste Management Services
8.8.1 Drilling Waste Management Services Market Size, By Region, 2015–2022 (USD Million)
8.8.2 North America
8.8.2.1 North America: Drilling Waste Management Services Market Size, By Country, 2015–2022 (USD Million)
8.8.3 Asia-Pacific
8.8.3.1 Asia-Pacific: Drilling Waste Management Services Market Size, By Country, 2015–2022 (USD Million)
8.8.4 Europe
8.8.4.1 Europe: Drilling Waste Management Services Market Size, By Country, 2015–2022 (USD Million)
8.8.5 South America
8.8.5.1 South America: Drilling Waste Management Services Market Size, By Country, 2015–2022 (USD Million)
8.8.6 The Middle East
8.8.6.1 The Middle East: Drilling Waste Management Services Market Size, By Country, 2015–2022 (USD Million)
8.8.7 Africa
8.8.7.1 Africa: Drilling Waste Management Services Market Size, By Country, 2015–2022 (USD Million)
8.9 Coiled Tubing Services
8.9.1 Coiled Tubing Services Market Share (Value), By Region (2017)
8.9.2 Coiled Tubing Services Market Size, By Region, 2015–2022 (USD Million)
8.9.3 North America
8.9.3.1 North America: Coiled Tubing Services Market Size, By Country, 2015–2022 (USD Million)
8.9.4 Asia-Pacific
8.9.4.1 Asia-Pacific: Coiled Tubing Services Market Size, By Country, 2015–2022 (USD Million)
8.9.5 Europe
8.9.5.1 Europe: Coiled Tubing Services Market Size, By Country, 2015–2022 (USD Million)
8.9.6 South America
8.9.6.1 South America: Coiled Tubing Services Market Size, By Country, 2015–2022 (USD Million)
8.9.7 The Middle East
8.9.7.1 The Middle East: Coiled Tubing Services Market Size, By Country, 2015–2022 (USD Million)
8.9.8 Africa
8.9.8.1 Africa: Coiled Tubing Services Market Size, 2015–2022 (USD Million)
9 Oilfield Services Market, By Region (Page No. - 117)
9.1 Introduction
9.2 North America
9.2.1 North America: Oilfield Services Market Size, By Country, 2015–2022 (USD Million)
9.3 Asia-Pacific
9.3.1 Asia-Pacific: Oilfield Services Market Size, By Country, 2015–2022 (USD Million)
9.4 Europe
9.4.1 Europe: Oilfield Services Market Size, By Country, 2015–2022 (USD Million)
9.5 South America
9.5.1 South America: Oilfield Services Market Size, By Country, 2015–2022 (USD Million)
9.6 The Middle East
9.6.1 The Middle East: Oilfield Services Market Size, By Country, 2015–2022 (USD Million)
9.7 Africa
9.7.1 Africa: Oilfield Services Market Size, By Country, 2015–2022 (USD Million)
10 Competitive Landscape (Page No. - 130)
10.1 Overview
10.2 Market Share Analysis, Oilfield Services Market, 2016
10.3 Competitive Situation & Trends
10.4 Vendor Dive Matrix
10.4.1 Vanguards (Market Leaders)
10.4.2 Innovators
10.4.3 Dynamic
10.4.4 Emerging
10.5 Analysis of the Product Portfolio of Major Players in the Oilfiled Services Market (26 Companies)
10.6 Business Strategy Adopted By Major Players in the Oilfield Services Market (26 Companies)
11 Company Profiles (Page No. - 141)
11.1 Baker Hughes Incorporated
11.1.1 Overview
11.1.2 Product Offerings
11.1.3 Baker Hughes Incorporated: Product Offerings Scorecard
11.1.4 Baker Hughes Incorporated: Business Strategy Scorecard
11.1.5 Recent Developments
11.2 Halliburton Company
11.2.1 Overview
11.2.2 Product Offerings
11.2.3 Halliburton Company: Product Offerings Scorecard
11.2.4 Halliburton Company: Business Strategy Scorecard
11.2.5 Recent Developments
11.3 Schlumberger Limited
11.3.1 Overview
11.3.2 Product Offerings
11.3.3 Schlumberger Limited: Product Offerings Scorecard
11.3.4 Schlumberger Limited: Business Strategy Scorecard
11.3.5 Recent Developments
11.4 Weatherford International, PLC
11.4.1 Overview
11.4.2 Product Offerings
11.4.3 Weatherford International, PLC: Product Offerings Scorecard
11.4.4 Weatherford International, PLC: Business Strategy Scorecard
11.4.5 Recent Developments
11.5 Superior Energy Services, Inc.
11.5.1 Overview
11.5.2 Product Offerings
11.5.3 Superior Energy Services, Inc.: Product Offerings Scorecard
11.5.4 Superior Energy Services, Inc.: Business Strategy Scorecard
11.5.5 Recent Developments
11.6 National Oilwell Varco, Inc.
11.6.1 Overview
11.6.2 Product Offerings
11.6.3 National Oilwell Varco, Inc.: Product Offerings Scorecard
11.6.4 National Oilwell Varco, Inc.: Business Strategy Scorecard
11.6.5 Recent Developments
11.7 China Oilfield Services Limited (COSL)
11.7.1 Overview
11.7.2 Product Offerings
11.7.3 China Oilfield Services Limited: Product Offerings Scorecard
11.7.4 China Oilfield Services Limited: Business Strategy Scorecard
11.7.5 Recent Developments
11.8 Archer Limited
11.8.1 Overview
11.8.2 Product Offerings
11.8.3 Archer Limited: Product Offerings Scorecard
11.8.4 Archer Limited: Business Strategy Scorecard
11.8.5 Recent Developments
11.9 Expro International Group Holdings, Ltd.
11.9.1 Overview
11.9.2 Product Offerings
11.9.3 Expro International Group Holdings, Ltd.: Product Offerings Scorecard
11.9.4 Expro International Group Holdings, Ltd.: Business Strategy Scorecard
11.9.5 Recent Developments
11.10 Technipfmc, PLC
11.10.1 Overview
11.10.2 Product Offerings
11.10.3 Technipfmc, PLC: Product Offerings Scorecard
11.10.4 Technipfmc, PLC: Business Strategy Scorecard
11.10.5 Recent Developments
11.11 GE Oil & Gas
11.11.1 Overview
11.11.2 Product Offerings
11.11.3 GE Oil & Gas: Product Offerings Scorecard
11.11.4 GE Oil & Gas: Business Strategy Scorecard
11.11.5 Recent Developments
11.12 Trican Well Service, Ltd.
11.12.1 Overview
11.12.2 Product Offerings
11.12.3 Trican Well Service, Ltd.: Product Offerings Scorecard
11.12.4 Trican Well Service, Ltd.: Business Strategy Scorecard
11.12.5 Recent Developments
11.13 Welltec International APS
11.13.1 Overview
11.13.2 Product Offerings
11.13.3 Welltec International APS: Product Offerings Scorecard
11.13.4 Welltec International APS: Business Strategy Scorecard
11.13.5 Recent Developments
11.14 Basic Energy Services, Inc.
11.14.1 Overview
11.14.2 Product Offerings
11.14.3 Basic Energy Services, Inc.: Product Offerings Scorecard
11.14.4 Basic Energy Services, Inc.: Business Strategy Scorecard
11.14.5 Recent Developments
11.15 Nabors Industries, Ltd.
11.15.1 Overview
11.15.2 Product Offerings
11.15.3 Nabors Industries, Ltd.: Product Offerings Scorecard
11.15.4 Nabors Industries, Ltd.: Business Strategy Scorecard
11.15.5 Recent Developments
11.16 Pioneer Energy Services Corp.
11.16.1 Overview
11.16.2 Product Offerings
11.16.3 Pioneer Energy Services Corp.: Product Offerings Scorecard
11.16.4 Pioneer Energy Services Corp.: Business Strategy Scorecard
11.17 Qinterra as
11.17.1 Overview
11.17.2 Product Offerings
11.17.3 Qinterra As: Product Offerings Scorecard
11.17.4 Qinterra As: Business Strategy Scorecard
11.17.5 Recent Developments
11.18 Scomi Energy Services BHD
11.18.1 Overview
11.18.2 Product Offerings
11.18.3 Scomi Energy Services BHD: Product Offerings Scorecard
11.18.4 Scomi Energy Services BHD: Business Strategy Scorecard
11.18.5 Recent Developments
11.19 Nordic Well Services, LLC
11.19.1 Overview
11.19.2 Product Offerings
11.19.3 Nordic Well Services, LLC: Product Offerings Scorecard
11.19.4 Nordic Well Services, LLC: Business Strategy Scorecard
11.20 Condor Energy Services Limited
11.20.1 Overview
11.20.2 Product Offerings
11.20.3 Condor Energy Services Limited: Product Offerings Scorecard
11.20.4 Condor Energy Services Limited: Business Strategy Scorecard
11.20.5 Recent Developments
11.21 The Engineering and Development Group
11.21.1 Overview
11.21.2 Product Offerings
11.21.3 The Engineering and Development Group: Product Offerings Scorecard
11.21.4 The Engineering and Development Group: Business Strategy Scorecard
11.21.5 Recent Developments
11.22 Gyrodata Incorporated
11.22.1 Overview
11.22.2 Product Offerings
11.22.3 Gyrodata Incorporated: Product Offerings Scorecard
11.22.4 Gyrodata Incorporated: Business Strategy Scorecard
11.22.5 Recent Developments
11.23 Oilserv
11.23.1 Overview
11.23.2 Product Offerings
11.23.3 Oilserv: Product Offerings Scorecard
11.23.4 Oilserv: Business Strategy Scorecard
11.24 Almansoori Petroleum Services
11.24.1 Overview
11.24.2 Product Offerings
11.24.3 Almansoori Petroleum Services: Product Offerings Scorecard
11.24.4 Almansoori Petroleum Services: Business Strategy Scorecard
11.24.5 Recent Developments
11.25 Calfrac Well Services, Ltd.
11.25.1 Business Overview
11.25.2 Product Offerings
11.25.3 Calfrac Well Services, Ltd.: Product Offerings Scorecard
11.25.4 Calfrac Well Services, Ltd.: Business Strategy Scorecard
11.26 Key Energy Services, Inc.
11.26.1 Overview
11.26.2 Product Offerings
11.26.3 Key Energy Services, Inc.: Product Offerings Scorecard
11.26.4 Key Energy Services, Inc.: Business Strategy Scorecard
11.26.5 Recent Developments
12 Appendix (Page No. - 261)
12.1 Insights of Industry Experts
12.2 Discussion Guide
12.3 Knowledge Store: Marketsandmarkets’ Subscription Portal
12.4 Introducing RT: Real-Time Market Intelligence
12.5 Available Customizations
12.6 Related Reports
12.7 Author Details
List of Tables (88 Tables)
Table 1 Global Oilfield Servies Market Snapshot
Table 2 Oilfield Services Market Size, By Application, 2015–2022 (USD Million)
Table 3 Onshore Oilfield Services Market Size, By Region, 2015–2022 (USD Million)
Table 4 Well Intervention Services Market Size, By Application, 2015–2022 (USD Million)
Table 5 Onshore Well Intervention Market Size, By Region, 2015–2022 (USD Million)
Table 6 Well Completion Services Market Size, By Application, 2015–2022 (USD Million)
Table 7 Onshore Well Completion Market Size, By Region, 2015–2022 (USD Million)
Table 8 Offshore Oilfield Services Market Size, By Region, 2015–2022 (USD Million)
Table 9 Offshore Well Intervention Market Size, By Region, 2015–2022 (USD Million)
Table 10 Offshore Well Completion Market Size, By Region, 2015–2022 (USD Million)
Table 11 Oilfield Services Market Size, By Type, 2015–2022 (USD Million)
Table 12 Equipment Rental Market Size, By Region, 2015–2022 (USD Million)
Table 13 Field Operation Market Size, By Application, 2015–2022 (USD Million)
Table 14 Onshore Well Intervention Market Size, By Region, 2015–2022 (USD Million)
Table 15 Analytical Services Market Size, By Application, 2015–2022 (USD Million)
Table 16 Oilfield Services Market Size, By Service Type, 2015–2022 (USD Million)
Table 17 Oilfield Services Market Analysis: By Services
Table 18 Pressure Pumping Market Size, By Region, 2015–2022 (USD Million)
Table 19 North America: Pressure Pumping Services Market Size, By Country, 2015–2022 (USD Million)
Table 20 Asia-Pacific: Pressure Pumping Services Market Size, By Country, 2015–2022 (USD Million)
Table 21 Europe: Pressure Pumping Services Market Size, By Country, 2015–2022 (USD Million)
Table 22 South America: Pressure Pumping Services Market Size, By Country, 2015–2022 (USD Million)
Table 23 The Middle East: Pressure Pumping Services Market Size, By Country, 2015–2022 (USD Million)
Table 24 Africa: Pressure Pumping Services Market Size, By Country, 2015–2022 (USD Million)
Table 25 Oil Country Tubular Goods Market Size, By Region, 2015–2022 (USD Million)
Table 26 North America: Oil Country Tubular Goods Market Size, By Country, 2015–2022 (USD Million)
Table 27 Asia-Pacific: Oil Country Tubular Goods Market Size, By Country, 2015–2022 (USD Million)
Table 28 Europe: Oil Country Tubular Goods Market Size, By Country, 2015–2022 (USD Million)
Table 29 South America: Oil Country Tubular Goods Market Size, By Country, 2015–2022 (USD Million)
Table 30 The Middle East: Oil Country Tubular Goods Market Size, By Country, 2015–2022 (USD Million)
Table 31 Africa: Oil Country Tubular Goods Market Size, By Country, 2015–2022 (USD Million)
Table 32 Wireline Services Market Size, By Region, 2015–2022 (USD Million)
Table 33 North America: Wireline Services Market Size, By Country, 2015–2022 (USD Million)
Table 34 Asia-Pacific: Wireline Services Market Size, By Country, 2015–2022 (USD Million)
Table 35 Europe: Wireline Services Market Size, By Country, 2015–2022 (USD Million)
Table 36 South America: Wireline Services Market Size, By Country, 2015–2022 (USD Million)
Table 37 The Middle East: Wireline Services Market Size, By Country, 2015–2022 (USD Million)
Table 38 Africa: Wireline Services Market Size, By Country, 2015–2022 (USD Million)
Table 39 Well Completion Equipment & Services Market Size, By Region, 2015–2022 (USD Million)
Table 40 North America: Well Completion Equipment & Services Market Size, By Country, 2015–2022 (USD Million)
Table 41 Asia-Pacific: Well Completion Equipment & Services Market Size, By Country, 2015–2022 (USD Million)
Table 42 Europe: Well Completion Equipment & Services Market Size, By Country, 2015–2022 (USD Million)
Table 43 South America: Well Completion Equipment & Services Market Size, By Country, 2015–2022 (USD Million)
Table 44 The Middle East: Well Completion Equipment & Services Market Size, By Country, 2015–2022 (USD Million)
Table 45 Africa: Well Completion Equipment & Services Market Size, By Country, 2015–2022 (USD Million)
Table 46 Well Intervention Services Market Size, By Region, 2015–2022 (USD Million)
Table 47 North America: Onshore Well Intervention Services Market Size, By Country, 2015–2022 (USD Million)
Table 48 North America: Offshore Well Intervention Services Market Size, By Country, 2015–2022 (USD Million)
Table 49 Asia-Pacific: Onshore Well Intervention Services Market Size, By Country, 2015–2022 (USD Million)
Table 50 Asia-Pacific: Offshore Well Intervention Services Market Size, By Country, 2015–2022 (USD Million)
Table 51 Europe: Onshore Well Intervention Services Market Size, By Country, 2015–2022 (USD Million)
Table 52 Europe: Offshore Well Intervention Services Market Size, By Country, 2015–2022 (USD Million)
Table 53 South America: Onshore Well Intervention Services Market Size, By Country, 2015–2022 (USD Million)
Table 54 South America: Offshore Well Intervention Services Market Size, By Country, 2015–2022 (USD Million)
Table 55 The Middle East: Onshore Well Intervention Services Market Size, By Country, 2015–2022 (USD Million)
Table 56 The Middle East: Offshore Well Intervention Services Market Size, By Country, 2015–2022 (USD Million)
Table 57 Africa: Onshore Well Intervention Services Market Size, By Country, 2015–2022 (USD Million)
Table 58 Africa: Offshore Well Intervention Services Market Size, By Country, 2015–2022 (USD Million)
Table 59 Drilling & Completion Fluid Services Market Size, By Region, 2015–2022 (USD Million)
Table 60 North America: Drilling & Completion Fluid Services Market Size, By Country, 2015–2022 (USD Million)
Table 61 Asia-Pacific: Drilling & Completion Fluid Services Market Size, By Country, 2015–2022 (USD Million)
Table 62 Europe: Drilling & Completion Fluid Services Market Size, By Country, 2015–2022 (USD Million)
Table 63 South America: Drilling & Completion Fluid Services Market Size, By Country, 2015–2022 (USD Million)
Table 64 The Middle East: Drilling & Completion Fluid Services Market Size, By Country, 2015–2022 (USD Million)
Table 65 Africa: Drilling & Completion Fluid Services Market Size, By Country, 2015–2022 (USD Million)
Table 66 Drilling Waste Management Services Market Size, By Region, 2015–2022 (USD Million)
Table 67 North America: Drilling Waste Management Services Market Size, By Country, 2015–2022 (USD Million)
Table 68 Asia-Pacific: Drilling Waste Management Services Market Size, By Country, 2015–2022 (USD Million)
Table 69 Europe: Drilling Waste Management Services Market Size, By Country, 2015–2022 (USD Million)
Table 70 South America: Drilling Waste Management Services Market Size, By Country, 2015–2022 (USD Million)
Table 71 The Middle East: Drilling Waste Management Services Market Size, By Country, 2015–2022 (USD Million)
Table 72 Africa: Drilling Waste Management Services Market Size, By Country, 2015–2022 (USD Million)
Table 73 Coiled Tubing Services Market Size, By Region, 2015–2022 (USD Million)
Table 74 North America: Coiled Tubing Services Market Size, By Country, 2015–2022 (USD Million)
Table 75 Asia-Pacific: Coiled Tubing Services Market Size, By Country, 2015–2022 (USD Million)
Table 76 Europe: Coiled Tubing Services Market Size, By Country, 2015–2022 (USD Million)
Table 77 South America: Coiled Tubing Services Market Size, By Country, 2015–2022 (USD Million)
Table 78 The Middle East: Coiled Tubing Services Market Size, By Country, 2015–2022 (USD Million)
Table 79 Africa: Coiled Tubing Services Market Size, 2015–2022 (USD Million)
Table 80 Oilfield Services Market Size, By Region, 2015–2022 (USD Million)
Table 81 Oilfield Services Market Analysis: By Region
Table 82 North America: Oilfield Services Market Size, By Country, 2015–2022 (USD Million)
Table 83 Asia-Pacific: Oilfield Services Market Size, By Country, 2015–2022 (USD Million)
Table 84 Europe: Oilfield Services Market Size, By Country, 2015–2022 (USD Million)
Table 85 South America: Oilfield Services Market Size, By Country, 2015–2022 (USD Million)
Table 86 The Middle East: Oilfield Services Market Size, By Country, 2015–2022 (USD Million)
Table 87 Africa: Oilfield Services Market Size, By Country, 2015–2022 (USD Million)
Table 88 Service Offerings
List of Figures (111 Figures)
Figure 1 Oilfield Services Market: Research Design
Figure 2 Market Size Estimation Methodology: Bottom-Up Approach
Figure 3 Market Size Estimation Methodology: Top-Down Approach
Figure 4 Data Triangulation Methodology
Figure 5 The North American Market Dominated the Oilfield Services Market in 2016
Figure 6 Onshore Segment Dominated the Oilfield Services Market in 2016
Figure 7 Top Market Developments (2014–2017)
Figure 8 Increase in Oil & Gas Production Activities & Shale Gas Exploration are Expected to Drive the Oilfield Services Market During the Forecast Period
Figure 9 The Onshore Oilfield Services Segment is Expected to Lead the Market During the Forecast Period
Figure 10 The North American Market Held More Than Half of the Share of the Oilfield Services Market in 2016
Figure 11 The Pressure Pumping Services Segment is Expected to Account for the Maximum Share
Figure 12 Market Dynamics: Oilfield Services Market
Figure 13 Shale Reservoir Assessment in 2015
Figure 14 Iran Oil Production
Figure 15 World Crude Oil Annual Production vs Consumption, 2011–2015
Figure 16 World Crude Oil Annual Production, 2015–2018
Figure 17 Natural Gas Production in China, Canada, and the U.S.
Figure 18 Global Rig Count, 2010–2016
Figure 19 West Texas Intermediate (WTI) Crude Oil Price, 2013–2017
Figure 20 Investment in Renewable Energy, By Sector, 2014 & 2015
Figure 21 Investment in Renewable Energy, By Region, 2014 & 2015
Figure 22 Oilfield Services Supply Chain
Figure 23 The Offshore Application Segment is Expected to Grow at the Highest Rate During the Forecast Period
Figure 24 The Onshore Well Completion Segment is Expected to Grow at the Highest Rate During the Forecast Period
Figure 25 The Offshore Well Intervention Segment is Expected to Grow at the Highest Rate During the Forecast Period
Figure 26 Oilfield Services Market Share (Value), By Service (2017–2022)
Figure 27 Pressure Pumping Services Market Share (Value), By Region (2017–2022)
Figure 28 Oil Country Tubular Goods Market Share (Value), By Region (2017–2022)
Figure 29 Wireline Services Market Share (Value), By Region (2017–2022)
Figure 30 Well Completion Equipment & Services Market Share (Value), By Region (2017–2022)
Figure 31 Well Intervention Services Market Share (Value), By Region (2017–2022)
Figure 32 Coiled Tubing Services Market Share (Value), By Region (2017)
Figure 33 Regional Snapshot (2016): the Markets in Africa & Asia Pacific are Emerging as New Hotspots
Figure 34 The Middle East is the Fastest-Growing Oilfield Services Market, 2017–2022
Figure 35 North America: Market Snapshot
Figure 36 Asia-Pacific: Market Snapshot
Figure 37 Companies Adopted New Product & Techchnology Launches and Contracts & Agreements as Key Growth Strategies, 2014–2017
Figure 38 Schlumberger Limited Held the Largest Share in the Oilfield Services Market, 2016
Figure 39 Market Evaluation Framework, 2014–2017
Figure 40 Battle for Market Share (2014–2017): New Product & Technology Launches & Contracts & Agreements Were the Key Strategies Adopted By Players in the Oilfield Services Market
Figure 41 Oilfield Services Market: Vendor Dive Matrix
Figure 42 Baker Hughes Incorporated: Company Snapshot
Figure 43 Baker Hughes Incorporated: Product Offerings Scorecard
Figure 44 Baker Hughes Incorporated: Business Strategy Scorecard
Figure 45 Halliburton Company: Company Snapshot
Figure 46 Halliburton Company: Product Offerings Scorecard
Figure 47 Halliburton Company: Business Strategy Scorecard
Figure 48 Schlumberger Limited: Company Snapshot
Figure 49 Schlumberger Limited: Product Offerings Scorecard
Figure 50 Schlumberger Limited: Business Strategy Scorecard
Figure 51 Weatherford International, PLC: Company Snapshot
Figure 52 Weatherford International, PLC: Product Offerings Scorecard
Figure 53 Weatherford International, PLC: Business Strategy Scorecard
Figure 54 Superior Energy Services, Inc.: Company Snapshot
Figure 55 Superior Energy Services, Inc.: Product Offerings Scorecard
Figure 56 Superior Energy Services, Inc.: Business Strategy Scorecard
Figure 57 National Oilwell Varco, Inc.: Company Snapshot
Figure 58 National Oilwell Varco, Inc.: Product Offerings Scorecard
Figure 59 National Oilwell Varco, Inc.: Business Strategy Scorecard
Figure 60 China Oilfield Services Limited: Company Snapshot
Figure 61 China Oilfield Services Limited: Product Offerings Scorecard
Figure 62 China Oilfield Services Limited: Business Strategy Scorecard
Figure 63 Archer Limited: Company Snapshot
Figure 64 Archer Limited: Product Offerings Scorecard
Figure 65 Archer Limited: Business Strategy Scorecard
Figure 66 Expro International Group Holdings, Ltd.: Company Snapshot
Figure 67 Expro International Group Holdings, Ltd.: Product Offeringsscorecard
Figure 68 Expro International Group Holdings, Ltd.: Business Strategy Scorecard
Figure 69 Technipfmc, PLC: Product Offerings Scorecard
Figure 70 Technipfmc, PLC: Business Strategy Scorecard
Figure 71 GE Oil & Gas: Company Snapshot
Figure 72 GE Oil & Gas: Product Offerings Scorecard
Figure 73 GE Oil & Gas: Business Strategy Scorecard
Figure 74 Trican Well Service, Ltd.: Company Snapshot
Figure 75 Trican Well Service, Ltd.: Product Offerings Scorecard
Figure 76 Trican Well Service, Ltd.: Business Strategy Scorecard
Figure 77 Welltec International APS: Company Snapshot
Figure 78 Welltec International APS: Product Offerings Scorecard
Figure 79 Welltec International APS: Business Strategy Scorecard
Figure 80 Basic Energy Services, Inc.: Company Snapshot
Figure 81 Basic Energy Services, Inc.: Product Offerings Scorecard
Figure 82 Basic Energy Services, Inc.: Business Strategy Scorecard
Figure 83 Nabors Industries, Ltd.: Company Snapshot
Figure 84 Nabors Industries, Ltd.: Product Offerings Scorecard
Figure 85 Nabors Industries, Ltd.: Business Strategy Scorecard
Figure 86 Pioneer Energy Services Corp.: Company Snapshot
Figure 87 Pioneer Energy Services Corp.: Product Offerings Scorecard
Figure 88 Pioneer Energy Services Corp.: Business Strategy Scorecard
Figure 89 Qinterra As: Product Offerings Scorecard
Figure 90 Qinterra As: Business Strategy Scorecard
Figure 91 Scomi Energy Services BHD: Company Snapshot
Figure 92 Scomi Energy Services BHD: Product Offerings Scorecard
Figure 93 Scomi Energy Services BHD: Business Strategy Scorecard
Figure 94 Nordic Well Services, LLC: Product Offerings Scorecard
Figure 95 Nordic Well Services, LLC: Business Strategy Scorecard
Figure 96 Condor Energy Services Limited: Product Offerings Scorecard
Figure 97 Condor Energy Services Limited: Business Strategy Scorecard
Figure 98 The Engineering and Development Group: Product Offerings Scorecard
Figure 99 The Engineering and Development Group: Business Strategy Scorecard
Figure 100 Gyrodata Incorporated: Product Offerings Scorecard
Figure 101 Gyrodata Incorporated: Business Strategy Scorecard
Figure 102 Oilserv: Product Offerings Scorecard
Figure 103 Oilserv: Business Strategy Scorecard
Figure 104 Almansoori Petroleum Services: Product Offerings Scorecard
Figure 105 Almansoori Petroleum Services: Business Strategy Scorecard
Figure 106 Calfrac Well Services, Ltd.: Company Snapshot
Figure 107 Calfrac Well Services, Ltd.: Product Offerings Scorecard
Figure 108 Calfrac Well Services, Ltd.: Business Strategy Scorecard
Figure 109 Key Energy Services, Inc.: Company Snapshot
Figure 110 Key Energy Services, Inc.: Product Offerings Scorecard
Figure 111 Key Energy Services, Inc.: Business Strategy Scorecard
This study involved 4 major activities in estimating the current size of the oilfield services market. Exhaustive secondary research was done to collect information on the market, peer market, and parent market. The next step was to validate these findings, assumptions, and market sizing with industry experts across the value chain through primary research. Both top-down and bottom-up approaches were used to estimate the total market size. Thereafter, the market breakdown and data triangulation were done to estimate the market size of the segments and sub-segments.
Secondary Research
This research study involved the use of extensive secondary sources, directories, and databases, such as Hoover’s, Bloomberg BusinessWeek, Factiva, and OneSource, to identify and collect information useful for a technical, market-oriented, and commercial study of the global oilfield services market. The other secondary sources included annual reports, press releases & investor presentations of companies, white papers, certified publications, articles by recognized authors, manufacturer associations, trade directories, and databases. Secondary research has been mainly used to obtain key information about the industry’s supply chain, the market’s monetary chain, total pool of key players, market classification and segmentation according to industry trends to the bottom-most level, regional markets, and key developments from both market and technology-oriented perspectives.
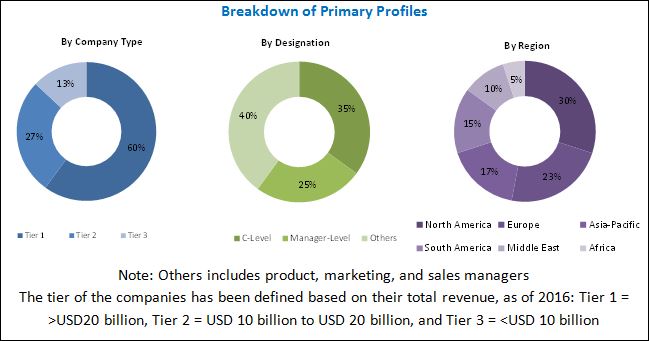
Primary Research
The oilfield services market comprises several stakeholders, such as, equipment manufacturers, service providers and end-users in the supply chain. The demand-side of this market is characterized by its end-users, namely, the oilfield operators / owners, drilling contractors, and others. The supply-side is characterized by various equipment manufacturers, and oilfield service providers. Various primary sources from both the supply and demand sides of the market were interviewed to obtain qualitative and quantitative information. Primary sources from the supply side include industry experts such as CEOs, vice presidents, marketing directors, technology and innovation directors, and related key executives from various companies and organizations operating in the market. The breakdown of primary respondents is given below:
To know about the assumptions considered for the study, download the pdf brochure
Market Size Estimation
Both top-down and bottom-up approaches have been used to estimate and validate the size of the global oilfield services market and its dependent submarkets. These methods were also used extensively to estimate the size of various sub-segments in the market. The research methodology used to estimate the market size includes the following:
- The key players in the industry and market have been identified through extensive secondary research, and their market share in the respective regions have been determined through both primary and secondary research.
- The industry’s supply chain and market size, in terms of value, have been determined through primary and secondary research processes.
- All percentage shares, splits, and breakdowns have been determined using secondary sources and verified through primary sources.
Data Triangulation
After arriving at the overall market size—using the market size estimation processes as explained above—the oilfield services market was split into several segments and sub-segments. To complete the overall market engineering process and arrive at the exact statistics of each market segment and sub-segment, data triangulation and market breakdown procedures were employed, wherever applicable. The data was triangulated by studying various factors and trends from both the demand and supply sides in the oil & gas upstream sector.
Report Objectives
- To define, describe, and forecast the global oilfield services market by application, services, and region
- To provide detailed information regarding major factors influencing the growth of the market (drivers, restraints, opportunities, and industry-specific challenges related to the market)
- To strategically analyze the market with respect to individual growth trends, future prospects, and contribution of each segment to the market
- To analyze opportunities in the market for stakeholders and provide details of a competitive landscape for market leaders
- To forecast the market size of segments with respect to six major regions (along with countries), namely, North America, Europe, Asia Pacific, South America, the Middle East, and Africa
- To strategically profile key players and comprehensively analyze their market shares and core competencies for the market
- To analyze competitive developments such as contracts & agreements, mergers & acquisitions, new product developments, and expansions in the market
Scope of the Report
|
Report Metric |
Details |
|
Market Size available for years |
2015–2022 |
|
Base year considered |
2016 |
|
Forecast period |
2017–2022 |
|
Forecast units |
Value (USD) |
|
Segments covered |
service, application, and region |
|
Geographies covered |
Asia Pacific, North America, Europe, the Middle East, Africa, and South America |
|
Companies covered |
Baker Hughes (US), Halliburton (US), Schlumberger (US), Weatherford (Switzerland), Superior Energy Services (US), National Oilwell Varco (US), China Oilfield Services Limited (China), Archer Limited (Bermuda), Expro International Group Holdings (UK), TechnipFMC (UK), GE Oil & Gas (UK), Trican Well Service (Canada), Welltec International (Denmark), Basic Energy Services (US), Nabors Industries (Bermuda), |
This research report categorizes the oilfield services market on the basis of service, application, and region.
On the basis of Service:
- Coiled Tubing Services
- Well Completion Equipment & Services
- Drilling & Completion Fluids Services
- Drilling Waste Management Services
- Oil Country Tubular Goods
- Pressure Pumping Services
- Well Intervention Services
- Wireline Services
On the basis of Application:
- Onshore
- Offshore
On the basis of Region:
- North America
- Asia Pacific
- South America
- Europe
- Middle East
- Africa
Available Customizations:
With the given market data, MarketsandMarkets offers customizations as per the client’s specific needs. The following customization options are available for this report:
Regional Analysis
- Further breakdown of region or country-specific analysis
Company Information
- Detailed analyses and profiling of additional market players (up to 5)


Growth opportunities and latent adjacency in Oilfield Services Market