Solid Control Equipment Market by Types (Shale Shakers, Mud Centrifuges, Desander & Desilter, Mud Cleaners, and Others), by Application Areas (Onshore & Offshore), & by Geography - Global Trends & Forecast to 2019


Waste is an inevitable by-product of drilling activities in the form of cuttings and mud. The increasing demand of energy and growing environmental concern is driving the solids control equipment market. Solids control equipment optimizes the drilling efficiencies by reducing fluid losses. The American Petroleum Institute (API) has estimated that approximately 1.21 barrels of total drilling waste fluids are generated for every foot drilled.
Drilling fluids and cuttings are the largest potential waste stream generated during drilling operations. Solids control equipment separated the solids cuttings from the fluid and processed further for treatment and disposal. On the drilling rig, solids control equipment applies different technologies to remove unwanted solids and recover drilling mud for reuse.
The global solids control equipment market is segmented on the basis of its major types which include shale shakers & screen, mud centrifuges, hydrocyclones, mud cleaner, and others. Also, the market is segmented on the basis of its applications which include onshore and offshore. Furthermore, the market is segmented on the basis of regions such as North America, Europe, Asia-Pacific, Middle East & Africa, and South America. Each segment has been analyzed with respect to its market trends, growth trends, and future prospects. The data has been analyzed from 2012 to 2019, and all quantitative data regarding segmentation is mentioned in terms of value ($Million).
North America dominating the solids control equipment market:
Increasing land drilling activities and also growing focus towards the offshore drilling activities, the region is witnessed the largest share in terms of value in the global solids control equipment market. The North America solids control equipment market is expected to reach $1.23 billion by 2019 with a CAGR of around 9.3%. Europe and Asia-Pacific stood at second and third positions in global solids control equipment market. The following chart represents the market share of the regions in solids control equipment market in the year 2013.
Global Solids Control Equipnment Market Share (Value), by Region, 2013
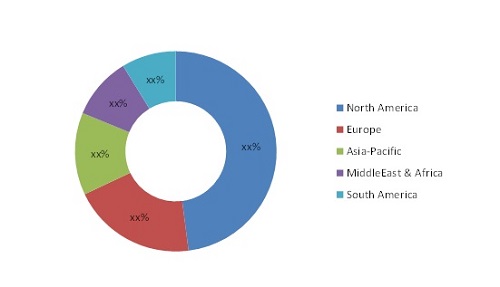
Source: Related Research Publications, and MarketsandMarkets Analysis
The global solid control equipment market is also analyzed with respect to Porter's Five Force model. Different market forces such as suppliers� power, buyers� power, degree of competition, threat from substitutes, and threat from new entrants, are analyzed with respect to the solid control equipment industry. The report also provides a competitive landscape of major market players that includes developments, mergers & acquisition, expansion & investments, agreements & contracts, new echnologies developments, and others. A number of these developments are spotted by key industry players that suggest the growth strategy of these companies as well as of the overall industry.
The report also provides a comprehensive review of major market drivers, restraints, opportunities, winning imperatives, and key burning issues in the solid control equipment market. Key players in the industry are profiled in detail with their recent developments. Some of these include companies such as Schlumberger (U.S.), Weatherford (Ireland), GN Solid Control (China), Derrick Equipment Company (U.S.), Halliburton (U.S.), and many others.
The global solid control equipment market is expected to reach $2.65 billion industry by 2019, with a projected CAGR of around 10.0%, signifying a high demand for solid control equipment in both developed and developing countries.
Solid control equipment�s are drilling equipment to control or separate the undesirable and even harmful solids mixed in drilling fluids. The separation of harmful solids from drilling fluids will contributes to better mud property and meets the increased demand on drilling efficiency by the scientific application and arrangement of solids control equipment.
The increase in the international rig count over the period and growing environmental concern primarily drives the global solid control equipment market. The utilization of solid control equipment enhances the drilling efficiencies by reducing the fluid losses to a large extent. According to the American Petroleum Institute (API), it has been estimated that approximately 1.2 barrels of total drilling waste fluids are generated for every foot drilled. These impacts the overall production of the drilling activity and thus plays a vital role in effective and efficient drilling. North America, Europe and Asia-Pacific are the major regions where solid control equipment constitutes to around 50% of the global demand.
North America: Largest market for solid control equipment
The North American market will see strong growth through 2019 due to robust drilling activity in the region. North America constitutes to more than 45% of the total share in global solid control equipment market. Further, the region is increasing its interests in exploring unconventional resources like, shale gas, coal bed methane and others which will give rise to the demand of solid control equipment in the future years.
The figure below shows the global solid control equipment market share by region in the year 2013.
Global Solid Control Equipment Market Share (Value), by Region, 2013
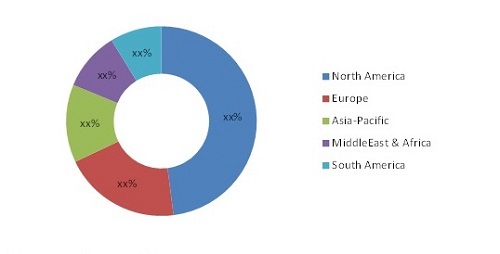
Source: MarketsandMarkets Analysis
Contracts & Agreements: Key Strategy
Leading companies in the solids control equipment market have focused on contracts & agreements as one of the key strategies. The major reasons behind the widespread acceptance of contracts & agreements as a strategy in this market are, it creates a leading diversified solids control equipment portfolio by adopting the expertise of the renowned companies, and enables market penetration in economies such as U.S., Gulf of Mexico etc. From 2011 to 2014, contracts & agreements have led the market developments, accounting for 42% of the total share.
 Exclusive indicates content/data unique to MarketsandMarkets and not available with any competitors.
Table of Contents
1 Introduction(Page No. - 16)
1.1 Objectives of the Study
1.2 Market Definition
1.3 Study Scope
1.3.1 Years Considered for the Study
1.4 Currency & Pricing
1.5 Limitations
1.6 Stakeholders
2 Research Methodology(Page No. - 19)
2.1 Research Data
2.1.1 Secondary Data
2.1.2 Primary Data
2.1.2.1 Key Data From Primary Sources
2.1.2.2 Key Industry Insights
2.1.2.3 Breakdown of Primaries
2.2 Factor Analysis
2.2.1 Introduction
2.2.2 Demand-Side Analysis
2.2.2.1 Increasing Oil & Gas Consumption
2.2.3 Supply-Side Analysis
2.2.3.1 Parent Market Analysis: Drilling Waste Management Market
2.2.3.2 Huge Investments in Oil & Gas Exploration
2.3 Market Size Estimation
2.3.1 Bottom-Up Approach
2.3.2 Top-Down Approach
2.4 Market Breakdown & Data Triangulation
2.5 Research Assumptions & Limitations
2.5.1 Assumptions
2.5.2 Limitations
3 Executive Summary(Page No. - 31)
4 Premium Insights(Page No. - 35)
4.1 Attractive Opportunities in Solids Control Equipment Market
4.2 Solids Control Equipment Market- Top Three Equipment Segments
4.3 Solids Control Equipment Market in North America
4.4 U.S. to Dominate the Global Solids Control Equipment Market During the Forecast Period
4.5 Solids Control Equipment Market: Europe
4.6 Solids Control Equipment Market, By Application
4.7 Solids Control Equipment Market: Developing vs. Developed Nations
5 Market Overview(Page No. - 43)
5.1 Introduction
5.2 Solids Control Equipment Market, By Application
5.2.1 Introduction
5.2.2 Onshore Application
5.2.3 Offshore Application
5.3 Solids Control Equipment Market, By Type
5.3.1 Introduction
5.3.2 Shale Shakers & Screen
5.3.3 MUD Centrifuges
5.3.4 Hydrocyclones
5.3.5 MUD Cleaners
5.4 Market Dynamics
5.4.1 Drivers
5.4.1.1 Recent Practice of Environment-Friendly Drilling
5.4.1.2 Lower Overall Well Cost, Achieved By Adopting Solids Control Measures
5.4.1.3 Recognition of Synthetic Fluid in the Drilling Fluid
5.4.2 Restraints
5.4.2.1 Environmental Concerns Putting Ceilingon Drilling Activities
5.4.2.2 Adverse Weather Conditions
5.4.3 Opportunities
5.4.3.2 Arctic Drilling
5.4.3.3 Expanding Market Demand With Innovation of New Products
5.4.4 Challenges
5.4.4.1 Socio-Political Turmoil
5.4.4.2 Adverse Tax Laws
5.5 Impact of Oil Prices
6 Industry Trends(Page No. - 52)
6.1 Introduction
6.2 Supply Chain Analysis
6.3 Porter�s Five Forces Analysis
6.3.1 Threat of Substitutes
6.3.2 Threat of New Entrants
6.3.3 Bargaining Power of Buyers
6.3.4 Bargaining Power of Suppliers
6.3.5 Degree of Competition
7 Solids Control Equipment Market, By Application(Page No. - 55)
7.1 Introduction
7.2 Onshore Solids Control Equipment Market
7.3 Offshore Solids Control Equipment Market
8 Solids Control Equipment Market, By Type(Page No. - 60)
8.1 Introduction
8.2 Shale Shakers & Screens Market
8.3 MUD Centrifuges Market
8.4 Hydrocyclones Market
8.5 MUD Cleaner Market
8.6 Other Solids Control Equipment Market
9 Solids Control Equipment Market, By Region(Page No. - 68)
9.1 Introduction
9.2 North America
9.2.1 By Type
9.2.2 By Country
9.2.2.1 United States (U.S.)
9.2.2.2 Canada
9.2.2.3 Mexico
9.3 Application Market in North America
9.4 North America: Parent Market Analysis
9.4.1 North America Drilling Waste Management Market, By Country
9.5 Europe
9.5.1 By Type
9.5.2 By Country
9.5.2.1 Russia
9.5.2.2 Norway
9.5.2.3 United Kingdom (U.K.)
9.5.2.4 Others
9.6 Application Market in Europe
9.7 Europe: Parent Market Analysis
9.7.1 Europe Drilling Waste Management Market, By Country
9.8 Asia-Pacific
9.8.1 By Type
9.8.2 By Country
9.8.2.1 China
9.8.2.2 Thailand
9.8.2.3 India
9.8.2.4 Australia
9.8.2.5 Indonesia
9.8.2.6 Malaysia
9.8.2.7 Central Asia
9.8.2.8 Others
9.9 Application Market in Asia-Pacific
9.1 Asia-Pacific: Parent Market Analysis
9.10.1 Asia-Pacific Drilling Waste Management Market, By Country
9.11 Middle East & Africa
9.11.1 By Type
9.11.2 By Country
9.11.2.1 Saudi Arabia
9.11.2.2 Oman
9.11.2.3 Kuwait
9.11.2.4 Qatar
9.11.2.5 United Arab Emirates (UAE)
9.11.2.6 Egypt
9.11.2.7 Algeria
9.11.2.8 Libya
9.11.2.9 Angola
9.11.2.10 Nigeria
9.11.2.11 Others
9.12 Application Market in Middle East & Africa
9.13 Middle East & Africa Parent Market Analysis
9.13.1 Middle East& Africa Drilling Waste Management Market, By Country
9.14 South America
9.14.1 By Type
9.14.2 By Country
9.14.2.1 Venezuela
9.14.2.2 Argentina
9.14.2.3 Brazil
9.14.2.4 Others
9.15 Application Market in South America
9.16 South America Parent Market Analysis
9.16.1 South America Drilling Waste Management Market, By Country
10 Competitive Landscape(Page No. - 111)
10.1 Overview
10.2 Market Share Analysis
10.3 Growth Strategies in the Solids Control Equipment Market
10.3.1 Contracts & Agreements Lead the Way
10.4 Competitive Situation & Trends
10.4.1 Analysis of Market Developments
10.5 Battle for Market Share: Contracts & Agreements Was the Key Strategy
10.6 Contracts & Agreements
10.7 Mergers & Acquisitions, 2011�2014
10.8 New Product Launches, 2011�2014
10.9 Other Developments, 2011�2014
11 Company Profiles(Page No. - 125)
(Company at A Glance, Recent Financials, Products & Services, Strategies & Insights, & Recent Developments)*
11.1 Geographic Revenue Mix
11.2 Aker Solutions
11.3 Baker Hughes Inc.
11.4 Clean Harbors, Inc.
11.5 Derrick Equipment Company
11.6 GN Solids Control
11.7 Halliburton Company
11.8 Imdex Limited
11.9 Kemtron Technologies, Inc.
11.1 Kosun Machinery Co., Ltd.
11.11 National Oilwell Varco, Inc.
11.12 Schlumberger Ltd.
11.13 SCOMI Group BHD
11.14 Secure Energy Services, Inc.
11.15 Weatherford International Ltd.
*Detailson Company at A Glance, Recent Financials, Products & Services, Strategies & Insights, & Recent Developments Might Not Be Captured in Case of Unlisted Companies.
12 Appendix(Page No. - 165)
12.1 Insights of Industry Experts
12.2 Discussion Guide
12.3 Introducing RT: Real Time Market Intelligence
12.4 Available Customizations
12.5 Related Reports
List of Tables (65 Tables)
Table 1 Solid Control Equipment Market Size, By Application,2012-2019 ($Million)
Table 2 Onshore Solid Control Equipment Market Size, By Region,2012-2019 ($Million)
Table 3 Offshore Solid Control Equipment Market, By Region, 2012-2019 ($Million)
Table 4 Solid Control Equipment Market Size, By Type, 2012-2019 ($Million)
Table 5 Shale Shakers & Screens Market Size, By Region, 2012-2019 ($Million)
Table 6 MUD Centrifuges Market Size, By Region, 2012-2019 ($Million)
Table 7 Hydrocyclones Market Size, By Region, 2012-2019 ($Million)
Table 8 MUD Cleaners Market Size, By Region, 2012-2019 ($Million)
Table 9 Other Solid Control Equipment Market Size, By Region,2012-2019 ($Million)
Table 10 Solid Control Equipment Market Size, By Region, 2011-2019 ($Million)
Table 11 North America: Solid Control Equipment Market Size, By Type,2011-2019, ($Million)
Table 12 North America: Solid Control Equipment Market Size, By Country,2011-2019 ($Million)
Table 13 U.S.: Solid Control Equipment Market Size, By Type, 2011-2019, ($Million)
Table 14 Canada: Solid Control Equipment Market, By Type, 2011-2019 ($Million)
Table 15 Mexico: Solid Control Equipment Market Size, By Type,2011-2019 ($Million)
Table 16 North America: Solid Control Equipment Market Size, By Application, 2012-2019 ($Million)
Table 17 North America: Drilling Waste Management Market Size(Value),By Country, 2012-2019 ($Million)
Table 18 Europe: Solid Control Equipment Market Size, By Type,2011-2019 ($Million)
Table 19 Europe: Solid Control Equipment Market Size, By Country,2011-2019 ($Million)
Table 20 Russia: Solid Control Equipment Market Size, By Type,2011-2019 ($Million)
Table 21 Norway: Solid Control Equipment Market Size, By Type,2011-2019 ($Million)
Table 22 U.K.: Solid Control Equipment Market Size, By Type, 2011-2019 ($Million)
Table 23 Others: Solid Control Equipment Market Size, By Type,2011-2019 ($Million)
Table 24 Europe: Solid Control Equipment Market Size, By Application,2012-2019 ($Million)
Table 25 Europe: Drilling Waste Management Market Size (Value), By Country, 2012-2019 ($Million)
Table 26 Asia-Pacific: Solid Control Equipment Market Size, By Type,2011-2019 ($Million)
Table 27 Asia-Pacific: Solid Control Equipment Market Size, By Country,2011-2019 ($Million)
Table 28 China: Solid Control Equipment Market Size, By Type,2011-2019 ($Million)
Table 29 Thailand: Solid Control Equipment Market Size, By Type,2011-2019 ($Million)
Table 30 India: Solid Control Equipment Market Size, By Type,2011-2019 ($Million)
Table 31 Australia: Solid Control Equipment Market Size, By Type,2011-2019 ($Million)
Table 32 Indonesia: Solid Control Equipment Market Size, By Type,2011-2019 ($Million)
Table 33 Malaysia: Solid Control Equipment Market Size, By Type,2011-2019 ($Million)
Table 34 Central Asia: Solid Control Equipment Market Size, By Type,2011-2019 ($Million)
Table 35 Others: Solid Control Equipment Market Size, By Type,2011-2019 ($Million)
Table 36 Asia-Pacific: Solids Control Equipment Market Size, By Application,2012-2019 ($Million)
Table 37 Asia-Pacific: Drilling Waste Management Market, By Country,2012-2019 ($Million)
Table 38 Middle East & Africa: Solids Control Equipment Market Size, By Type, 2011-2019 ($Million)
Table 39 Middle East & Africa: Solids Control Equipment Market Size, By Country, 2011-2019 ($Million)
Table 40 Saudi Arabia: Solids Control Equipment Market Size, By Type,2011-2019 ($Million)
Table 41 Oman: Solids Control Equipment Market Size, By Type,2011-2019 ($Million)
Table 42 Kuwait: Solids Control Equipment Market Size, By Type,2011-2019 ($Million)
Table 43 Qatar: Solids Control Equipment Market Size, By Type,2011-2019 ($Million)
Table 44 UAE: Solids Control Equipment Market Size, By Type, 2011-2019 ($Million)
Table 45 Egypt: Discharge Practices and Standards for Drilling MUD and Cuttings
Table 46 Egypt: Solids Control Equipment Market Size, By Type,2011-2019 ($Million)
Table 47 Algeria: Solids Control Equipment Market Size, By Type,2011-2019, ($Million)
Table 48 Libya: Solids Control Equipment Market Size, By Type,2011-2019 ($Million)
Table 49 Angola: Solids Control Equipment Market Size, By Type,2011-2019 ($Million)
Table 50 Nigeria: Solids Control Equipment Market Size, By Type,2011-2019 ($Million)
Table 51 Others: Solids Control Equipment Market Size, By Type,2011-2019 ($Million)
Table 52 Middle East & Africa: Solids Control Equipment Market Size,By Application, 2012-2019 ($Million)
Table 53 Middle East & Africa Drilling Waste Management Market, By Country, 2012-2019 ($Million)
Table 54 South America: Solids Control Equipment Market Size, By Type,2011-2019 ($Million)
Table 55 South America: Solids Control Equipment Market Size, By Country,2011-2019 ($Million)
Table 56 Venezuela: Solids Control Equipment Market Size, By Type,2011-2019 ($Million)
Table 57 Argentina: Solids Control Equipment Market Size, By Type,2011-2019 ($Million)
Table 58 Brazil: Solids Control Equipment Market Size, By Type,2011-2019 ($Million)
Table 59 Others: Solids Control Equipment Market Size, By Type,2011-2019 ($Million)
Table 60 South America: Solids Control Equipment Market Size, By Application, 2012-2019 ($Million)
Table 61 South America Drilling Waste Management Market, By Country,2012-2019 ($Million)
Table 62 Contracts & Agreements, 2011�2014
Table 63 Mergers & Acquisitions, 2011-2014
Table 64 New Product Launches, 2011-2014
Table 65 Other Developments, 2011-2014
List of Figures (52 Figures)
Figure 1 Markets Covered: Solids Control Equipment Market
Figure 2 Solids Control Equipment Market: Research Design
Figure 3 Key Data From Secondary Sources
Figure 4 Key Countries With Increasing Oil Consumption (2009 & 2013)
Figure 5 Key Countries With Increasing Gas Consumption (2009 & 2013)
Figure 6 Parent Market Analysis: Share of Solids Control Equipment Market in the Drilling Waste Management Market, 2013
Figure 7 Increase in Investments Created Opportunities for Manufacturing Companies in 2013
Figure 8 Bottom-Up Approach
Figure 9 Top-Down Approach
Figure 10 Data Triangulation: Solids Control Equipment Market
Figure 11 Limitations of the Research Study
Figure 12 Timeline of Exploration & Production of Waste Management
Figure 13 Shale Shakers & Screens Equipment Occupied the Largest Market Share in North America in 2013
Figure 14 North America is Expected to Dominate the Solids Control Equipment Market in the Next Five Years
Figure 15 Solids Control Equipment Market Size, 2014-2019 ($Million)
Figure 16 Increasing Drilling Activities Set to Spur Growth in Solids Control Equipment Market
Figure 17 Hydrocyclones to Grow at the Highest Rate Among the Top Three Solids Control Equipment
Figure 18 Shale Shakers & Screen Equipment to Capture Lion�s Share in the Booming North American Market
Figure 19 Shale Shakers & Screen Equipment in U.S. is Expected to Hold the Largest Market Size By 2019
Figure 20 U.S. Commanded Over One-Fourth of the Global Solids Control Equipment Market in 2013
Figure 21 Europe & North America to Hold Over 65% of the Solids Control Equipment Market By 2019 2014 to 2019
Figure 22 Offshore Application is Expected to Increase Its Market Share By 2019coming Years
Figure 23 Middle East & Africa Shows A High Growth Potential
Figure 24 Market Segmentation: By Application, Type, & Region
Figure 25 Practice of Environment-Friendly Drilling to Drive the Solids Control Equipment Market
Figure 26 Middle East Countries Witnessed A Rise in Natural Gas Production
Figure 27 Sudden Decline in Brent Crude Oil Prices Since Mid 2014
Figure 28 Supply Chain Analysis
Figure 29 Porter�s Five Force Analysis: Solids Control Equipment Market
Figure 30 Onshore Application is Expected to Dominate the Solids Control Equipment Market
Figure 31 Shale Shakers & Screens Dominates the Solids Control Equipment Market
Figure 32 Solids Control Equipment Market Share (Value), By Region, 2013
Figure 33 South America: Total E&P Investments (Onshore & Offshore),2010-2014 ($Billion)
Figure 34 Companies Adopted Product Contracts & Agreements as the Key Growth Strategy Over the Last Four Years
Figure 35 Solids Control Equipment Market Share (Value) Analysis, 2013
Figure 36 Solids Control Equipment: Key Growth Strategies Share, By Development, March 2011- December 2014
Figure 37 Figure 3: Solid Control Equipment Market Share Analysis of Top Companies, By Development, 2011-2014
Figure 38 Aker Solutions: Business Overview
Figure 39 Baker Hughes Inc.: Business Overview
Figure 40 Clean Harbors, Inc.: Business Overview
Figure 41 SWOT Analysis
Figure 42 Halliburton Company: Business Overview
Figure 43 SWOT Analysis
Figure 44 Imdex Limited: Business Overview
Figure 45 National Oilwell Varco, Inc.: Business Overview
Figure 46 SWOT Analysis
Figure 47 Schlumberger Ltd.: Business Overview
Figure 48 SCOMI Group BHD: Business Overview
Figure 49 SWOT Analysis
Figure 50 Secure Energy Services, Inc.: Business Overview
Figure 51 Weatherford International Ltd.: Business Overview
Figure 52 SWOT Analysis


Growth opportunities and latent adjacency in Solid Control Equipment Market