Web Performance Market by Solution (Web Performance Monitoring, Web Performance Optimization, and Web Performance Testing), Service, Organization Size (SMEs and Large Enterprises), Deployment Type, Vertical, and Region - Global Forecast to 2022


[118 Pages Report] The global web performance market accounted for USD 3.22 Billion in 2016 and is projected to reach USD 5.45 Billion by 2022, at a Compound Annual Growth Rate (CAGR) of 9.2% during the forecast period.
The web performance market report aims at estimating the market size and growth potential of the market across different segments: components (solutions and services), organization size, deployment types, verticals, and regions. The primary objective of the report is to provide a detailed analysis of the major factors (drivers, restraints, opportunities, industry-specific challenges, and recent developments) influencing the market growth, analyze the market opportunities for stakeholders, and offer details of the competitive landscape to the market leaders.
The research methodology used to estimate and forecast the web performance market size began with capturing data on the key vendor revenues through secondary sources, such as annual reports, TM Forum, International Telecommunication Union (ITU), IEEE Xplore, press releases and investor presentations of companies, and white papers, certified publications, and articles from recognized associations and government publishing sources. Vendor offerings were also taken into consideration to determine the market segmentation. The bottom-up procedure was employed to arrive at the overall market size of the global market from the revenues of the key market players. After arriving at the overall market size, the market was split into several segments and subsegments, which were then verified through primary research by conducting extensive interviews with key industry personnel, such as Chief Executive Officers (CEOs), Vice Presidents (VPs), directors, and executives. The data triangulation and market breakdown procedures were employed to complete the overall market engineering process and arrive at the exact statistics for all segments and subsegments. The breakdown of the profiles of the primary discussion participants is depicted in the below figure:
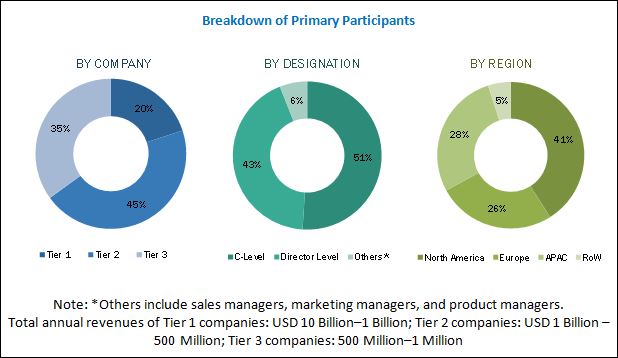
To know about the assumptions considered for the study, download the pdf brochure
The web performance market includes companies such as Akamai (US), CA Technologies (US), Cavisson (US), CDNetworks (Korea), Cloudflare (US), Dynatrace (US), F5 Networks (US), IBM (US), Micro Focus (UK), Netmagic (India), Neustar (US), New Relic (US), ThousandEyes (US), and ZenQ (US).
Please visit 360Quadrants to see the vendor listing of Website Builder Software
Key Target Audiences
- Software vendors
- Web content developers
- Service providers
- Technology providers
- Research organizations
- Cloud platform providers
- Mobile application developers
- Communication Service Providers (CSPs)
- Consulting companies
- Website developers
- Investors and venture capitalists
Scope of the Web Performance Market Report
|
Report Metric |
Details |
|
Market size available for years |
2015�2022 |
|
Base year considered |
2016 |
|
Forecast period |
2017�2022 |
|
Forecast unit |
Value (USD) |
|
Segments covered |
Solution, Service, Organization Size, Deployment Type, Vertical, and Region |
|
Geographies covered |
North America, Europe, Asia Pacific (APAC), Latin America, and Middle East and Africa (MEA) |
|
Companies covered |
Akamai (US), CA Technologies (US), Cavisson (US), CDNetworks (Korea), Cloudflare (US), Dynatrace (US), F5 Networks (US), IBM (US), Micro Focus (UK), Netmagic (India), Neustar (US), New Relic (US), ThousandEyes (US), and ZenQ (US) |
The research report categorizes the market to forecast the revenues and analyze the trends in each of the following subsegments:
Web Performance Market By Component
- Solutions
- Web performance monitoring
- Web performance optimization
- Web performance testing
- Services
- Implementation services
- Consulting services
- Managed services
Market By Organization Size
- Large enterprises
- Small and Medium-sized Enterprises (SMEs)
Web Performance Market By Deployment Type
- On-premises
- Cloud
Market By Vertical
- Telecom and IT
- Government
- Banking, Financial Services, and Insurance (BFSI)
- Automotive
- Logistics and transportation
- Manufacturing
- Retail
- Media and entertainment
- Healthcare
- Others(utilities, education, and gaming)
Web Performance Market By Region
- North America
- Europe
- Asia Pacific (APAC)
- Middle East and Africa (MEA)
- Latin America
Available Customizations
With the given market data, MarketsandMarkets offers customizations as per the company�s specific requirements. The following customization options are available for the report:
Product Analysis
- Product matrix provides detailed product information and comparison
Geographic Analysis
- Further breakdown of the North American web performance market
- Further breakdown of the European market
- Further breakdown of the APAC market
- Further breakdown of the MEA market
- Further breakdown of the Latin American market
Company Information
- Detailed analysis and profiling of additional market players
MarketsandMarkets forecasts the web performance market to grow from USD 3.50 Billion in 2017 to USD 5.45 Billion by 2022, at a Compound Annual Growth Rate (CAGR) of 9.2% during the forecast period. The major factors driving the market growth are the growth of the eCommerce industry, and proliferation of images, videos, and rich media on the web.
The objective of the report is to define, describe, and forecast the web performance market size on the basis of components (solutions and services), organization size, deployment types, verticals, and regions. In the components segment, the solutions segment is expected to have the larger market share during the forecast period. With an increase in the number of connected IT devices, the demand for web connectivity would also rise. This is expected to result in the larger market size of the web performance solutions segment.
In the services segment, the managed services segment is expected to witness the fastest growth rate during the forecast period. End-users have different business requirements that are handled by the managed service providers to help enterprises focus more on their core business. Furthermore, managed services help organizations enhance the customer relationship. Managed services are gaining traction, as they help organizations flourish and simultaneously assist them in increasing the Return on Investment (RoI) by ensuring enhanced web performance across multiple channels.
In the deployment types segment, the cloud deployment type is expected to grow at a higher CAGR during the forecast period. Companies are shifting toward cloud-based services to avoid investments in the IT infrastructure and experience better scalability, faster deployment, and agility benefits. With cloud-based deployments, organizations can easily minimize their upfront costs, manage content quality, increase their RoI, and expand their customer base. Therefore, it is expected that the cloud deployment type would witness higher adoption during the forecast period.
In the verticals segment, the IT and telecom vertical is estimated to have the largest market share in the web performance market in 2017. Business operations in the IT and telecom vertical are mostly dependent on the web, which makes it necessary to use web performance solutions for qualitative and personalized web experiences. Web performance solutions provide technical enterprises timely, quick, and advanced technical assistance, resulting in the best output with minimal time and budget.
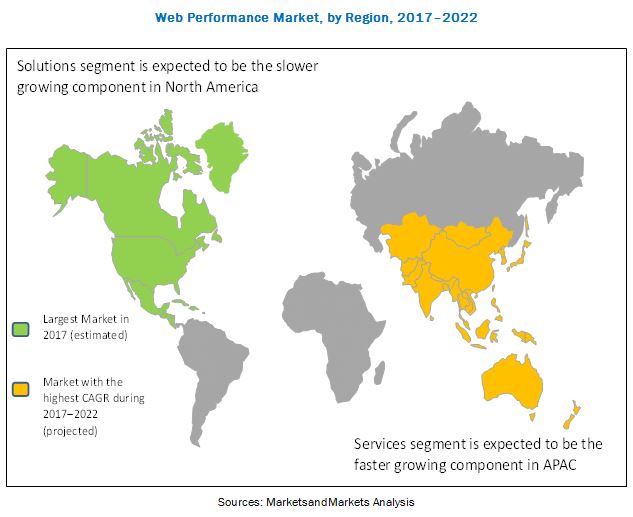
North America is expected to have the largest share in the market during the forecast period. Enterprises in North America have shifted from the traditional business approach to online platforms, which is expected to drive the growth of the eCommerce industry in the region. This has created a demand for new websites and web applications, thereby leading to more need for web performance solutions. This is one of the major reasons for the significant growth of the North American web performance market. Asia Pacific (APAC) is expected to grow at the highest CAGR during the forecast period, as the region has the presence of creditable organizations that are gradually embracing the adoption of advanced technologies.
The growth of the eCommerce industry, and proliferation of images, videos, and rich media on the web are expected to drive the growth of the web performance market. However, the lack of awareness about web performance may hinder the market growth and act as a restraining factor that can hamper business-critical functions in the market.
The major vendors in the web performance market are Akamai (US), CA Technologies (US), Cavisson (US), CDNetworks (Korea), Cloudflare (US), Dynatrace (US), F5 Networks (US), IBM (US), Micro Focus (UK), Netmagic (India), Neustar (US), New Relic (US), ThousandEyes (US), and ZenQ (US).
To speak to our analyst for a discussion on the above findings, click Speak to Analyst
 Exclusive indicates content/data unique to MarketsandMarkets and not available with any competitors.
Table of Contents
1 Introduction (Page No. - 13)
1.1 Objectives of the Study
1.2 Market Definition
1.3 Market Scope
1.4 Years Considered for the Study
1.5 Currency
1.6 Stakeholders
2 Research Methodology (Page No. - 16)
2.1 Research Data
2.1.1 Secondary Data
2.1.2 Primary Data
2.1.2.1 Breakdown of Primaries
2.1.2.2 Key Industry Insights
2.2 Market Size Estimation
2.3 Research Assumptions
2.4 Limitations
3 Executive Summary (Page No. - 23)
4 Premium Insights (Page No. - 27)
4.1 Attractive Market Opportunities in the Web Performance Market
4.2 Market By Service
4.3 Market By Vertical and Region
4.4 Market Investment Scenario
5 Web Performance Market Overview and Industry Trends (Page No. - 29)
5.1 Introduction
5.2 Market Dynamics
5.2.1 Drivers
5.2.1.1 Growth of the Ecommerce Industry
5.2.1.2 Proliferation of Images, Videos, and Rich Media on the Web
5.2.1.3 Rise in Security Breaches and Cyber-Attacks Targeting Enterprise Websites
5.2.2 Restraints
5.2.2.1 Budget Constraints for Smes
5.2.3 Opportunities
5.2.3.1 Large-Scale Adoption of Web Performance Solutions in Highly Regulated Industry Verticals
5.2.3.2 Demand for Mobile Web Performance Solutions
5.2.4 Challenges
5.2.4.1 High Deployment Costs and the Need to Quickly Deploy Solutions for the End-Users
5.2.4.2 Lack of Awareness About Web Performance Solutions
5.3 Use Cases
5.3.1 Use Case 1: Akamai
5.3.2 Use Case 2: Cdnetworks
5.3.3 Use Case 3: Cloudflare
5.3.4 Use Case 4: Neotys
6 Web Performance Market By Component (Page No. - 34)
6.1 Introduction
6.2 Solutions
6.2.1 Web Performance Monitoring
6.2.2 Web Performance Optimization
6.2.3 Web Performance Testing
6.3 Services
6.3.1 Consulting Services
6.3.2 Implementation Services
6.3.3 Managed Services
7 Web Performance Market By Organization Size (Page No. - 43)
7.1 Introduction
7.2 Large Enterprises
7.3 Small and Medium-Sized Enterprises
8 Market By Deployment Type (Page No. - 47)
8.1 Introduction
8.2 On-Premises
8.3 Cloud
9 Web Performance Market By Vertical (Page No. - 51)
9.1 Introduction
9.2 Telecom and IT
9.3 Government
9.4 Banking, Financial Services, and Insurance
9.5 Automotive
9.6 Logistics and Transportation
9.7 Manufacturing
9.8 Retail
9.9 Media and Entertainment
9.10 Healthcare
9.11 Others
10 Web Performance Market By Region (Page No. - 61)
10.1 Introduction
10.2 North America
10.3 Europe
10.4 Asia Pacific
10.5 Middle East and Africa
10.6 Latin America
11 Competitive Landscape (Page No. - 78)
11.1 Overview
11.2 Prominent Players Operating in the Web Performance Market
11.3 Competitive Scenario
11.3.1 Partnerships, Agreements, and Collaborations
11.3.2 New Product Or Service Launches/Product Upgradations
11.3.3 Mergers and Acquisitions
11.3.4 Business Expansions
12 Company Profiles (Page No. - 83)
12.1 Introduction
(Business Overview, Products Offered, Recent Developments, SWOT Analysis, and MnM View)*
12.2 Akamai
12.3 Dynatrace
12.4 Micro Focus (Formerly HPE Software)
12.5 IBM
12.6 F5 Networks
12.7 CA Technologies
12.8 Neustar
12.9 New Relic
12.10 Cloudflare
12.11 Cavisson
12.12 Netmagic Solutions
12.13 Cdnetworks
12.14 Zenq
12.15 Thousandeyes
*Details on Business Overview, Products Offered, Recent Developments, SWOT Analysis, and MnM View Might Not Be Captured in Case of Unlisted Companies.
13 Appendix (Page No. - 109)
13.1 Other Key Developments
13.1.1 New Product Or Service Launches/Product Upgradations
13.1.2 Partnerships, Collaborations, and Agreements
13.1.3 Business Expansions
13.2 Discussion Guide
13.3 Knowledge Store: Marketsandmarkets� Subscription Portal
13.4 Introducing RT: Real-Time Market Intelligence
13.5 Available Customizations
13.6 Related Reports
13.7 Author Details
List of Tables (64 Tables)
Table 1 Web Performance Market, 2015-2022
Table 2 Market Size By Component, 2015�2022 (USD Million)
Table 3 Market Size By Solution, 2015�2022 (USD Million)
Table 4 Solutions: Market Size, By Region, 2015�2022 (USD Million)
Table 5 Web Performance Monitoring Market Size, By Region, 2015�2022 (USD Million)
Table 6 Web Performance Optimization Market Size, By Region, 2015�2022 (USD Million)
Table 7 Web Performance Testing Market Size, By Region, 2015�2022 (USD Million)
Table 8 Web Performance Market Size By Service, 2015�2022 (USD Million)
Table 9 Services: Market Size, By Region, 2015�2022 (USD Million)
Table 10 Consulting Services Market Size, By Region, 2015�2022 (USD Million)
Table 11 Implementation Services Market Size, By Region, 2015�2022 (USD Million)
Table 12 Managed Services Market Size, By Region, 2015�2022 (USD Million)
Table 13 Web Performance Market Size, By Organization Size, 2015�2022 (USD Million)
Table 14 Large Enterprises: Market Size, By Region, 2015�2022 (USD Million)
Table 15 Small and Medium-Sized Enterprises: Market Size, By Region, 2015�2022 (USD Million)
Table 16 Web Performance Market Size, By Deployment Type, 2015�2022 (USD Million)
Table 17 On-Premises: Market Size, By Region, 2015�2022 (USD Million)
Table 18 Cloud: Market Size, By Region, 2015�2022 (USD Million)
Table 19 Web Performance Market Size, By Vertical, 2015�2022 (USD Million)
Table 20 Telecom and IT: Market Size, By Region, 2015�2022 (USD Million)
Table 21 Government: Size, By Region, 2015�2022 (USD Million)
Table 22 Banking, Financial Services, and Insurance: Market Size, By Region, 2015�2022 (USD Million)
Table 23 Automotive: Market Size, By Region, 2015�2022 (USD Million)
Table 24 Logistics and Transportation: Market Size, By Region, 2015�2022 (USD Million)
Table 25 Manufacturing: Market Size, By Region, 2015�2022 (USD Million)
Table 26 Retail: Web Performance Market Size By Region, 2015�2022 (USD Million)
Table 27 Media and Entertainment: Market Size By Region, 2015�2022 (USD Million)
Table 28 Healthcare: Market Size By Region, 2015�2022 (USD Million)
Table 29 Others: Market Size By Region, 2015�2022 (USD Million)
Table 30 Web Performance Market Size, By Region, 2015�2022 (USD Million)
Table 31 North America: Web Performance Market Size, By Component, 2015�2022 (USD Million)
Table 32 North America: Market Size By Solution, 2015�2022 (USD Million)
Table 33 North America: Market Size By Service, 2015�2022 (USD Million)
Table 34 North America: Market Size By Organization Size, 2015�2022 (USD Million)
Table 35 North America: Market Size By Deployment Type, 2015�2022 (USD Million)
Table 36 North America: Market Size By Vertical, 2015�2022 (USD Million)
Table 37 Europe: Web Performance Market Size, By Component, 2015�2022 (USD Million)
Table 38 Europe: Market Size By Solution, 2015�2022 (USD Million)
Table 39 Europe: Market Size By Service, 2015�2022 (USD Million)
Table 40 Europe: Market Size By Organization Size, 2015�2022 (USD Million)
Table 41 Europe: Market Size By Deployment Type, 2015�2022 (USD Million)
Table 42 Europe: Market Size By Vertical, 2015�2022 (USD Million)
Table 43 Asia Pacific: Web Performance Market Size, By Component, 2015�2022 (USD Million)
Table 44 Asia Pacific: Market Size By Solution, 2015�2022 (USD Million)
Table 45 Asia Pacific: Market Size By Service, 2015�2022 (USD Million)
Table 46 Asia Pacific: Market Size By Organization Size, 2015�2022 (USD Million)
Table 47 Asia Pacific: Market Size By Deployment Type, 2015�2022 (USD Million)
Table 48 Asia Pacific: Market Size By Vertical, 2015�2022 (USD Million)
Table 49 Middle East and Africa: Web Performance Market Size, By Component, 2015�2022 (USD Million)
Table 50 Middle East and Africa: Market Size By Solution, 2015�2022 (USD Million)
Table 51 Middle East and Africa: Market Size By Service, 2015�2022 (USD Million)
Table 52 Middle East and Africa: Market Size By Organization Size, 2015�2022 (USD Million)
Table 53 Middle East and Africa: Market Size By Deployment Type, 2015�2022 (USD Million)
Table 54 Middle East and Africa: Market Size By Vertical, 2015�2022 (USD Million)
Table 55 Latin America: Web Performance Market Size, By Component, 2015�2022 (USD Million)
Table 56 Latin America: Market Size By Solution, 2015�2022 (USD Million)
Table 57 Latin America: Market Size By Service, 2015�2022 (USD Million)
Table 58 Latin America: Market Size By Organization Size, 2015�2022 (USD Million)
Table 59 Latin America: Market Size By Deployment Type, 2015�2022 (USD Million)
Table 60 Latin America: Market Size By Vertical, 2015�2022 (USD Million)
Table 61 Partnerships, Agreements, and Collaborations, 2017
Table 62 New Product Or Service Launches/Product Upgradations, 2017
Table 63 Mergers and Acquisitions, 2015�2017
Table 64 Business Expansions, 2015�2017
List of Figures (37 Figures)
Figure 1 Web Performance Market Segmentation
Figure 2 Market Research Design
Figure 3 Market Data Triangulation
Figure 4 Market Size Estimation Methodology: Bottom-Up Approach
Figure 5 Market Size Estimation Methodology: Top-Down Approach
Figure 6 Web Performance Market: Assumptions
Figure 7 Market By Component (2017 vs 2022)
Figure 8 Market By Organization Size (2017 vs 2022)
Figure 9 Market By Deployment Type (2017 vs 2022)
Figure 10 Market By Vertical (2017 vs 2022)
Figure 11 Web Performance Market By Region
Figure 12 Growth of the Ecommerce Industry is Expected to Drive the Progress of the Market
Figure 13 Managed Services Segment is Expected to Grow at the Fastest CAGR During the Forecast Period
Figure 14 Telecom and IT Vertical, and North America are Estimated to Have the Largest Market Shares in 2017
Figure 15 Asia Pacific is Expected to Emerge as the Best Market for Investments Over the Next 5 Years
Figure 16 Web Performance Market: Drivers, Restraints, Opportunities, and Challenges
Figure 17 Services Component is Expected to Exhibit A Higher Growth Rate During the Forecast Period
Figure 18 Web Performance Monitoring Solution is Expected to Exhibit the Highest CAGR During the Forecast Period
Figure 19 Managed Services Segment is Expected to Exhibit the Highest CAGR During the Forecast Period
Figure 20 Small and Medium-Sized Enterprises Segment is Expected to Grow at A Higher CAGR During the Forecast Period
Figure 21 Cloud Deployment Type is Expected to Grow at A Higher CAGR During the Forecast Period
Figure 22 Retail Vertical is Expected to Grow at the Highest CAGR During the Forecast Period
Figure 23 Asia Pacific is Expected to Grow at the Highest CAGR During the Forecast Period
Figure 24 Regional Snapshot: Asia Pacific is Expected to Exhibit the Highest Growth Rate During the Forecast Period
Figure 25 North America Snapshot
Figure 26 Asia Pacific Snapshot
Figure 27 Companies Adopted New Product Launches and Upgradations as the Key Growth Strategy During 2015�2017
Figure 28 Web Performance Market Evaluation Framework
Figure 29 Geographic Revenue Mix: Top 3 Market Players
Figure 30 Akamai: SWOT Analysis
Figure 31 Dynatrace: SWOT Analysis
Figure 32 Micro Focus: SWOT Analysis
Figure 33 IBM: Company Snapshot
Figure 34 IBM: SWOT Analysis
Figure 35 F5 Networks: Company Snapshot
Figure 36 F5 Networks: SWOT Analysis
Figure 37 New Relic: Company Snapshot


Growth opportunities and latent adjacency in Web Performance Market