Visualization and 3D Rendering Software Market by Application (High-End Video Games, Architectural and Product Visualization, Training Simulation, Marketing and Advertisement), Deployment Type, End-User, and Region- Global forecast to 2022


[119 Pages Report] The visualization and 3D rendering software market size is expected to grow from USD 1.06 billion in 2017 to USD 2.92 billion by 2022, at a Compound Annual Growth Rate (CAGR) of 22.40% during the forecast period. The base year considered for the study is 2016 and the forecast period is 2017�2022.
Visualization and 3D rendering is a process of developing and processing 3D model into a pixel perfect 3D photorealistic image, which can be used by the end-users such as architecture, building and construction, media and entertainment, design and engineering, healthcare and life sciences, and academia, and others (GIS and forensic science industry). The base year for the study is 2016 and the forecast period is considered to be 2017 to 2022.
Key Market Dynamics in Visualization and 3D Rendering Software Market
User-friendly renderer interface
Visualization and 3D rendering software are widely used by architects, designers, and engineers for visualization of their product. This software has user-friendly interface which makes them widely adopted by the users. Users use visualization tools for creating their 3D visuals according to their requirement. Using rendering software does not require a high level of technical expertise. These rendering plugins can easily be integrated with the rendering platforms or engines. Such add-ons available in the market enhance the functionality of the rendering engines. These plugins and add-ons add a special tool bar to the current software, which increases the plethora of tools for generating photorealistic and 3D rendered visuals. Thus, the user-friendly interface offered by the visualization and rendering tools provides the designers and architects with the basic technical expertise to use the tools efficiently. This has led to the huge adoption of the visualization and 3D software.
Lack of infrastructure
In the emerging economies such as Latin America and APAC, lack of infrastructure poses a challenge in terms of supporting equipment and technologies for its proper functioning. There is also a lack of technical experts for supporting the technology. In these regions, 3D imaging solutions are used only by a limited number of organizations due to unavailability or limited availability of executive support, software training, and 3D imaging compatible devices such as 3D displays. The high hardware cost for supporting these technologies also plays a crucial role in the adoption of this technology.
Moreover, limited availability of 3D, supporting technologies help in increasing the price of 3D solutions. This also adds overhead cost to the organization using this technology. Further, the cost of acquiring new infrastructure to implement 3D technologies and solutions is huge. The lack of adaptability of existing infrastructure hinders the growth of the 3D rendering market. To implement 3D rendering technologies comprehensively, more smart equipment and devices are required. Moreover, devices such as a 3D scanner and 3D ultrasound machines are 3D technology-based and require supporting 3D solutions, which thereby increases the operational cost.
The following are the major objectives of the study
- The objectives of the report are to define, describe, and forecast the visualization and 3D rendering software market size on the basis of application, deployment type, end-user, and region;
- To provide detailed information regarding key factors influencing the market growth (drivers, restraints, opportunities, and challenges)
- To track and analyze the market scenario on the basis of technological developments, product launches, and mergers & acquisitions;
- To forecast the market size of market segments with respect to five major regions: North America, Europe, Asia Pacific (APAC), Middle East and Africa (MEA), and Latin America.
- This research study involves extensive usage of secondary sources, directories, and databases (such as D&B Hoovers, Bloomberg Businessweek, and Factiva) to identify and collect information useful for this technical, market-oriented, and commercial aspect of the market size. The research methodology used to estimate and forecast the market begins with capturing data on key vendor revenues through secondary research.
- The vendor offerings are also taken into consideration to determine the market segmentation.
- The bottom-up procedure is employed to arrive at the overall market size of the visualization and 3D rendering software market from revenues of key players in the market.
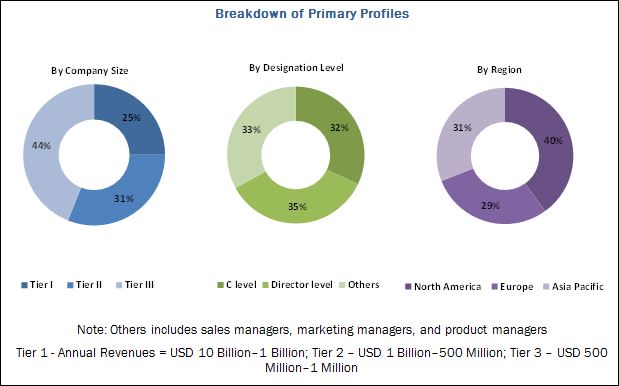
After arriving at the overall market size, the total market has been split into several segments and subsegments. The figure below shows the break-down of the primaries on the basis of company, designation, and region, conducted during the research study.
The figure below shows the break-down of the primaries on the basis of company, designation, and region, conducted during the research study.
To know about the assumptions considered for the study, download the pdf brochure
The visualization and 3D rendering software market ecosystem comprises vendors, such as Autodesk, Inc (California, US), Siemens AG (Munich, Germany), Adobe Systems (California, US), Dassault Syst�mes (V�lizy-Villacoublay, France), NVIDIA Corporation (California, US), Trimble, Inc (California, US), Next Limit Technologies (Madrid, Spain), Corel Corporation (Ottawa, Canada), SAP SE (Walldorf, Germany), Chaos group (Sofia, Bulgaria), The Foundry Visionmongers Ltd (London, UK), NewTek, Inc (Texas, US), Render Legion S.R.O. (Prague, Czech Republic), Luxion, Inc (California, US), and Cristie Digital Systems (California, US). These Visualization and 3D Rendering Software Vendors are rated and listed by us on the basis of product quality, reliability, and their business strategy. Please visit 360Quadrants to see the vendor listing of Visualization and 3D Rendering Software.
Key Target Audience for Visualization and 3D Rendering Software Market
- Visualization and 3D rendering solution vendors
- System integrators
- Computer graphics developers
- Third-party vendors
- Consulting companies
- Application service provider
- Investors and venture capitalists
- Technology providers
- Suppliers, distributors, and contractors
- End-users/enterprise-users
Scope of the 3D Rendering Software Market Research Report
|
Report Metrics |
Details |
|
Market size available for years |
2017�2022 |
|
Base year considered |
2016 |
|
Forecast period |
2017�2022 |
|
Forecast units |
Billion (USD) |
|
Segments covered |
Application (High-End Video Games, Architectural and Product Visualization, Training Simulation, Marketing and Advertisement), Deployment Type, End-User, and Region |
|
Geographies covered |
North America, Europe, Asia Pacific (APAC), Middle East and Africa (MEA), and Latin America |
|
Companies covered |
Autodesk, Inc (California, US), Siemens AG (Munich, Germany), Adobe Systems (California, US), Dassault Syst�mes (V�lizy-Villacoublay, France), NVIDIA Corporation (California, US), Trimble, Inc (California, US), Next Limit Technologies (Madrid, Spain), Corel Corporation (Ottawa, Canada), SAP SE (Walldorf, Germany), Chaos group (Sofia, Bulgaria), The Foundry Visionmongers Ltd (London, UK), NewTek, Inc (Texas, US), Render Legion S.R.O. (Prague, Czech Republic), Luxion, Inc (California, US) |
The research report categorizes the 3D Rendering Software Market to forecast the revenues and analyze trends in each of the following subsegments:
By Application
- Architectural & Product Visualization
- High-End Video Games
- Marketing & Advertisement
- Training Simulation
By Deployment Type
- On-Premises
- Cloud-Based
By End-User
- Architecture, Building, and Construction
- Media & Entertainment
- Design & Engineering
- Healthcare & Life Sciences
- Academia
- Others
Visualization and 3D Rendering Software Market By Region
- North America
- Europe
- APAC
- MEA
- Latin America
Available Customizations
With the given market data, MarketsandMarkets offers customizations based on company-specific needs. The following customization options are available for the report:
Geographic Analysis
- Further breakdown of the APAC market into countries contributing 75% to the regional Visualization and 3D Rendering Software Market size
- Further breakdown of the North American market into countries contributing 75% to the regional market size
- Further breakdown of the Latin American market into countries contributing 75% to the regional market size
- Further breakdown of the MEA market into countries contributing 75% to the regional market size
- Further breakdown of the European market into countries contributing 75% to the regional market size
Company Information
- Detailed analysis and profiling of additional market players (up to 5)
The visualization and 3D rendering software solutions are gaining traction in the current 3D computer graphics ecosystem in various industry verticals such as design and engineering, architecture, building and construction, media and entertainment, and healthcare and life sciences. Visualization and 3D rendering are different points of a 3D workflow in which the graphical content is created using 3D software. These enable the visual presentation of the objects for different purposes in various industry verticals including architecture, media and entertainment, healthcare and life sciences, and academia.
The objectives of the report are to define, describe, and forecast the market size on the basis of application, deployment type, end-user, and region. Based on the application in visualization and 3D rendering software market, architectural and product visualization have the largest market share in the visualization and 3D rendering application market during the forecast period. The market size is expected to grow as 3D product rendering helps in easy marketing, saves prototyping time and expense, and lets users see physical conditions of the product.
Marketing and advertisement are expected to record the highest market growth rate during the forecast period, as with the help of visualization and rendering technique consumers get to see a realistic picture of how their image or animation is going to turn out. 3D rendering creates an effective marketing tool giving a potential client a full visualization of a space or building; whereas architectural and product visualization is the second fastest growing market during the forecast period.
In the deployment type segment of the visualization and 3D rendering software market, the cloud-based solution is expected to grow at the highest CAGR during the forecast period. Enterprises and organizations are relying heavily on the cloud services and cloud platforms to obtain resources on demand. With cloud deployment, organizations pay for the resources that they use, which helps them reduce the cost of capital.
User friendly renderer interface drive the visualization and 3D rendering software market.
Architecture, Building, and Construction
Architectural 3D rendering has emerged as a key marketing tool as it provides a photo-realistic and professional visualization of future development. Many real estate companies have started investing in the architectural 3D rendering services. This is especially beneficial for marketing and client presentations. Building properties take time, and competition can be stiff. Real estate developers pre-sell these properties before they are even built. 3D rendering also enables clients to see how the property would look once the construction is finished.
Media and Entertainment
The media and entertainment industry are growing at a phenomenal rate. The market for digital special effects is growing in Latin America, APAC, Northern Europe, as well as the US. This can be witnessed in the rise of 3D cinema screens all over the world. The gaming industry is also increasing at an exponential rate. The evolution of 3D technologies such as auto-stereoscopy that allows viewing 3D images without using glasses is driving an expansion of 3D technology to mobile devices as well.
Design and Engineering
Over 90% of the mechanical design engineers across the world use 3D rendering to produce engineering designs for product manufacturing. The ever-rising popularity of 3D rendering is due to the high resolution, perfection, and quality of product designs that engineers can produce by using these techniques. 3D rendering is the most viable option to rely upon because of the detailed and crystal clear three-dimensional visual representation of the final products it brings forth.
Healthcare and Life Sciences
The healthcare and medical segment is continuously adopting new technologies, devices, and solutions. At present, 3D and 4D technology is being used by the healthcare industry at a substantial rate. The use of 3D rendering is increasing in the medical domain, especially for radiological images. This technology provides help in treating affected body parts.
Critical questions the report answers:
- Where will all these developments take the industry in the mid to long term?
- What are the biggest application areas in visualization and 3D rendering software market?
To speak to our analyst for a discussion on the above findings, click Speak to Analyst
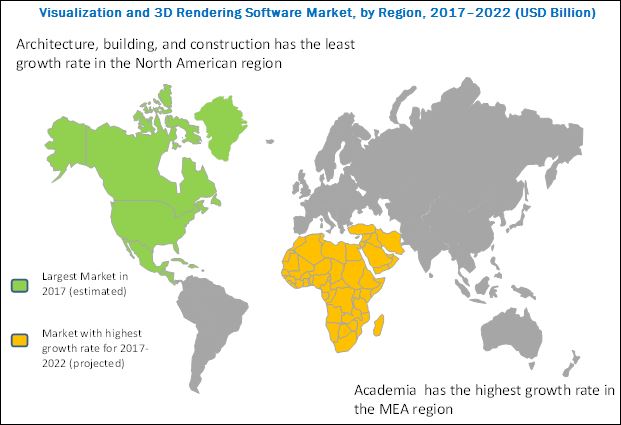
North America is expected to hold the largest market share in the market during the forecast period, as visualization and 3D rendering enhance and increase the precision of organizational procedures so as to offer enriched products to end-users. The MEA region is expected to grow at the highest rate as the region is experiencing the presence of creditable organizations that are gradually enabling the embracement of advance technologies.
Innovative technological developments are benefiting all stakeholders of the market. However, lack of infrastructure in 3D technologies is may hamper business critical functions in the market.
Major vendors in the visualization and 3D rendering software market include Autodesk, Inc (California, US), Siemens AG (Munich, Germany), Adobe Systems (California, US), Dassault Syst�mes (V�lizy-Villacoublay, France), NVIDIA Corporation (California, US), Trimble, Inc (California, US), Next Limit Technologies (Madrid, Spain), Corel Corporation (Ottawa, Canada), SAP SE (Walldorf, Germany), Chaos group (Sofia, Bulgaria), The Foundry Visionmongers Ltd (London, UK), NewTek, Inc (Texas, US), Render Legion S.R.O. (Prague, Czech Republic), Luxion, Inc (California, US), and Cristie Digital Systems (California, US). These players adopted various strategies such as new product launches, partnerships, agreements, collaborations, mergers & acquisitions, and business expansions to cater to the needs of their customers.
 Exclusive indicates content/data unique to MarketsandMarkets and not available with any competitors.
Table of Contents
1 Introduction (Page No. - 13)
1.1 Objectives of the Study
1.2 Market Definition
1.3 Market Scope
1.4 Years Considered for the Study
1.5 Currency
1.6 Stakeholders
2 Research Methodology (Page No. - 16)
2.1 Research Data
2.1.1 Secondary Data
2.1.2 Primary Data
2.1.2.1 Breakdown of Primaries
2.2 Market Size Estimation
2.3 Microquadrant Research Methodology
2.3.1 Vendor Inclusion Criteria
2.4 Research Assumptions and Limitations
2.4.1 Assumptions
2.4.2 Limitations
3 Executive Summary (Page No. - 22)
4 Premium Insights (Page No. - 27)
4.1 Attractive Market Opportunities in the Market
4.2 Market By Application
4.3 Visualization and 3D Rendering Software Market
4.4 Market Potential
4.5 Visualization and 3D Rendering Software: Regional Market
4.6 Lifecycle Analysis, By Region (2017)
5 Market Overview and Industry Trends (Page No. - 31)
5.1 Introduction
5.2 Market Segmentation
5.2.1 By Application
5.2.2 By Deployment Type
5.2.3 By End-User
5.2.4 By Region
5.3 Innovation Spotlight
5.4 Market Dynamics
5.4.1 Drivers
5.4.1.1 Just-In-Time Marketing
5.4.1.2 Less Time and Low Cost
5.4.1.3 User-Friendly Renderer Interface
5.4.2 Restraints
5.4.2.1 Lack of Infrastructure
5.4.3 Opportunities
5.4.3.1 Growth of High Definition 3D Viewing Experience
5.4.3.2 Rising Need of Prototyping
5.4.4 Challenges
5.4.4.1 Lack of Availability of 3D Content
5.5 Regulations
5.5.1 Health Insurance Portability and Accountability Act
5.5.2 Digital Millennium Copyright Act (DMCA)
6 Visualization and 3D Rendering Software Market Analysis, By Application (Page No. - 40)
6.1 Introduction
6.2 Architectural and Product Visualization
6.3 High-End Video Games
6.4 Marketing and Advertisement
6.5 Training Simulation
7 Market Analysis, By Deployment Type (Page No. - 45)
7.1 Introduction
7.2 On-Premises
7.3 Cloud
8 Market Analysis, By End-User (Page No. - 49)
8.1 Introduction
8.2 Architecture, Building, and Construction
8.3 Media and Entertainment
8.4 Design and Engineering
8.5 Healthcare and Life Sciences
8.6 Academia
8.7 Others
9 Visualization and 3D Rendering Software Market, Geographic Analysis (Page No. - 56)
9.1 Introduction
9.2 North America
9.3 Europe
9.4 Asia Pacific
9.5 Middle East and Africa
9.6 Latin America
10 Competitive Landscape (Page No. - 68)
10.1 Microquadrant Overview
10.1.1 Vanguards
10.1.2 Innovators
10.1.3 Dynamic
10.1.4 Emerging
10.2 Competitive Benchmarking
10.2.1 Product Offerings Adopted By Major Players in Market
10.2.2 Business Strategies Adopted By Major Players in Market
11 Company Profiles (Page No. - 72)
(Business Overview, Product Offerings & Business Strategies, Key Insights, Recent Developments, MnM View)*
11.1 Autodesk, Inc.
11.2 Siemens AG
11.3 Adobe Systems Incorporated
11.4 Dassault Syst�mes
11.5 Nvidia Corporation
11.6 Trimble, Inc.
11.7 Next Limit Technologies
11.8 Corel Corporation
11.9 SAP SE
11.10 Chaos Group
11.11 The Foundry Visionmongers Ltd.
11.12 NewTek, Inc.
11.13 Render Legion S.R.O.
11.14 Luxion, Inc.
11.15 Christie Digital Systems USA, Inc.
*Details on Business Overview, Product Offerings & Business Strategies, Key Insights, Recent Developments, MnM View Might Not Be Captured in Case of Unlisted Companies.
12 Appendix (Page No. - 111)
12.1 Knowledge Store: MarketsandMarkets� Subscription Portal
12.2 Discussion Guide
12.3 Introducing RT: Real-Time Market Intelligence
12.4 Available Customizations
12.5 Related Reports
12.6 Author Details
List of Tables (35 Tables)
Table 1 United States Dollar Exchange Rate, 2014�2016
Table 2 Evaluation Criteria
Table 3 Visualization and 3D Rendering Software Market Size and Growth Rate, 2017�2022 (USD Million, Y-O-Y%)
Table 4 Market Size, By Application, 2015�2022 (USD Million)
Table 5 Architectural and Product Visualization: Market Size, By Region, 2015-2022 (USD Million)
Table 6 High-End Video Games: Market Size, By Region, 2015-2022 (USD Million)
Table 7 Marketing and Advertisement: Market Size, By Region, 2015-2022 (USD Million)
Table 8 Training Simulation: Market Size, By Region, 2015-2022 (USD Million)
Table 9 Market Size, By Deployment Type, 2015�2022 (USD Million)
Table 10 On-Premises: Market Size, By Region, 2015�2022 (USD Million)
Table 11 Cloud Deployment: Market Size, By Region, 2015�2022 (USD Million)
Table 12 Market Size, By End-User, 2015�2022 (USD Million)
Table 13 Architecture, Building, and Construction: Market Size, By Region, 2015�2022 (USD Million)
Table 14 Media and Entertainment: Market Size, By Region, 2015�2022 (USD Million)
Table 15 Design and Engineering: Market Size, By Region, 2015�2022 (USD Million)
Table 16 Healthcare and Life Sciences: Market Size, By Region, 2015�2022 (USD Million)
Table 17 Academia: Market Size, By Region, 2015�2022 (USD Million)
Table 18 Others: Market Size, By Region, 2015�2022 (USD Million)
Table 19 Visualization and 3D Rendering Software Market Size, By Region, 2015�2022 (USD Million)
Table 20 North America: Market Size, By Application, 2015�2022 (USD Million)
Table 21 North America: Market Size, By Deployment Type, 2015�2022 (USD Million)
Table 22 North America: Market Size, By End-User, 2015�2022 (USD Million)
Table 23 Europe: Market Size, By Application, 2015�2022 (USD Million)
Table 24 Europe: Market Size, By Deployment Type, 2015�2022 (USD Million)
Table 25 Europe: Market Size, By End-User, 2015�2022 (USD Million)
Table 26 Asia Pacific: Market Size, By Application, 2015�2022 (USD Million)
Table 27 Asia Pacific: Market Size, By Deployment Type, 2015�2022 (USD Million)
Table 28 Asia Pacific: Market Size, By End-User, 2015�2022 (USD Million)
Table 29 Middle East and Africa: Market Size, By Application, 2015�2022 (USD Million)
Table 30 Middle East and Africa: Market Size, By Deployment Type, 2015�2022 (USD Million)
Table 31 Middle East and Africa: Market Size, By End-User, 2015�2022 (USD Million)
Table 32 Latin America: Market Size, By Application, 2015�2022 (USD Million)
Table 33 Latin America: Market Size, By Deployment Type, 2015�2022 (USD Million)
Table 34 Latin America: Market Size, By End-User, 2015�2022 (USD Million)
Table 35 Market Ranking for Visualization and 3D Rendering Software Market, 2017
List of Figures (37 Figures)
Figure 1 Visualization and 3D Rendering Software Market Segmentation
Figure 2 Market Research Design
Figure 3 Breakdown of Primary Interviews: By Company, Designation, and Region
Figure 4 Data Triangulation
Figure 5 Market Size Estimation Methodology: Bottom-Up Approach
Figure 6 Market Size Estimation Methodology: Top-Down Approach
Figure 7 Market: Assumptions
Figure 8 Marketing and Advertisement Application is Expected to Exhibit the Highest Growth Rate During the Forecast Period
Figure 9 On-Premises Deployment is Expected to Have the Largest Market Share in 2017
Figure 10 Academia Segment is Expected to Showcase the Highest Growth Rate During the Forecast Period
Figure 11 Middle East and Africa is Expected to Have the Highest CAGR During the Forecast Period
Figure 12 Just-In-Time Marketing is Driving the Visualization and 3D Rendering Software Market
Figure 13 Marketing and Advertisement Segment is Expected to Grow at the Highest CAGR During the Forecast Period
Figure 14 North America is Estimated to Hold the Largest Share in the Market (2017)
Figure 15 Middle East and Africa is Expected to Have the Highest Growth Potential During the Forecast Period
Figure 16 Middle East and Africa is Expected to Be the Fastest-Growing Region
Figure 17 North America and Europe are the Mature Markets Due to the Presence of Major Vendors in These Regions
Figure 18 Visualization and 3D Rendering Software Market Segmentation By Application
Figure 19 Market Segmentation By Deployment Type
Figure 20 Market Segmentation By End-User
Figure 21 Market Segmentation By Region
Figure 22 Market Drivers, Restraints, Opportunities, and Challenges
Figure 23 Marketing and Advertisement Application is Expected to Exhibit the Highest Growth Rate During the Forecast Period
Figure 24 Cloud-Based Deployment Segment is Expected to Exhibit the Highest Growth Rate During the Forecast Period
Figure 25 Academia End-User Segment is Expected to Exhibit the Highest Growth Rate During the Forecast Period
Figure 26 Middle East and Africa is Expected to Grow at the Highest CAGR During the Forecast Period
Figure 27 Regional Snapshot: Middle East and Africa is Expected to Exhibit the Highest Growth Rate During the Forecast Period
Figure 28 North America: Visualization and 3D Rendering Software Market Snapshot
Figure 29 Middle East and Africa: Market Snapshot
Figure 30 Dive Chart
Figure 31 Autodesk, Inc.: Company Snapshot
Figure 32 Siemens AG: Company Snapshot
Figure 33 Adobe Systems Incorporated: Company Snapshot
Figure 34 Dassault Syst�mes: Company Snapshot
Figure 35 Nvidia Corporation: Company Snapshot
Figure 36 Trimble, Inc.: Company Snapshot (2016)
Figure 37 SAP SE: Company Snapshot


Growth opportunities and latent adjacency in Visualization and 3D Rendering Software Market