Vascular Graft Market by Indication (EVAR, Abdominal Aneurysm Repair, Thoracic Aneurysm, Peripheral Vascular Repair), Raw Material (Polyester, ePTFE, Polyurethane, Biosynthetic), End Users (Hospital, Ambulatory Surgery Center) & Region
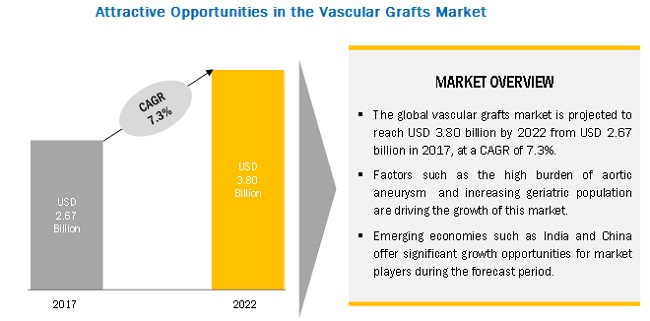
The global vascular grafts market is expected to grow at a CAGR of 7.3%. The major factors driving the growth of this market are the high burden of abdominal aneurysms, increasing geriatric population, and increasing prevalence of smoking & other risk factors that promote aneurysm.
Vascular graft or vascular bypass is a surgical procedure performed to bypass a diseased artery by redirecting blood from an area of normal blood flow to another relatively normal area. There are different vascular grafts based on the indication and raw materials used for the graft to suit the host tissue. Vascular grafts are used for hemodialysis vascular access and endovascular aneurysm & thoracic aneurysm repair.

“By raw material, the polyester grafts segment to hold the largest market share during the forecast period.”
The polyester grafts segment is expected to hold the largest market share, mainly due to the high use of this material in vascular grafts and its long lifespan. This segment is also estimated to register the highest CAGR during the forecast period.
“By indication, the endovascular aneurysm repair segment to record the highest CAGR and to retain the largest share in the market.”
The growth of this segment is mainly driven by the rising adoption of endovascular aneurysm repair surgical procedures, increasing preference for minimally invasive surgical procedures over open surgeries, and growing geriatric population.
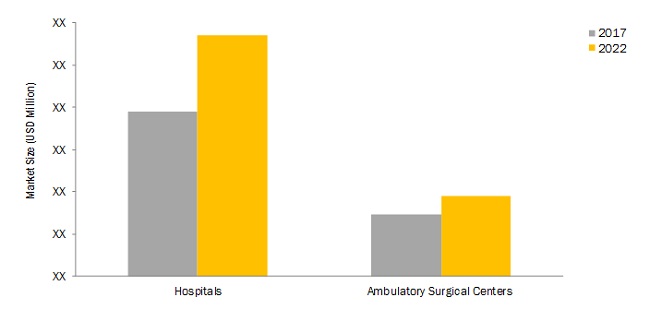
“By end-user, the hospitals segment is expected to grow at the highest CAGR during the forecast period.”
The hospitals segment is expected to grow at the highest CAGR during the forecasted period. The high growth of this segment is attributed to factors such as the rising number of minimally invasive surgical procedures in hospitals & cardiac centers and the favorable reimbursement scenario in most developed countries.

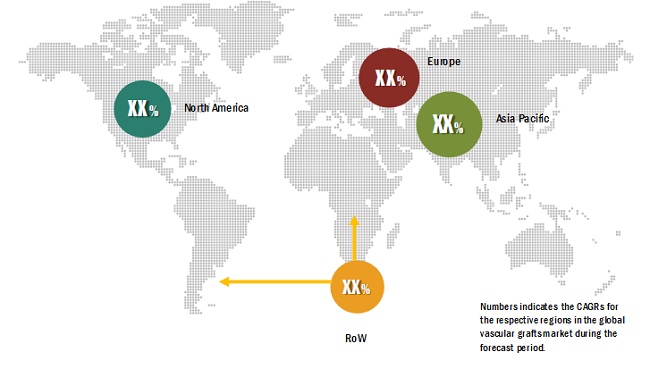
“APAC to lead the global vascular grafts market during the forecast period.”
The increasing growth of the Asia Pacific market can be attributed to the rising prevalence of CKD, healthcare reforms, government initiatives and investments, and rapid growth in the geriatric population. Also, emerging markets, such as Australia, Singapore, Japan, and China, offer numerous growth opportunities for players operating in the vascular grafts market due to the increasing geriatric population, increasing end-stage renal disorders.

Market Dynamics
Driver: Increasing incidence of ESRD
According to the University of California, approximately 2 million people worldwide suffer from ESRD. Annually, ESRD affects around 650,000 people in the US. Japan, Taiwan, Mexico, the US, and Belgium currently have the highest prevalence of ESRD.
The only alternative to kidney transplantation is dialysis, which is frequently used by patients with ESRD. Hemodialysis treatment is done three times per week. Because of prolonged dialysis, the superficial veins of many patients are exhausted, and vascular grafts remain the only option to allow continued hemodialysis.
Also, according to the National Institute of Diabetes and Digestive and Kidney Diseases (2016), the overall prevalence of CKD in the US is ~14%. More than 0.6 million Americans have kidney failure. Of these, 0.4 million individuals are on dialysis.
Restraint: Product failures and recalls
Product failures can have severe or even lethal complications in patients. Over the years, several products offered by companies have been recalled from the market due to product malfunctions or other issues. Market developments can hurt the end-user perception of the safety of grafts and, in turn, affect their adoption in treatment procedures.
Opportunity : Emerging markets
Emerging markets, such as Australia, Singapore, Japan, and China, offer significant growth opportunities for players operating in the vascular grafts market. According to the NCBI, in Japan, between 2007and 2015, 985 out of 999 patients who underwent EVAR were older than 50 years. As Japan has the highest proportion of geriatric individuals, an increase in this population segment will result in the increasing incidence of aortic aneurysms. According to 2014 estimates of the Ministry of Internal Affairs and Communication, 33.0% of the Japanese population is above the age of 60. By 2050, it is expected that 40% of Japan’s population will be over 65.
These markets are expected to witness high growth in the coming years owing to their comparatively lenient regulatory policies and the increasing burden of aneurysms. This has prompted major players to expand their geographic reach to emerging markets. For instance, in May 2016, Medtronic Inc. (US) opened its Asia Pacific regional headquarters in Singapore to support and strengthen its operations in 80 locations across the Asia Pacific.
Vascular Graft Market Scope
|
Report Metric |
Details |
|
Market size available for years |
2015–2022 |
|
Base year considered |
2016 |
|
Forecast period |
2017–2022 |
|
Forecast units |
USD million |
|
Segments covered |
Raw Material, Indication, End User, and Region |
|
Geographies covered |
North America, Europe, APAC, and Rest of the World (RoW) |
|
Companies covered |
B. Braun (Germany), C. R. Bard (US), Cardinal Health (US), Cook Medical (US), Endologix (US), LeMaitre Vascular (US), Medtronic (Ireland), Maquet (Germany), Terumo (Japan), and Gore Medical (US) |
This report categorizes the market into the following segments:
Vascular Graft Market by Raw Material
- Polyester Grafts
- ePTFE
- Polyurethane Grafts
- Biosynthetic Grafts
Vascular Graft Market by Indication
-
Endovascular Aneurysm Repair
- Abdominal Aortic Aneurysms Repair
- Thoracic Aortic Aneurysm Repair
- Peripheral Vascular
- Hemodialysis Access
Vascular Graft Market by End User
- Hospitals
- Ambulatory Surgical Centers
Vascular Graft Market by Region
-
North America
- US
- Canada
-
Europe
- UK
- Germany
- France
- Italy
- Rest of Europe
-
Asia Pacific
- China
- Australia
- Japan
- India
- Rest of APAC
- Rest of the World
Key Market Players
Medtronic (Ireland), B. Braun (Germany), Endologix (US), Terumo (Japan), C. R. Bard (US)
Recent Developments
In October 2017, Medtronic received FDA approval for Medtronic Endurant II/IIs, a thoracic stent graft system, to use with the Heli-FX EndoAnchor system.
- In April 2017, Endologix Inc. signed an agreement with Deerfield Management, a leading healthcare investment organization, to allot funding worth USD 170 million.
- In January 2017, Endologix received reinstatement of the CE Mark for AFX and AFX 2 Endovascular AAA System.
Frequently Asked Questions (FAQs):
What is the size of Vascular Graft Market?
The global vascular grafts market is expected to grow at a CAGR of 7.3%.
What are the major growth factors of Vascular Graft Market?
The major factors driving the growth of this market are the high burden of abdominal aneurysms, increasing geriatric population, and increasing prevalence of smoking & other risk factors that promote aneurysm.
Who all are the prominent players of Vascular Graft Market?
Key players operating in this market are B. Braun (Germany), C. R. Bard (US), Cardinal Health (US), Cook Medical (US), Endologix (US), LeMaitre Vascular (US), Medtronic (Ireland), Maquet (Germany), Terumo (Japan), and Gore Medical (US).
To speak to our analyst for a discussion on the above findings, click Speak to Analyst

Table of Contents
1 Introduction (Page No. - 11)
1.1 Objectives of the Study
1.2 Definition
1.3 Study Scope
1.3.1 Markets Covered
1.4 Years Considered for the Study
1.5 Currency
1.6 Limitations
1.7 Stakeholders
2 Research Methodology (Page No. - 14)
2.1 Research Data
2.1.1 Secondary Data
2.1.1.1 Secondary Sources
2.1.2 Primary Data
2.1.2.1 Key Data From Primary Sources
2.2 Market Size Estimation
2.2.1 Bottom-Up Approach
2.2.2 Top-Down Approach
2.3 Market Breakdown and Data Triangulation
2.4 Assumptions
3 Executive Summary (Page No. - 22)
4 Premium Insights (Page No. - 25)
4.1 Market: Overview
4.2 Global Market, By End User
4.3 Europe: Market, By Raw Material
4.4 Geographic Snapshot of the Market
5 Market Overview (Page No. - 28)
5.1 Introduction
5.2 Market Dynamics
5.2.1 Drivers
5.2.1.1 Growth in the Aging Population and the Associated Increase in the Prevalence of Aneurysm
5.2.1.2 Increasing Prevalence of Smoking
5.2.1.3 Increasing Incidence of ESRD
5.2.1.4 Growing Adoption of Minimally Invasive Surgeries
5.2.2 Restraint
5.2.2.1 Product Failures and Recalls
5.2.3 Opportunity
5.2.3.1 Emerging Markets
5.2.4 Trend
5.2.4.1 Development of Biosynthetic Vascular Grafts
6 Vascular Graft Market, By Raw Material (Page No. - 33)
6.1 Introduction
6.2 Polyester Grafts
6.3 EPTFE Grafts
6.4 Polyurethane Grafts
6.5 Biosynthetic Grafts
7 Global Vascular Graft Market, By Indication (Page No. - 39)
7.1 Introduction
7.2 Endovascular Aneurysm Repair
7.2.1 Abdominal Aortic Aneurysms Repair
7.2.2 Thoracic Aortic Aneurysm Repair
7.3 Peripheral Vascular Repair
7.4 Hemodialysis Access
8 Vascular Graft Market, By End User (Page No. - 45)
8.1 Introduction
8.2 Hospitals
8.3 Ambulatory Surgical Centers
9 Vascular Graft Market, By Region (Page No. - 49)
9.1 Introduction
9.2 North America
9.2.1 US
9.2.2 Canada
9.3 Europe
9.3.1 Germany
9.3.2 UK
9.3.3 France
9.3.4 Italy
9.3.5 RoE
9.4 Asia Pacific
9.4.1 China
9.4.2 Japan
9.4.3 Australia
9.4.4 India
9.4.5 RoAPAC
9.5 Rest of the World
10 Competitive Landscape (Page No. - 81)
10.1 Overview
10.2 Market Share Analysis, 2016
10.3 Competitive Scenario
10.3.1 Product Launhces
10.3.2 Acquisitions
10.3.3 Expansions
10.3.4 Agreements
10.3.5 Other Developments
11 Company Profiles (Page No. - 85)
(Introduction, Products & Services, Strategy, & Analyst Insights, Developments, MnM View)*
11.1 Medtronic
11.2 Terumo
11.3 C. R. Bard
11.4 B. Braun Melsungen AG
11.5 Cardinal Health
11.6 Endologix
11.7 Lemaitre Vascular
11.8 Cook Medical
11.9 Maquet
11.10 Gore Medical
*Details on Marketsandmarkets View, Introduction, Product & Services, Strategy, & Analyst Insights, New Developments Might Not Be Captured in Case of Unlisted Companies.
12 Appendix (Page No. - 104)
12.1 Insights From Industry Experts
12.2 Discussion Guide
12.3 Knowledge Store: Marketsandmarkets’ Subscription Portal
12.4 Introducing RT: Real-Time Market Intelligence
12.5 Available Customizations
12.6 Related Reports
12.7 Author Details
List of Tables (75 Tables)
Table 1 Vascular Graft Market, By Raw Material, 2015–2022 (USD Million)
Table 2 Examples of Polyester Grafts Offered By Market Leaders
Table 3 Polyester Market, By Region, 2015–2022 (USD Million)
Table 4 Synthetic Polymers: in Vivo Vascular Regeneration
Table 5 Examples of EPTFE Grafts Offered By Market Leaders
Table 6 EPTFE Market, By Region, 2015–2022 (USD Million)
Table 7 Examples of Polyurethane Grafts Offered By Market Leaders
Table 8 Polyurethane Market, By Region, 2015–2022 (USD Million)
Table 9 Biosynthetic Market, By Region, 2015–2022 (USD Million)
Table 10 Vascular Graft Market, By Indication, 2015–2022 (USD Million)
Table 11 EVAR Grafts Market, By Type, 2015–2022 (USD Million)
Table 12 EVAR Grafts Market, By Region, 2015–2022 (USD Million)
Table 13 Abdominal Aortic Aneurysm Repair Market, By Region, 2015–2022 (USD Million)
Table 14 Thoracic Aortic Aneurysm Repair Market, By Region, 2015–2022 (USD Million)
Table 15 Peripheral Vascular Repair Grafts Market, By Region, 2015–2022 (USD Million)
Table 16 Hemodialysis Access Grafts Market, By Region, 2015–2022 (USD Million)
Table 17 Global Market, By End User, 2015–2022 (USD Million)
Table 18 Global Market for Hospitals, By Region, 2015–2022 (USD Million)
Table 19 Global Market for Ambulatory Surgical Centers, By Region, 2015–2022 (USD Million)
Table 20 Global Market, By Region, 2015–2022 (USD Million)
Table 21 North America: Market, By Country, 2015–2022 (USD Million)
Table 22 North America: Market, By Raw Material, 2015–2022 (USD Million)
Table 23 North America: Market, By Indication, 2015–2022 (USD Million)
Table 24 North America: Market, By End User, 2015–2022 (USD Million)
Table 25 Indicative List of Recent Events in the Us
Table 26 US: Market, By Raw Material, 2015–2022 (USD Million)
Table 27 US : Market, By Indication, 2015–2022 (USD Million)
Table 28 US: Market, By End User, 2015–2022 (USD Million)
Table 29 Canada: Market, By Raw Material, 2015–2022 (USD Million)
Table 30 Canada: Market, By Indication, 2015–2022 (USD Million)
Table 31 Canada: Market, By End User, 2015–2022 (USD Million)
Table 32 Geriatric Population in European Countries (As A Percentage of the Total), 2005 vs 2015 vs 2025
Table 33 Europe: Market, By Country, 2015–2022 (USD Million)
Table 34 Europe: Market, By Raw Material, 2015–2022 (USD Million)
Table 35 Europe: Market, By Indication, 2015–2022 (USD Million)
Table 36 Europe: Market, By End User, 2015–2022 (USD Million)
Table 37 Germany: Market, By Raw Material, 2015–2022 (USD Million)
Table 38 Germany: Market, By Indication, 2015–2022 (USD Million)
Table 39 Germany: Market, By End User, 2015–2022 (USD Million)
Table 40 UK: Market, By Raw Material, 2015–2022 (USD Million)
Table 41 UK: Market, By Indication, 2015–2022 (USD Million)
Table 42 UK: Market, By End User, 2015–2022 (USD Million)
Table 43 France: Market, By Raw Material, 2015–2022 (USD Million)
Table 44 France: Market, By Indication, 2015–2022 (USD Million)
Table 45 France: Market, By End User, 2015–2022 (USD Million)
Table 46 Italy: Vascular Graft Market, By Raw Material, 2015–2022 (USD Million)
Table 47 Italy: Market, By Indication, 2015–2022 (USD Million)
Table 48 Italy: Market, By End User, 2015–2022 (USD Million)
Table 49 RoE: Market, By Raw Material, 2015–2022 (USD Million)
Table 50 RoE: Market, By Indication, 2015–2022 (USD Million)
Table 51 RoE: Market, By End User, 2015–2022 (USD Million)
Table 52 Proportion of Older Persons in Labour Force Aged 65+, for Selected Countries (2016)
Table 53 Asia Pacific: Market, By Country, 2015–2022 (USD Million)
Table 54 Asia Pacific: Market, By Raw Material, 2015–2022 (USD Million)
Table 55 Asia Pacific: Market, By Indication, 2015–2022 (USD Million)
Table 56 Asia Pacific: Market, By End User, 2015–2022 (USD Million)
Table 57 China: Market, By Raw Material, 2015–2022 (USD Million)
Table 58 China: Market, By Indication, 2015–2022 (USD Million)
Table 59 China: Market, By End User, 2015–2022 (USD Million)
Table 60 Japan: Market, By Raw Material, 2015–2022 (USD Million)
Table 61 Japan: Market, By Indication, 2015–2022 (USD Million)
Table 62 Japan: Market, By End User, 2015–2022 (USD Million)
Table 63 Australia: Market, By Raw Material, 2015–2022 (USD Million)
Table 64 Australia: Market, By Indication, 2015–2022 (USD Million)
Table 65 Australia: Market, By End User, 2015–2022 (USD Million)
Table 66 India: Vascular Graft Market, By Raw Material, 2015–2022 (USD Million)
Table 67 India: Market, By Indication, 2015–2022 (USD Million)
Table 68 India: Market, By End User, 2015–2022 (USD Million)
Table 69 RoAPAC: Market, By Raw Material, 2015–2022 (USD Million)
Table 70 RoAPAC: Market, By Indication, 2015–2022 (USD Million)
Table 71 RoAPAC: Market, By End User, 2015–2022 (USD Million)
Table 72 Obesity Prevalence in Latin America, By Country, 2014
Table 73 RoW: Market, By Raw Material, 2015–2022 (USD Million)
Table 74 RoW: Market, By Indication, 2015–2022 (USD Million)
Table 75 RoW: Market, By End User, 2015–2022 (USD Million)
List of Figures (31 Figures)
Figure 1 Global Vascular Graft Market
Figure 2 Research Design
Figure 3 Breakdown of Primary Interviews: By Company Type, Designation, and Region
Figure 4 Data Triangulation Methodology
Figure 5 Market, By Raw Material, 2017 vs 2022 (USD Billion)
Figure 6 Market, By Indication, 2017 vs 2022 (USD Billion)
Figure 7 Market, By End User 2017 vs 2022 (USD Billion)
Figure 8 Market, By Region, 2017 vs 2022 (USD Billion)
Figure 9 Increasing Geriatric Population and High Prevalence of Aneurysms to Drive the Market
Figure 10 Hospitals to Dominate the Market During the Forecast Period
Figure 11 Polyester Grafts to Dominate the European Market in 2017
Figure 12 Asia Pacific to Register the Highest CAGR During the Forecast Period
Figure 13 Market: Drivers, Restraints, Opportunities, and Trends
Figure 14 Global Geriatric Population (60 Years and Above), 2015 vs 2030 (Million)
Figure 15 Polyester Grafts to Witness the Highest Growth During the Forecast Period
Figure 16 EVAR Segment to Witness the Highest Growth During the Forecast Period
Figure 17 Hospitals Segment to Witness the Highest Growth During the Forecast Period
Figure 18 Market in Asia Pacific to Witness the Highest Growth Rate During the Forecast Period
Figure 19 North America Market Snapshot
Figure 20 Europe Snapshot
Figure 21 Asia Pacific Market Snapshot
Figure 22 RoW Market Snapshot
Figure 23 Key Developments Adopted By the Top Players in Market Between 2014 and 2017
Figure 24 Shares of Companies in the Vascular Graft Market, 2016
Figure 25 Medtronic: Company Snapshot
Figure 26 Terumo: Company Snapshot
Figure 27 C. R. Bard: Company Snapshot
Figure 28 B. Braun Melsungen AG: Company Snapshot
Figure 29 Cardinal Health: Company Snapshot
Figure 30 Endologix: Company Snapshot
Figure 31 Lemaitre Vascular: Company Snapshot


 Generating Response ...


Growth opportunities and latent adjacency in Vascular Graft Market