UV Absorbers Market by Type (Benzophenone, Benzotriazole, Triazine), Application (Plastics, Coatings, Adhesives, Personal Care), and Region (North America, Asia Pacific, Europe, South America, Middle East and Africa) - Global Forecast to 2022


[140 Pages Report] UV Absorbers Market was valued at USD 690.3 Million in 2016 and is projected to reach USD 1,006.4 Million by 2022, at a CAGR of 6.5% from 2017 to 2022. In this study, 2016 has been considered as the base year, and 2017�2022 as the forecast period for estimating the market size of UV absorbers.
Objectives of the Study:
- To analyze and forecast the UV absorber market, in terms of both volume and value
- To define, describe, and segment the UV absorbers market by type and application
- To forecast the size of each market segment for various regions, such as Asia Pacific, North America, Europe, Middle East & Africa, and South America
- To provide detailed information regarding the key factors, such as drivers, restraints, opportunities, and industry-specific challenges influencing the growth of the market
- To strategically analyze the segmented markets with respect to individual growth trends, prospects, and contribution to the overall market
- To identify and analyze opportunities for stakeholders in the UV absorbers market
- To analyze competitive developments, such as expansions, mergers & acquisitions, contracts, agreements, and new product developments in the UV absorber market
- To strategically profile key players and comprehensively analyze their core competencies
Research Methodology:
This study aims to estimate the market size for UV absorbers in 2017 and provide market forecast till 2022. It offers a detailed qualitative and quantitative analysis of the market. Various secondary sources, including the Paints & Coatings Industry (PCI), American Coatings Association (ACA), European Stabilizers Producers Association (ESPA), and United States Environmental Protection Agency (EPA) have been used to identify and collect information useful for an extensive and commercial study of the UV absorbers market. Primary sources, such as experts from related industries and suppliers have been interviewed to obtain and verify critical information, as well as to assess growth prospects of the UV absorbers market.
To know about the assumptions considered for the study, download the pdf brochure
Market Ecosystem
Key manufacturers of UV absorbers are BASF SE (Germany), Songwon (South Korea), Clariant AG (Switzerland), Solvay S.A. (Belgium), Adeka Corporation (Japan), Addivant (US), Everlight Chemical Industrial Co (Taiwan), Milliken Chemical (US), Sabo S.p.A. (Italy) and Huntsman Corporation (US). These manufacturers focus on improving their product portfolio and increasing their regional presence by adopting strategies such as new product development, mergers & acquisitions, expansions, and partnerships.
Key Target Audience
- Manufacturers of UV Absorbers
- Traders, Distributors, and Suppliers of UV Absorbers
- Regional Manufacturers' Associations for UV Absorbers
- Government and Regional Agencies and Research Organizations
Scope of the Report:
The UV absorbers market has been classified into the following segments:
Based on Application:
- Plastics
- Coatings
- Adhesives
- Personal Care
- Others
Based on Chemistry:
- Benzophenone
- Benzotriazole
- Triazine
- Others
Based on Region:
- Asia Pacific
- North America
- Europe
- Middle East & Africa
- South America
Available Customizations:
With the given market data, MarketsandMarkets offers customizations according to the company�s specific needs. The following customization options are available for the report:
- Product Analysis
Product Matrix that offers a detailed comparison of product portfolio of each company
- Regional Analysis
Further breakdown of a region with respect to a particular country
- Company Information
Detailed analysis and profiling of additional market players (up to five)
The UV absorbers market is projected to reach USD 1,006.4 Million by 2022, at a CAGR of 6.5% between 2017 and 2022. UV absorbers are polymer additives that are used to enhance the performance, shelf life, durability, and stability of plastics, polymers, and wood components. These components are used in various applications such as building & construction, packaging, automotive, agriculture, and adhesives & sealants. The growth of the UV absorbers market is primarily driven by the increasing demand from applications such as plastics, coatings, adhesives, and personal care. UV absorbers is also a major type of UV stabilizer used in neutral or transparent applications to provide effective UV resistance for short term exposures. Plastics is considered as one of the major applications for UV absorbers in emerging as well as developed economies.
The UV absorber market can be segmented on the basis of application into plastics, coatings, adhesives, and personal care. These are also used in rubber, textiles, and printing inks, among others. The plastics segment has the largest market share and is also the fastest-growing segment. The growth of the plastics application segment is primarily driven by the rising demand for plastics from packaging, automotive, and agricultural films.
Asia Pacific, Europe, and North America are the key UV absorbers markets. The market in the Asia Pacific region is anticipated to grow at the highest CAGR between 2017 and 2022, in terms of both value and volume. This growth is mainly attributed to the increasing use of UV absorbers in industrial hubs. The growing use of plastics in automotive, packaging, and agricultural films is further driving the demand for UV absorbers in the Asia Pacific region.
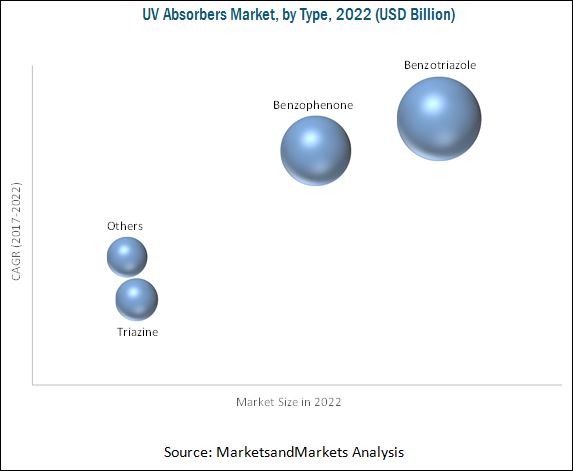
The UV absorbers market has been segmented by type into benzotriazole, benzophenone, and triazine, among others. The benzotriazole type is the largest segment of the UV absorber market, in terms of both value and volume. Benzotriazole are used in a wide range of coating applications, such as personal care, adhesives, coatings, printing, and plastics, among others, to protect polymers from UV radiation. Benzophenone is the second fastest-growing type segment of the UV absorbers market, in terms of both value and volume. This growth is mainly attributed to their extensive use in industries such as automotive, packaging, coatings, adhesives, and personal care, among others. The cost of benzophenone is lowest amongst all.
The increasing price of raw materials of some UV absorbers is expected to restrain the growth of the UV absorber market. In addition, the availability of inorganic UV absorbers, which are an alternative to organic UV absorbers, is further restraining the growth of the market. Government regulations on some UV absorbers in some applications also act as a hindrance for the UV absorbers market growth. BASF SE (Germany), Huntsman Corporation (US), Clariant AG (Switzerland), Solvay S.A. (Belgium), Everlight Chemical Industrial Co. (Taiwan), Songwon (South Korea), Adeka Corporation (Japan), Milliken Chemical (US), Addivant (US), and SABO S.p.A. (Italy) are the leading companies in the UV absorber market. These companies are expected to account for a significant market share in the near future.
To speak to our analyst for a discussion on the above findings, click Speak to Analyst
 Exclusive indicates content/data unique to MarketsandMarkets and not available with any competitors.
Table of Contents
1 Introduction (Page No. - 14)
1.1 Objectives of the Study
1.2 Market Definition
1.3 Markets Scope
1.3.1 Years Considered for the Study
1.4 Package Size
1.5 Currency
1.6 Limitations
1.7 Stakeholders
2 Research Methodology (Page No. - 18)
2.1 Research Data
2.1.1 Secondary Data
2.1.1.1 Key Data From Secondary Sources
2.1.2 Primary Data
2.1.2.1 Key Data From Primary Sources
2.1.2.2 Key Industry Insights
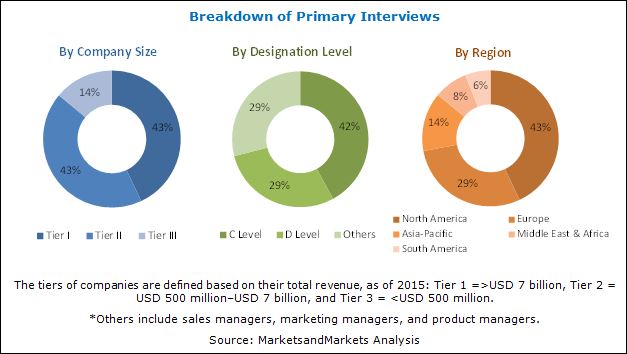
2.1.2.3 Breakdown of Primary Interviews
2.2 Market Size Estimation
2.2.1 Bottom-Up Approach
2.2.2 Top-Down Approach
2.3 Data Triangulation
2.4 Research Assumptions
3 Executive Summary (Page No. - 26)
4 Premium Insights (Page No. - 29)
4.1 Attractive Opportunities in Global UV Absorbers Market
4.2 Global UV Absorber Market Growth, By Region
4.3 Global UV Absorbers Market, By Type and Region, 2016
4.4 Global UV Absorber Market Attractiveness
4.5 Global UV Absorbers Market, By Type
5 Market Overview (Page No. - 32)
5.1 Introduction
5.2 Market Dynamics
5.2.1 Drivers
5.2.1.1 Increasing Demand for Greenhouse Films in Agricultural Applications
5.2.1.2 Increasing Demand for Wood Coatings in North America
5.2.1.3 Increasing Demand for UV Absorbers in APAC
5.2.2 Restraints
5.2.2.1 Fluctuating Cost of UV Absorbers
5.2.3 Opportunities
5.2.3.1 Increasing Demand for Green Coatings
5.2.4 Challenges
5.2.4.1 Stringent Government Regulations
5.2.4.2 Increasing Use of Inorganic Nano Composites in UV Absorbers
5.3 Porter�s Five Forces Analysis
5.3.1 Threat of New Entrants
5.3.2 Threat of Substitutes
5.3.3 Bargaining Power of Suppliers
5.3.4 Bargaining Power of Buyers
5.3.5 Intensity of Competitive Rivalry
5.4 Macroeconomic Overview
5.4.1 Introduction
5.4.2 GDP Trends and Forecast
5.4.3 Global Automotive Industry Outlook
6 Global UV Absorbers Market, By Type (Page No. - 42)
6.1 Introduction
6.2 Benzophenone
6.3 Benzotriazole
6.4 Triazine
6.5 Others
7 Global UV Absorbers Market, By Application (Page No. - 49)
7.1 Introduction
7.2 Plastics
7.3 Coatings
7.4 Adhesives
7.5 Personal Care
7.6 Others
8 Global UV Absorber Market, By Region (Page No. - 58)
8.1 Introduction
8.2 North America
8.2.1 U.S.
8.2.2 Canada
8.2.3 Mexico
8.3 Europe
8.3.1 Germany
8.3.2 Italy
8.3.3 France
8.3.4 U.K.
8.3.5 Turkey
8.3.6 Rest of Europe
8.4 APAC
8.4.1 China
8.4.2 Japan
8.4.3 South Korea
8.4.4 India
8.4.5 Taiwan
8.4.6 Thailand
8.4.7 Rest of APAC
8.5 MEA
8.5.1 Saudi Arabia
8.5.2 UAE
8.5.3 South Africa
8.5.4 Rest of Mea
8.6 South America
8.6.1 Brazil
8.6.2 Argentina
8.6.3 Rest of South America
9 Competitive Landscape (Page No. - 98)
9.1 Introduction
9.1.1 Visionary Leaders
9.1.2 Innovators
9.1.3 Dynamic Differentiators
9.1.4 Emerging Companies
9.2 Competitive Benchmarking
9.2.1 Strength of Product Portfolio (25 Players)
9.2.2 Business Strategy Excellence (25 Players)
9.3 Market Ranking
10 Company Profiles (Page No. - 103)
(Business Overview, Products Offered, Scorecard of Product Offering, Scorecard of Business Strategy, and New Product Launch)
10.1 BASF SE
10.2 Songwon Industrial Co., Ltd.
10.3 Clariant
10.4 Solvay
10.5 Adeka Corporation
10.6 Addivant
10.7 3V Sigma S.P.A.
10.8 Everlight Chemical Industrial Co.
10.9 Milliken Chemical
10.10 Sabo S.P.A.
10.11 Other Key Market Players
10.11.1 Apexical, Inc.
10.11.2 Dalian Richfortune Chemicals Co., Ltd.
10.11.3 Chemipro Kasei Kaisha, Ltd.
10.11.4 Chitec Technology Co., Ltd.
10.11.5 Valtris Specialty Chemicals
10.11.6 Lycus Ltd., LLC
10.11.7 Mayzo, Inc.
10.11.8 Everspring Chemical Co., Ltd.
10.11.9 Lambson Limited
10.11.10 MPI Chemie B.V.
10.11.11 Tianjin Jiuri New Material Co., Ltd.
10.11.12 Nanjing Union Rubber and Chemicals Co., Ltd.
10.11.13 Jingmen Meifeng Chemical Co., Ltd
10.11.14 Double Bond Chemical Ind., Co., Ltd.
10.11.15 Huntsman Corporation
*Details Might Not Be Captured in Case of Unlisted Companies.
11 Appendix (Page No. - 132)
11.1 Insights From Industry Experts
11.2 Discussion Guide
11.3 Knowledge Store: Marketsandmarkets Subscription Portal
11.4 Introducing RT: Real-Time Market Intelligence
11.5 Available Customizations
11.6 Related Reports
11.7 Author Details
List of Tables (102 Tables)
Table 1 GDP Trends and Forecast, 2016�2022 (USD Billion)
Table 2 Automotive Production Statistics, 2016
Table 3 Global UV Absorbers Market Size, By Type, 2015�2022 (Kilotons)
Table 4 Global UV Absorber Market Size, By Type, 2015�2022 (USD Million)
Table 5 Benzophenone UV Absorbers Market Size, By Region, 2015�2022 (Kilotons)
Table 6 Benzophenone UV Absorber Market Size, By Region, 2015�2022 (USD Million)
Table 7 Benzotriazole UV Absorbers Market Size, By Region, 2015�2022 (Kilotons)
Table 8 Benzotriazole UV Absorber Market Size, By Region, 2015�2022 (USD Million)
Table 9 Triazine UV Absorbers Market Size, By Region, 2015�2022 (Kilotons)
Table 10 Triazine UV Absorber Market Size, By Region, 2015�2022 (USD Million)
Table 11 Others UV Absorbers Market Size, By Region, 2015�2022 (Kilotons)
Table 12 Others UV Absorber Market Size, By Region, 2015�2022 (USD Million)
Table 13 Global UV Absorbers Market Size, By Application, 2015�2022 (Kilotons)
Table 14 Global UV Absorber Market Size, By Application, 2015�2022 (USD Million)
Table 15 UV Absorbers Market Size in Plastics, By Region, 2015�2022 (Kilotons)
Table 16 UV Absorber Market Size in Plastics, By Region, 2015�2022 (USD Million)
Table 17 UV Absorbers Market Size in Coatings, By Region, 2015�2022 (Kilotons)
Table 18 UV Absorber Market Size in Coatings, By Region, 2015�2022 (USD Million)
Table 19 UV Absorbers Market Size in Adhesives, By Region, 2015�2022 (Kilotons)
Table 20 UV Absorber Market Size in Adhesives, By Region, 2015�2022 (USD Million)
Table 21 UV Absorbers Market Size in Personal Care, By Region, 2015�2022 (Kilotons)
Table 22 UV Absorber Market Size in Personal Care, By Region, 2015�2022 (USD Million)
Table 23 UV Absorbers Market Size in Others, By Region, 2015�2022 (Kilotons)
Table 24 UV Absorber Market Size in Others, By Region, 2015�2022 (USD Million)
Table 25 Global UV Absorbers Market Size, By Region, 2015�2022 (Kilotons)
Table 26 Global UV Absorber Market Size, By Region, 2015�2022 (USD Million)
Table 27 North America: UV Absorbers Market Size, By Country, 2015�2022 (Kilotons)
Table 28 North America: Market Size, By Country, 2015�2022 (USD Million)
Table 29 North America: Market Size, By Application, 2015�2022 (Kilotons)
Table 30 North America: Market Size, By Application, 2015�2022 (USD Million)
Table 31 North America: Market Size, By Type, 2015�2022 (Kilotons)
Table 32 North America: Market Size, By Type, 2015�2022 (USD Million)
Table 33 U.S.: UV Absorbers Market Size, By Application, 2015�2022 (Kilotons)
Table 34 U.S.: Market Size, By Application, 2015�2022 (USD Million)
Table 35 Canada: UV Absorber Market Size, By Application, 2015�2022 (Kilotons)
Table 36 Canada: Market Size, By Application, 2015�2022 (USD Million)
Table 37 Mexico: UV Absorbers Market Size, By Application, 2015�2022 (Kilotons)
Table 38 Mexico: Market Size, By Application, 2015�2022 (USD Million)
Table 39 Europe: UV Absorber Market Size, By Country, 2015�2022 (Kilotons)
Table 40 Europe: Market Size, By Country, 2015�2022 (USD Million)
Table 41 Europe: Market Size, By Type, 2015�2022 (Kilotons)
Table 42 Europe: Market Size, By Type, 2015�2022 (USD Million)
Table 43 Europe: Market Size, By Application, 2015�2022 (Kilotons)
Table 44 Europe: Market Size, By Application, 2015�2022 (USD Million)
Table 45 Germany: UV Absorbers Market Size, By Application, 2015�2022 (Kilotons)
Table 46 Germany: Market Size, By Application, 2015�2022 (USD Million)
Table 47 Italy: UV Absorbers Market Size, By Application, 2015�2022 (Kilotons)
Table 48 Italy: Market Size, By Application, 2015�2022 (USD Million)
Table 49 France: UV Absorber Market Size, By Application, 2015�2022 (Kilotons)
Table 50 France: Market Size, By Application, 2015�2022 (USD Million)
Table 51 U.K.: UV Absorbers Market Size, By Application, 2015�2022 (Kilotons)
Table 52 U.K.: Market Size, By Application, 2015�2022 (USD Million)
Table 53 Turkey: UV Absorber Market Size, By Application, 2015�2022 (Kilotons)
Table 54 Turkey: Market Size, By Application, 2015�2022 (USD Million)
Table 55 Rest of Europe: UV Absorbers Market Size, By Application, 2015�2022 (Kilotons)
Table 56 Rest of Europe: Market Size, By Application, 2015�2022 (USD Million)
Table 57 APAC: UV Absorber Market Size, By Country, 2015�2022 (Kilotons)
Table 58 APAC: Market Size, By Country, 2015�2022 (USD Million)
Table 59 APAC: Market Size, By Type, 2015�2022 (Kilotons)
Table 60 APAC: Market Size, By Type 2015�2022 (USD Million)
Table 61 APAC: Market Size, By Application, 2015�2022 (Kilotons)
Table 62 APAC: Market Size, By Application, 2015�2022 (USD Million)
Table 63 China: UV Absorbers Market Size, By Application, 2015�2022 (Kilotons)
Table 64 China: Market Size, By Application, 2015�2022 (USD Million)
Table 65 Japan: UV Absorber Market Size, By Application, 2015�2022 (Kilotons)
Table 66 Japan: Market Size, By Application, 2015�2022 (USD Million)
Table 67 South Korea: UV Absorbers Market Size, By Application, 2015�2022 (Kilotons)
Table 68 South Korea: Market Size, By Application, 2015�2022 (USD Million)
Table 69 India: UV Absorber Market Size, By Application, 2015�2022 (Kilotons)
Table 70 India: Market Size, By Application, 2015�2022 (USD Million)
Table 71 Taiwan: UV Absorbers Market Size, By Application, 2015�2022 (Kilotons)
Table 72 Taiwan: Market Size, By Application, 2015�2022 (USD Million)
Table 73 Thailand: UV Absorber Market Size, By Application, 2015�2022 (Kilotons)
Table 74 Thailand: Market Size, By Application, 2015�2022 (USD Million)
Table 75 Rest of APAC: UV Absorbers Market Size, By Application, 2015�2022 (Kilotons)
Table 76 Rest of APAC: Market Size, By Application, 2015�2022 (USD Million)
Table 77 MEA: UV Absorber Market Size, By Country, 2015�2022 (Kilotons)
Table 78 MEA: Market Size, By Country, 2015�2022 (USD Million)
Table 79 MEA: Market Size, By Application, 2015�2022 (Kilotons)
Table 80 MEA: Market Size, By Application, 2015�2022 (USD Million)
Table 81 MEA: Market Size, By Type, 2015�2022 (Kilotons)
Table 82 MEA: Market Size, By Type, 2015�2022 (USD Million)
Table 83 Saudi Arabia: UV Absorbers Market Size, By Application, 2015�2022 (Kilotons)
Table 84 Saudi Arabia: Market Size, By Application, 2015�2022 (USD Million)
Table 85 UAE: UV Absorber Market Size, By Application, 2015�2022 (Kilotons)
Table 86 UAE: Market Size, By Application, 2015�2022 (USD Million)
Table 87 South Africa: UV Absorbers Market Size, By Application, 2015�2022 (Kilotons)
Table 88 South Africa: Market Size, By Application, 2015�2022 (USD Million)
Table 89 Rest of MEA: UV Absorber Market Size, By Application, 2015�2022 (Kilotons)
Table 90 Rest of MEA: Market Size, By Application, 2015�2022 (USD Million)
Table 91 South America: UV Absorbers Market Size, By Country, 2015�2022 (Kilotons)
Table 92 South America; Market Size, By Country, 2015�2022 (USD Million)
Table 93 South America: Market Size, By Application, 2015�2022 (Kilotons)
Table 94 South America: Market Size, By Application, 2015�2022 (USD Million)
Table 95 South America: Market Size, By Type, 2015�2022 (Kilotons)
Table 96 South America: Market Size, By Type, 2015�2022 (USD Million)
Table 97 Brazil: UV Absorber Market Size, By Application, 2015�2022 (Kilotons)
Table 98 Brazil: Market Size, By Application, 2015�2022 (USD Million)
Table 99 Argentina: UV Absorbers Market Size, By Application, 2015�2022 (Kilotons)
Table 100 Argentina: Market Size, By Application, 2015�2022 (USD Million)
Table 101 Rest of South America: UV Absorber Market Size, By Application, 2015�2022 (Kilotons)
Table 102 Rest of South America: Market Size, By Application, 2015�2022 (USD Million)
List of Figures (26 Figures)
Figure 1 UV Absorbers Market: Research Methodology
Figure 2 Market Size Estimation: Bottom-Up Approach
Figure 3 Market Size Estimation: Top-Down Approach
Figure 4 UV Absorber Market: Data Triangulation
Figure 5 Plastics Segment to Record Highest CAGR, By Application, 2017-2022 (USD Million)
Figure 6 Benzotriazole Segment to Lead Global UV Absorbers Market, By Type, 2017-2022 (USD Million)
Figure 7 North America Dominated Global UV Absorber Market in 2016, By Value (USD Million)
Figure 8 Global UV Absorbers Market to Witness Rapid Growth Between 2017 and 2022
Figure 9 APAC to Record Highest CAGR, By Volume, 2017-2022 (Kilotons)
Figure 10 The North America Held Largest Share of Global UV Absorbers Market, By Volume, 2016
Figure 11 China to Record Highest CAGR, By Volume, 2017-2022
Figure 12 Benzotriazole Segment to Hold Largest Share, By Volume, 2017�2022 (Kilotons)
Figure 13 Drivers, Restraints, Opportunities, and Challenges in Global UV Absorber Market
Figure 14 Benzotriazole Segment to Register Highest CAGR, By Volume, 2017-2022 (Kilotons)
Figure 15 Plastics Segment to Lead Global UV Absorbers Market, By Value, 2017-2022 (USD Million)
Figure 16 Regional Snapshot (2017�2022): Rapid Growth Economic Zone in APAC is Emerging as New Hotspot
Figure 17 North America Market Snapshot
Figure 18 APAC Market Snapshot
Figure 19 Competitive Leadership Mapping, 2016
Figure 20 UV Absorber Market Ranking, 2016
Figure 21 BASF SE: Company Snapshot
Figure 22 Songwon: Company Snapshot
Figure 23 Clariant: Company Snapshot
Figure 24 Solvay: Company Snapshot
Figure 25 Adeka Corporation: Company Snapshot
Figure 26 Everlight Chemical Industrial Co.: Company Snapshot


Growth opportunities and latent adjacency in UV Absorbers Market